Last Updated on 1 month ago by Grace Nyambura
| Quick definition: Inductive thematic analysis is a qualitative research approach where themes emerge directly from your data — rather than being imposed from existing theory. Saldana’s method breaks this process into four clear steps: coding, categorizing, generating themes through analytic memoing, and connecting them to your research questions. |
- What Is Inductive Thematic Analysis? (Saldana's Approach)
- Step 1 — Identifying and Categorizing Codes in ATLAS.ti
- Step 2 — Developing High-Level Categories in ATLAS.ti
- Step 3 — Generating Themes Through Analytic Memoing in ATLAS.ti
- Step 4 — Connecting Themes to Your Research Questions
- Frequently Asked Questions
- Key Takeaways
If you want to conduct inductive thematic analysis in ATLAS.ti using Saldana’s method, you’re in the right place.
In this step-by-step guide, I’ll walk you through all four steps — from generating your first codes to connecting finished themes to your research questions — using real interview data and screenshots from ATLAS.ti.
Inductive thematic analysis is one of the most popular approaches to analyzing qualitative data, especially among PhD students working with interview transcripts. It lets your findings emerge naturally from what participants actually said, rather than forcing their words into pre-existing categories.
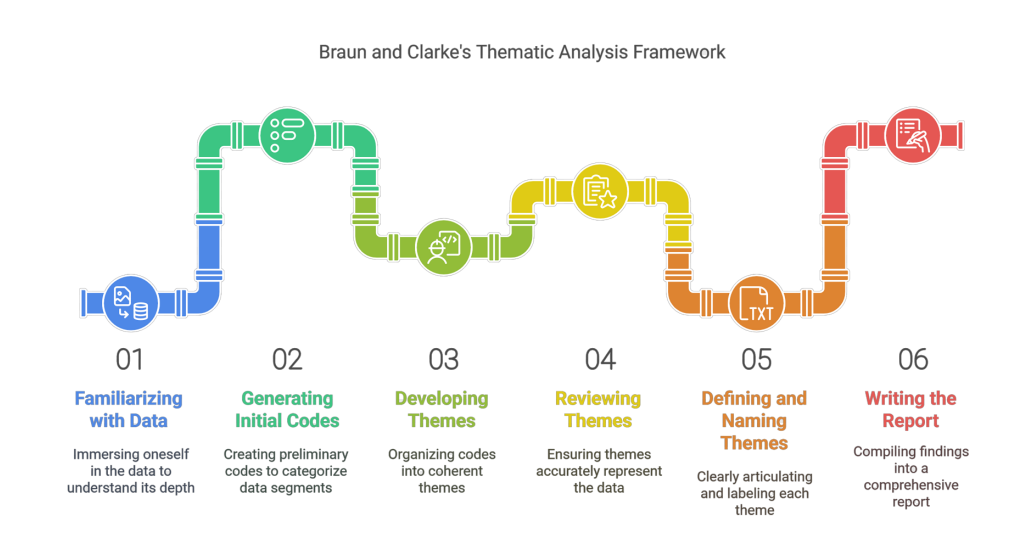
There are two main frameworks researchers use for thematic analysis. The first is the Braun and Clarke six-step framework.
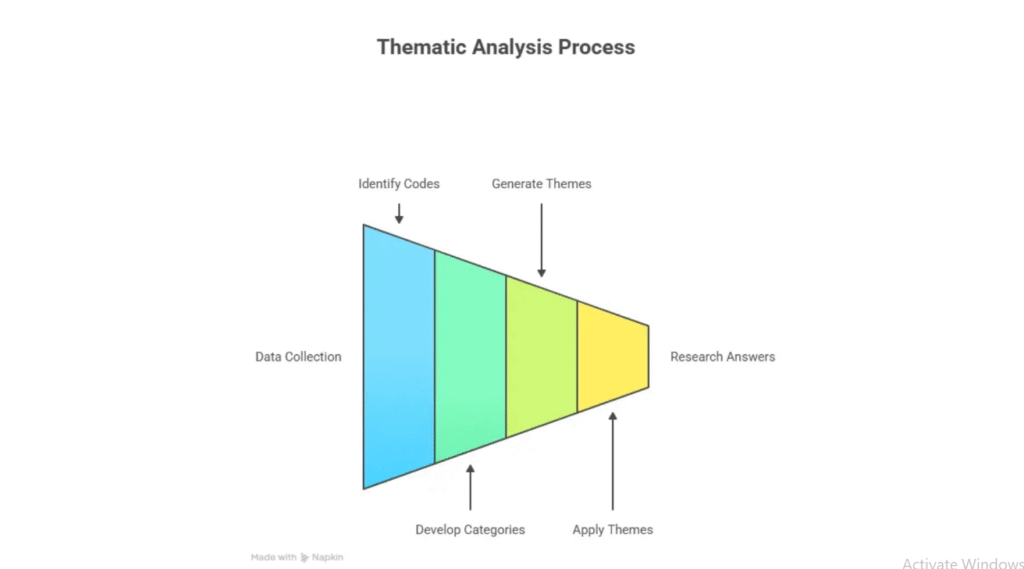
The second is Saldana’s approach — which is what we’ll follow in this tutorial. If you’re new to ATLAS.ti, I’d recommend starting with how to do qualitative analysis of interviews with ATLAS.ti before continuing here.
My name is Bernard Mugo. Over the past three years, I’ve helped more than 300 PhD students analyze qualitative data and complete their theses. This guide is based on that hands-on experience.
What Is Inductive Thematic Analysis? (Saldana’s Approach)
Inductive thematic analysis is an approach to qualitative data analysis where themes emerge directly from the data — rather than being defined in advance. Unlike deductive analysis, you don’t start with a theoretical framework and fit data into it. Instead, you read through your transcripts, let patterns surface, and build your themes from the ground up.
Saldana’s method — documented in The Coding Manual for Qualitative Researchers (SAGE Publishing) — structures this process into four clear steps, making it especially practical for PhD students working with interview transcripts.
Here are the four steps we’ll follow in ATLAS.ti:
- Identifying and categorizing codes
- Developing high-level categories
- Generating themes through analytic memoing
- Connecting themes to research questions
For an overview of ATLAS.ti’s features and capabilities, the ATLAS.ti Research Hub is a valuable official reference throughout this process. Let’s work through each step.
Step 1 — Identifying and Categorizing Codes in ATLAS.ti
What Is a Code in ATLAS.ti?
Before we open ATLAS.ti, let’s define what a code actually is.
A code is a label or interpretive statement assigned to any piece of data that is important to your research questions. Think of it as a sticky note you place on a passage to capture its meaning.
To make this concrete, here’s an excerpt from an interview transcript:
“Mrs. Jackson rises from her desk and announces: ‘Okay, you guys — let’s get lined up for lunch.’ Row one, five children seated in the first row of desks rise and walk to the classroom door. Some of the seated children talk to each other. Mrs. Jackson looks at them and says: ‘No talking — save it for the cafeteria.’ Row two, five children rise and walk to join the line.”
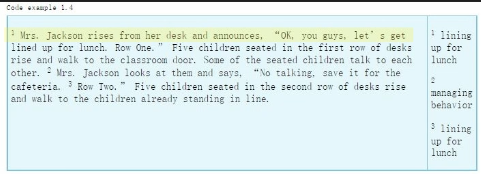
From this paragraph, we can generate three codes:
- Lining up for lunch (sentences 1 and 3)
- Managing behavior (sentence 2)
- Lining up for lunch (sentence 3 — same code applied again)
This is first-cycle coding: reading your data and labeling what you see. ATLAS.ti makes this process efficient because you can build your codebook across all your transcripts simultaneously.
How to Create and Apply Codes in ATLAS.ti
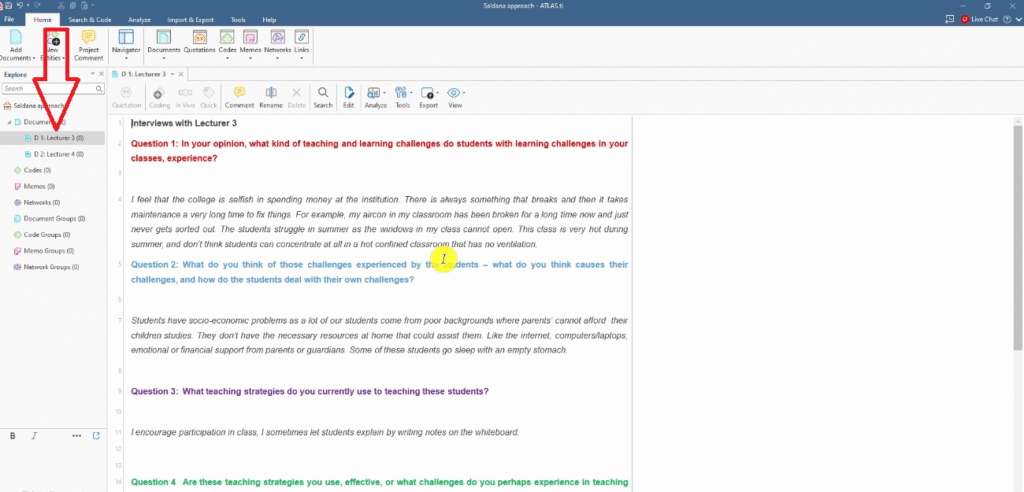
Open ATLAS.ti and create a new project. In the Documents section, drag and drop your interview transcripts. For this tutorial, I’m working with two transcripts.
Coding Your First Interview Transcript
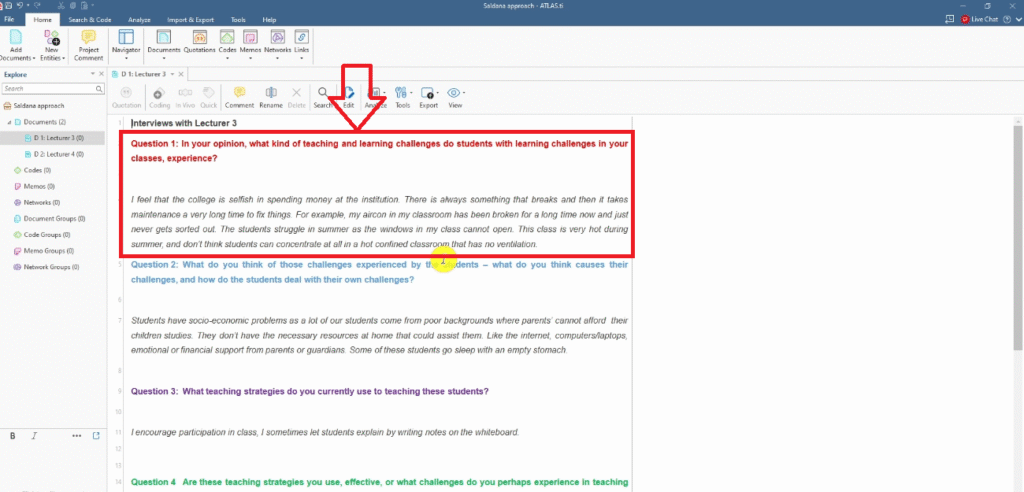
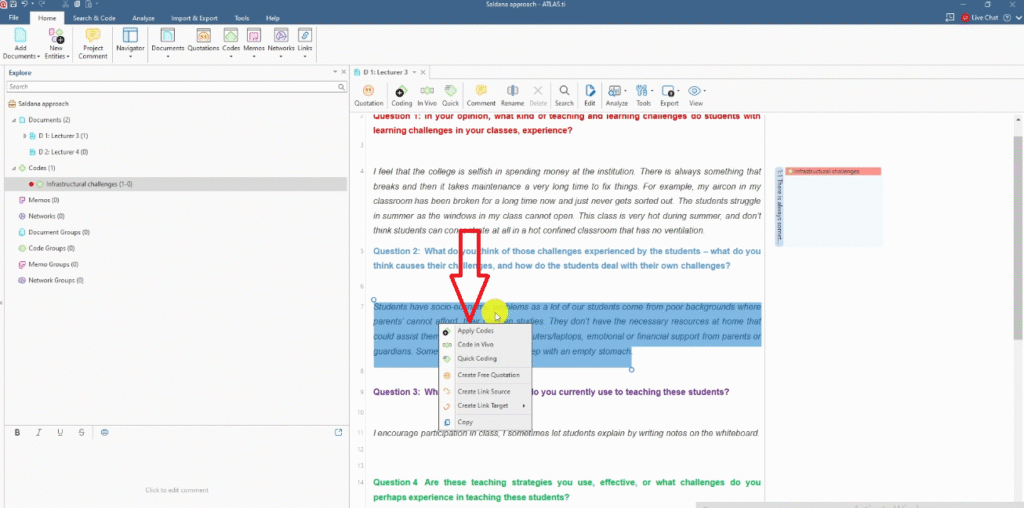
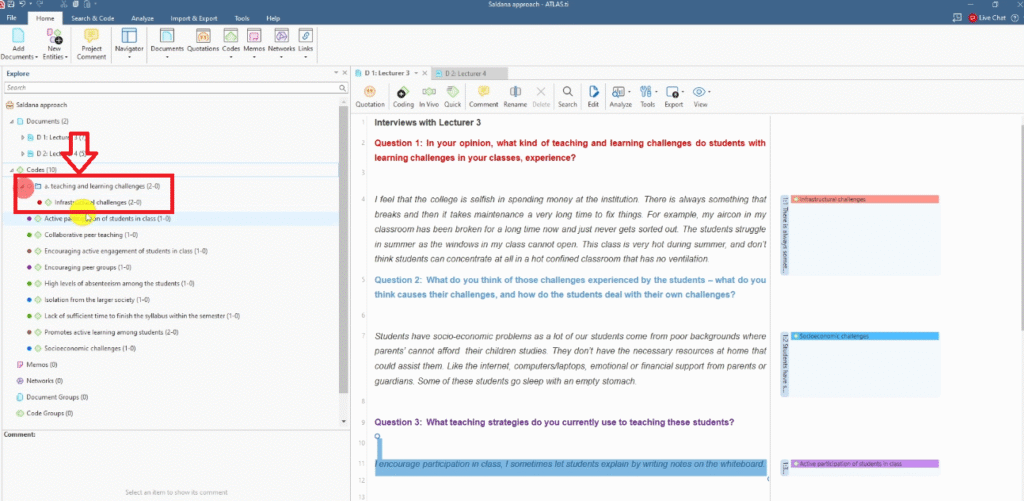
For the first question — “In your opinion, what kind of teaching and learning challenges do students in your class experience?” — a response mentions a broken air conditioning unit and poor ventilation.
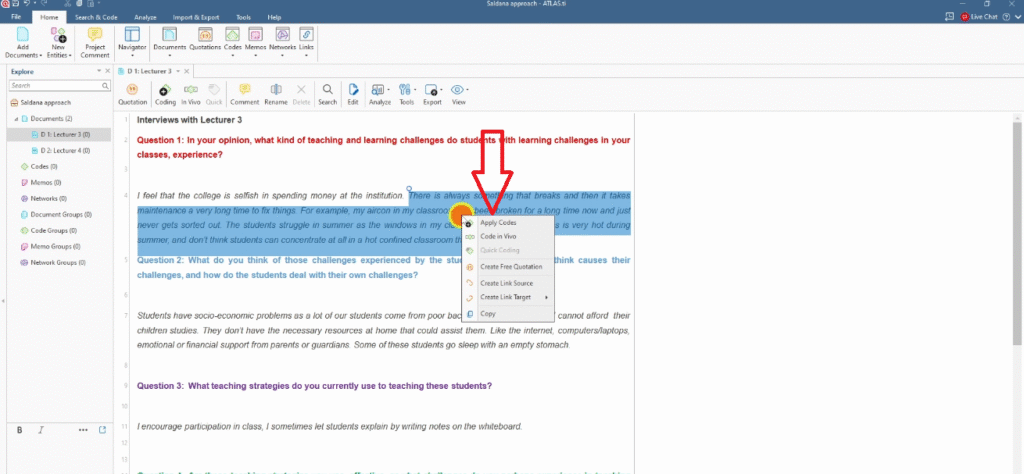
- Highlight that section of text
- Right-click and select Apply Codes
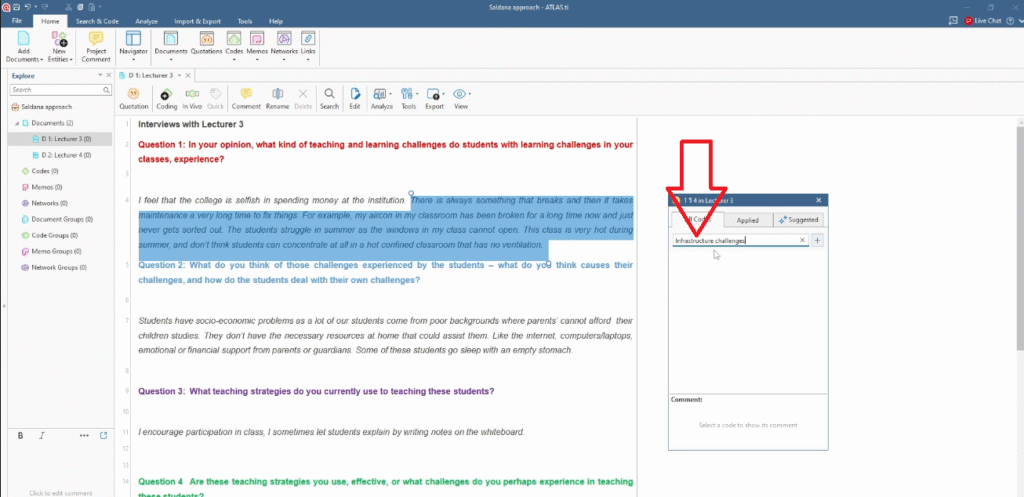
- Create a new code: Infrastructural challenges
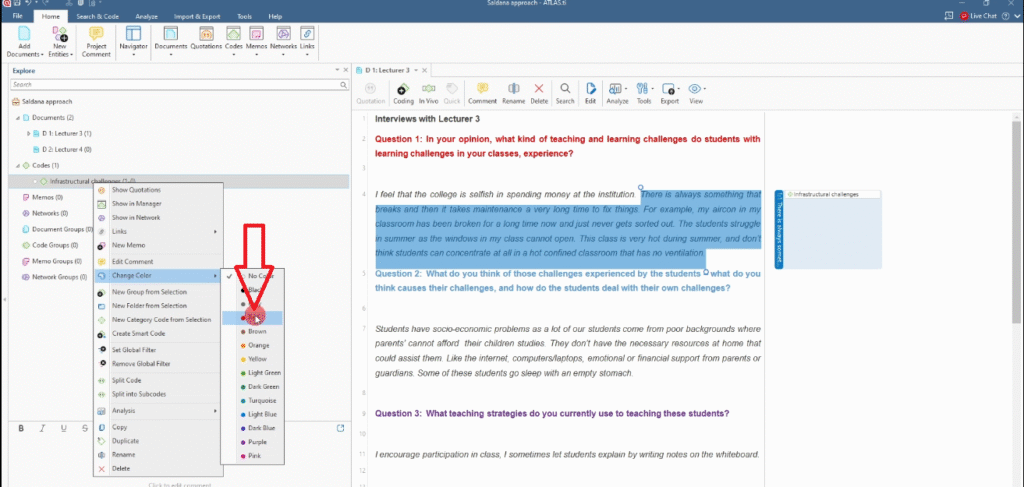
- Assign it a color (I use red for question one) to make categorization easier later
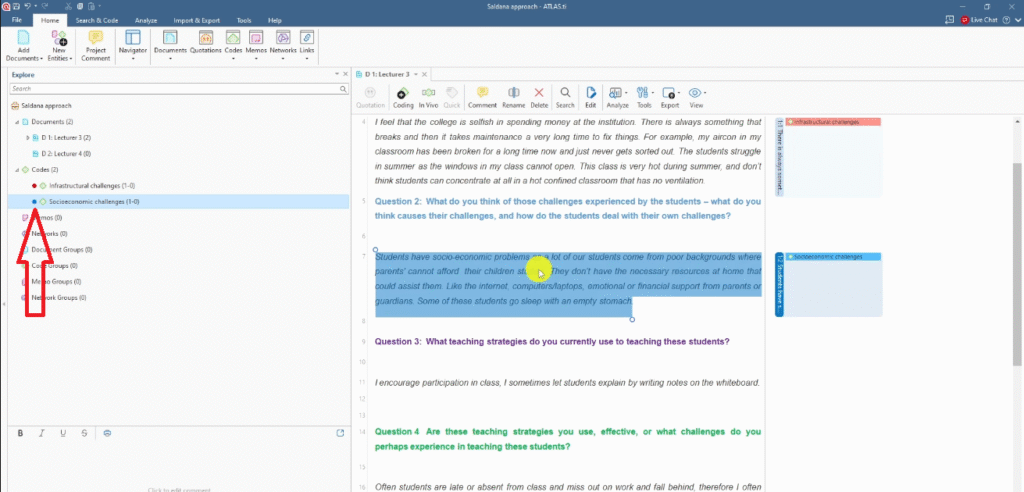
Coding Subsequent Transcripts
When you move to the second transcript, look for responses that match your existing codes. Where a passage reflects a code you’ve already created — like Infrastructural challenges — apply that existing code rather than creating a new one.
Double-clicking the code shows it now has quotes from multiple participants. That’s exactly what you want: multiple data sources supporting the same code strengthens your analytical argument.
This is the power of ATLAS.ti for Saldana’s first step — you build a shared codebook across all your transcripts as you go.
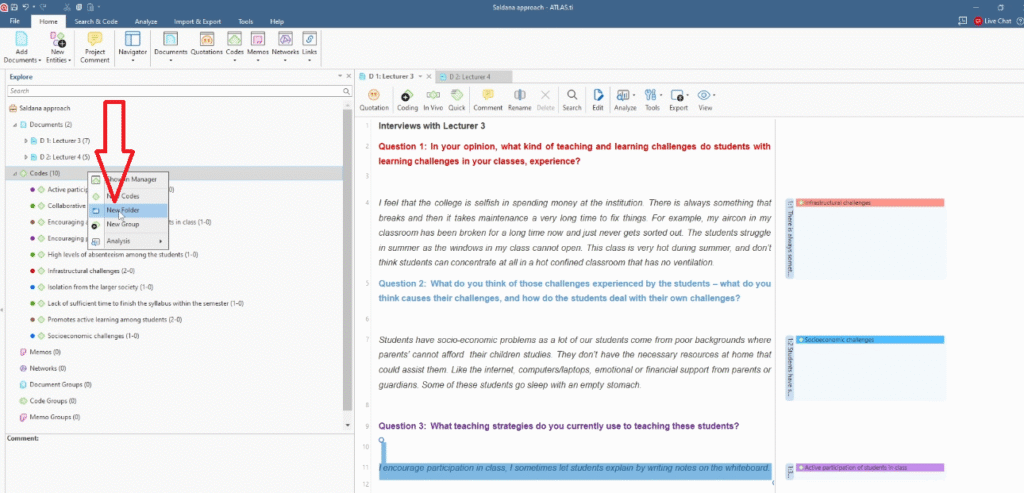
Step 2 — Developing High-Level Categories in ATLAS.ti
With all codes generated, the second step is grouping them into high-level categories based on meaning.
In ATLAS.ti, create a folder for each interview question and drag the corresponding color-coded codes into it:
- Category A — Teaching and learning challenges (red codes)
- Category B — Challenges experienced by students (blue codes)
- Category C — Teaching strategies (purple codes)
- Category D — Effectiveness of teaching strategies (green codes)
- Category E — Effective approaches of teaching students (remaining codes)
At this stage, you’ll notice some codes might seem to fit multiple categories. Don’t worry — we’ll refine this in Step 3 when we move from categories to themes.
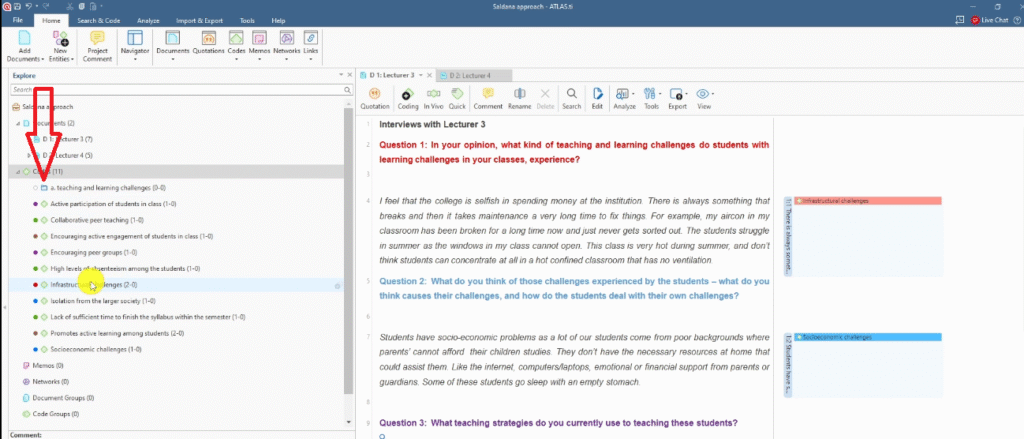
Step 3 — Generating Themes Through Analytic Memoing in ATLAS.ti
Now we move from categories to themes, which is where the real analytical work happens.
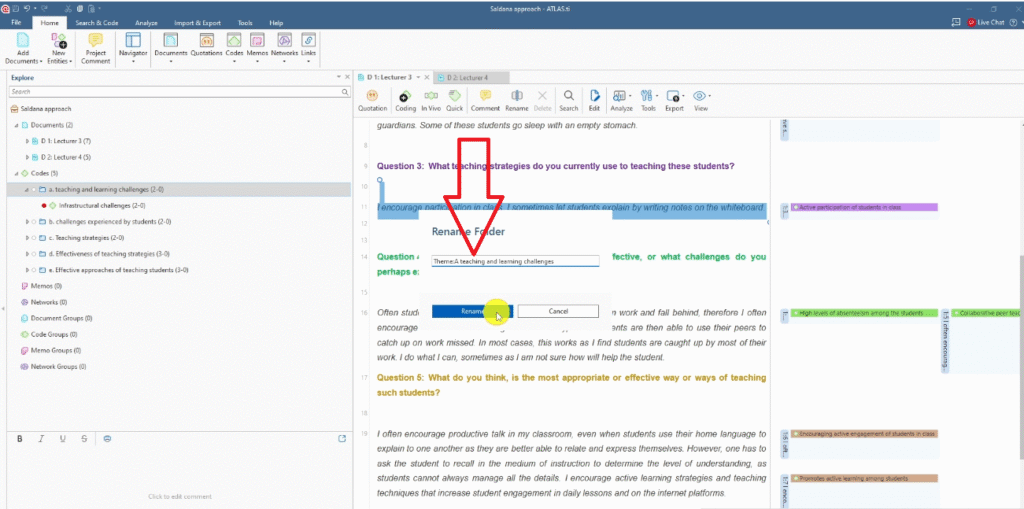
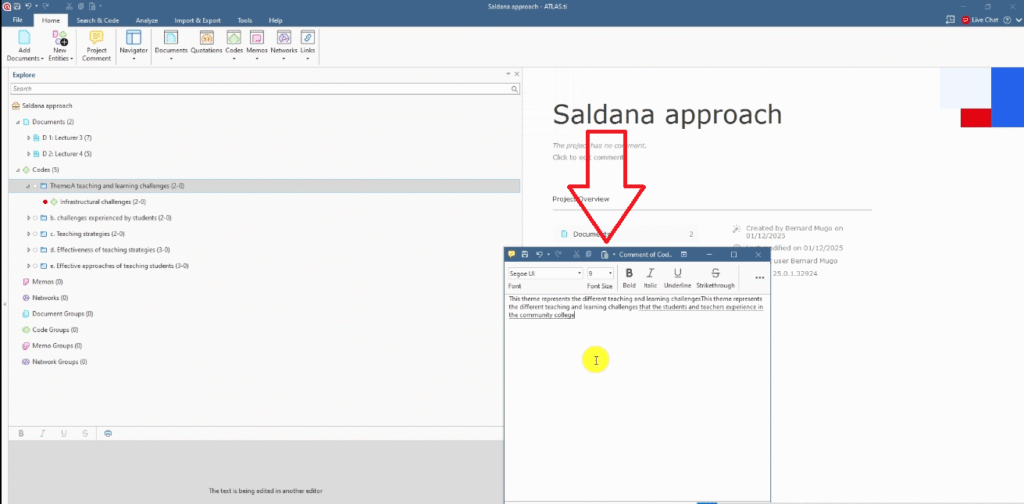
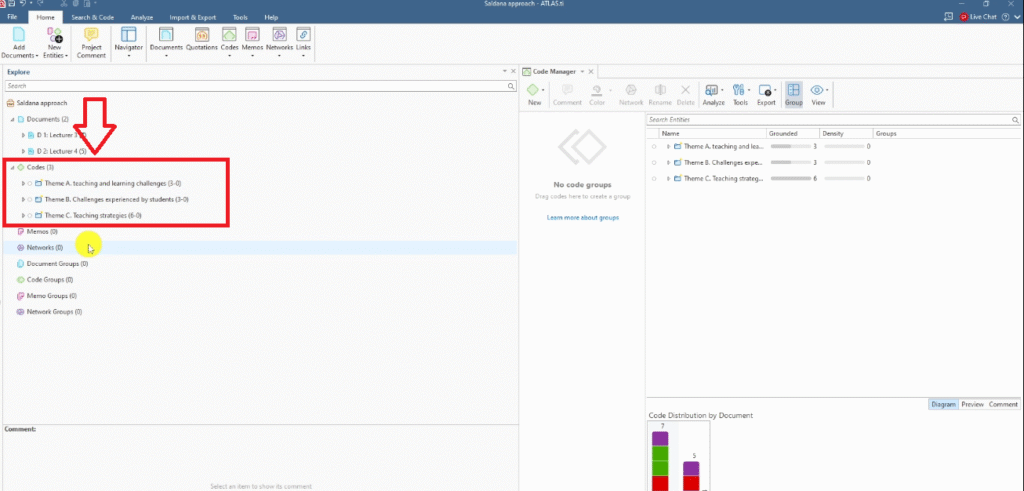
In ATLAS.ti, rename each category folder to reflect its theme and add a written memo that describes what it represents. For example:
- Theme A — Teaching and learning challenges: “This theme represents the different teaching and learning challenges that students and teachers experience in the community college.”
- Theme B — Challenges experienced by students: “This theme highlights all the different challenges experienced by students in the community college.”
- Theme C — Teaching strategies: “This theme represents the different strategies applied by teachers to impart knowledge among students.”
As I write these memos, I notice that some of my five original categories overlap. I review each code and ask: does it really belong here, or does it fit better elsewhere?
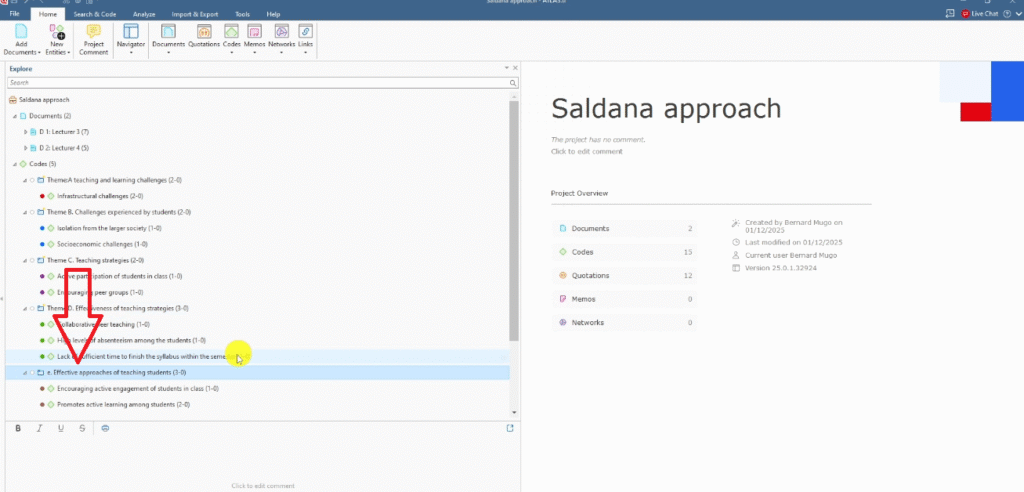
Here’s how I refined the categories:
- High levels of absenteeism → moved to Theme B (it’s a student challenge, not a teaching strategy)
- Collaborative peer teaching → moved to Theme C (it’s a teaching strategy)
- Lack of sufficient time to finish the syllabus → moved to Theme A (it’s a teaching and learning challenge)
- Encouraging active engagement → merged with Promotes active learning among students (they mean the same thing)
After this review, my five categories condensed into three clean, well-defined themes. That’s Saldana’s method working exactly as intended — the analytical process itself sharpens your findings.
If you want to see how this same step works in a different tool, check out my guide on Saldana’s method of inductive thematic analysis using MAXQDA.
Step 4 — Connecting Themes to Your Research Questions
The final step is applying your themes to your original research questions.
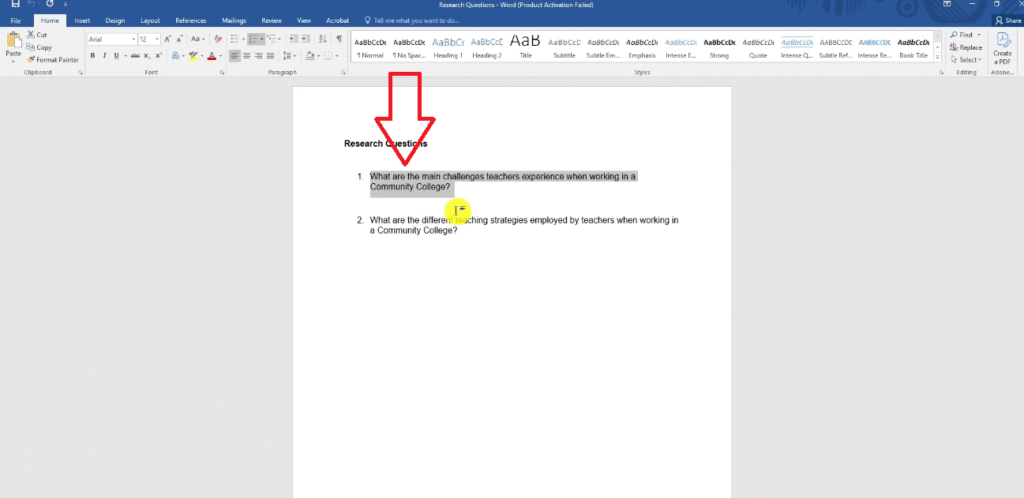
Import both research questions directly into ATLAS.ti as documents:
- RQ1: What are the main challenges teachers experience when working in a community college?
- RQ2: What are the different teaching strategies employed by teachers in a community college?
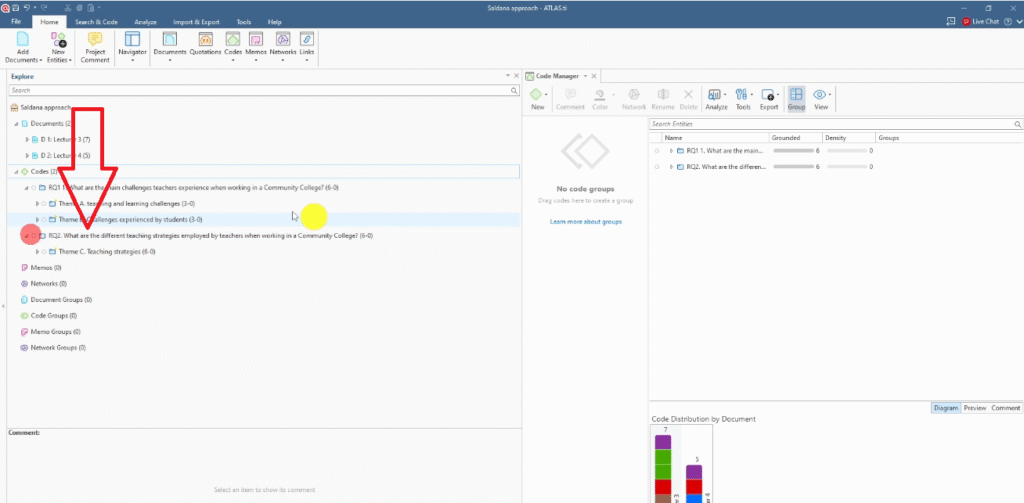
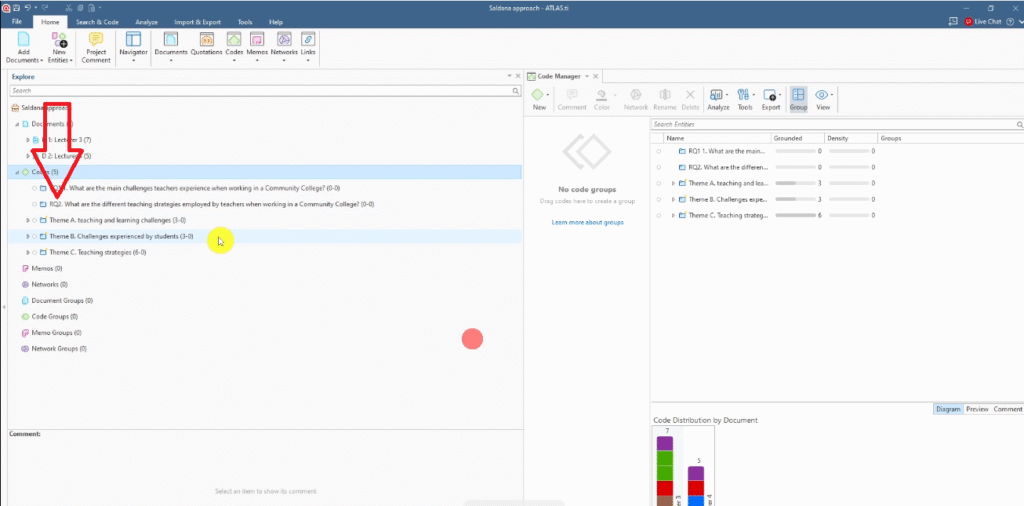
Then drag the relevant themes into each research question:
- RQ1 ← Theme A (Teaching and learning challenges) + Theme B (Challenges experienced by students)
- RQ2 ← Theme C (Teaching strategies)
The final structure shows two themes answering RQ1 and one theme answering RQ2 — a clean, defensible analytical outcome that’s directly grounded in your data.
This step is what makes your analysis defensible in your dissertation. You can trace a clear line from each finding back to a specific research question — which is exactly what examiners and reviewers look for. For a broader overview of how thematic analysis fits into qualitative methodology, Scribbr’s guide to thematic analysis is a helpful reference.
Frequently Asked Questions
What is the difference between inductive and deductive thematic analysis?
Inductive thematic analysis lets themes emerge from the data itself — you code first, then see what patterns appear. Deductive thematic analysis starts with a pre-existing theory or framework and applies it to your data. Saldana’s method is inductive.
Can I use Saldana’s method with data other than interviews?
Yes. While this guide uses interview transcripts, Saldana’s coding approach works with focus group transcripts, field notes, open-ended survey responses, and any other qualitative text data.
How many themes should I end up with?
There’s no fixed number. Saldana’s method typically yields three to seven themes depending on your data and research questions. What matters is that each theme is distinct, well-supported by your codes, and clearly linked to a research question.
Is ATLAS.ti better than NVivo for Saldana’s method?
Both tools support the method well. ATLAS.ti’s folder system makes the category-to-theme step very visual and intuitive. I cover the same process in inductive thematic analysis using NVivo (Saldana method) if you’d like to compare.
What is analytic memoing?
Analytic memoing is the practice of writing brief notes about your codes and categories as you analyze. These memos help you articulate what each theme represents and why certain codes belong together — which is what you’ll write up in your findings chapter.
Key Takeaways
- Saldana’s inductive thematic analysis has four steps: coding, categorizing, generating themes through analytic memoing, and connecting themes to research questions
- In ATLAS.ti, use color-coded folders to organize codes by category before refining them into themes
- Analytic memoing is not optional — writing what each theme represents is what moves you from categories to genuine analytical findings
- Expect your categories to shift during Step 3; that reorganization is a sign the analysis is working
- Link every theme directly to a research question — this is what makes your findings defensible
| Struggling with your ATLAS.ti thematic analysis? If you’re working through your qualitative data in ATLAS.ti and feeling stuck — on the coding, the categories, the themes, or writing it all up — I can take it off your plate completely. I offer a done-for-you qualitative analysis service for PhD students. You share your transcripts and research questions, and I handle the full ATLAS.ti analysis: coding, categorizing, theme development, analytic memos, and a written summary of your findings. I’ve helped more than 300 PhD students get their qualitative analysis done — on time, to examiner standard, and without the stress. Get in touch here to discuss your ATLAS.ti project. |
![Qualitative Analysis of Interviews in ATLAS.ti [Step-by-Step]](https://survivingresearch.com/wp-content/uploads/2025/09/Qualitative-Data-Analysis-Just-Got-Easier-Atlas.ti-Tutorial-2025.jpg)
![Thematic Analysis in ATLAS.ti: Braun and Clarke 6 Steps [Full Guide]](https://survivingresearch.com/wp-content/uploads/2025/10/Thematic-Analysis-with-Atlas-ti.jpg)
Pingback: 9 Best Qualitative Data Analysis Software Tools [Compared] -