Last Updated on 1 month ago by Grace Nyambura
| Quick summary: This article shows you how to conduct thematic analysis in ATLAS.ti following the six-step Braun and Clarke framework — from familiarising with your raw transcripts all the way to generating and reviewing themes. By the end, you’ll know how to code interview data, colour-code by research question, and group codes into preliminary themes inside ATLAS.ti. |
- What Is the Braun and Clarke Approach to Thematic Analysis?
- Step 1 — Familiarising with Your Data
- Step 2 — Generating Initial Codes in ATLAS.ti
- Step 3 — Generating Themes from Your Codes
- Steps 4–6 — Reviewing, Defining, and Reporting Your Themes
- Frequently Asked Questions
- What is the difference between Braun and Clarke thematic analysis and other approaches?
- How many themes should I have after thematic analysis?
- Can I use Braun and Clarke thematic analysis with ATLAS.ti specifically?
- Do I have to use all six steps in the Braun and Clarke framework?
- What's the difference between a code and a theme?
- Key Takeaways
- Need Help With Your ATLAS.ti Thematic Analysis?
In this article, I’m going to walk you through thematic analysis in ATLAS.ti step by step, following the framework proposed by Braun and Clarke.
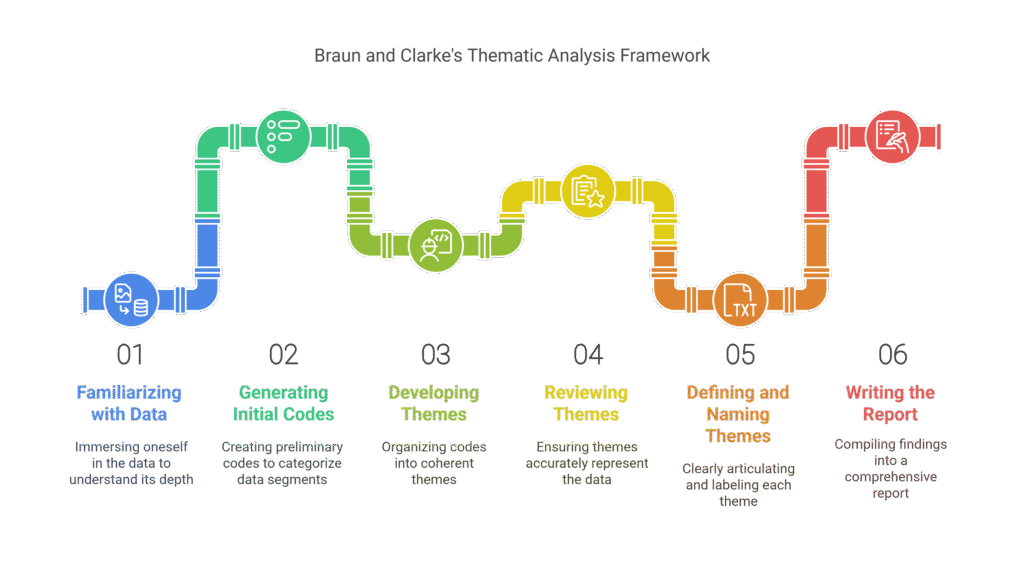
This is a full guide — we’re going to go from raw transcripts like the ones you downloaded from Figshare, all the way to a structured set of themes ready for your findings chapter. The six steps we’ll follow were proposed by Braun and Clarke in their foundational 2006 paper on thematic analysis and developed further in their 2022 book, Thematic Analysis: A Practical Guide.
My name is Bernard Mugo. I’ve spent the past three years helping more than 250 PhD students analyse qualitative data and complete their dissertations. Everything in this guide comes from that hands-on experience.
What Is the Braun and Clarke Approach to Thematic Analysis?
Thematic analysis is a method for identifying, analysing, and reporting patterns of meaning — called themes — across a qualitative dataset. Braun and Clarke’s approach is one of the most widely used frameworks in academic research because it is flexible, systematic, and works across a broad range of research questions. For a detailed academic overview, Scribbr’s guide to thematic analysis is an excellent companion resource.
The six steps are:
- Producing the report
- Familiarising with the data
- Generating initial codes
- Generating themes
- Reviewing themes
- Defining and naming themes
Using ATLAS.ti to work through these steps gives you a significant advantage: it tracks your codes across multiple transcripts automatically, lets you merge quotes from different participants under the same code, and keeps your entire analysis in one organised project.
For this tutorial, the example study is: student views on teaching strategies used in a college. We’ll code three transcripts and develop two preliminary themes.
I’m using ATLAS.ti 25, the latest version. The interface may look slightly different in older versions, but the coding process is the same across all releases. You can find the full documentation on ATLAS.ti’s official research hub.
Step 1 — Familiarising with Your Data

The first step is the most underrated. Before you open ATLAS.ti and start clicking, read your transcripts from start to finish — like reading a story. You’re not coding yet. You’re developing an intuitive feel for what your participants are saying, what themes might emerge, and which sections are likely to be important.
This reading stage directly shapes the quality of your codes. Researchers who skip it tend to generate superficial codes that miss the nuance in the data.
How to Import Transcripts into ATLAS.ti
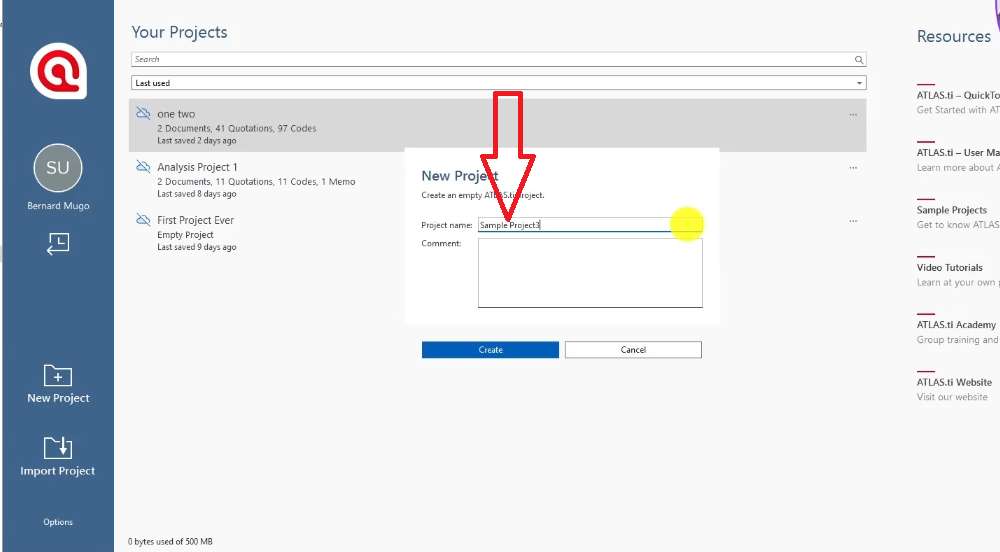
Once you’ve read your transcripts, open ATLAS.ti and create a new project:
- Click Start ATLAS.ti on the welcome screen.
- Select New Project and give it a name (use your actual study title, not a placeholder).
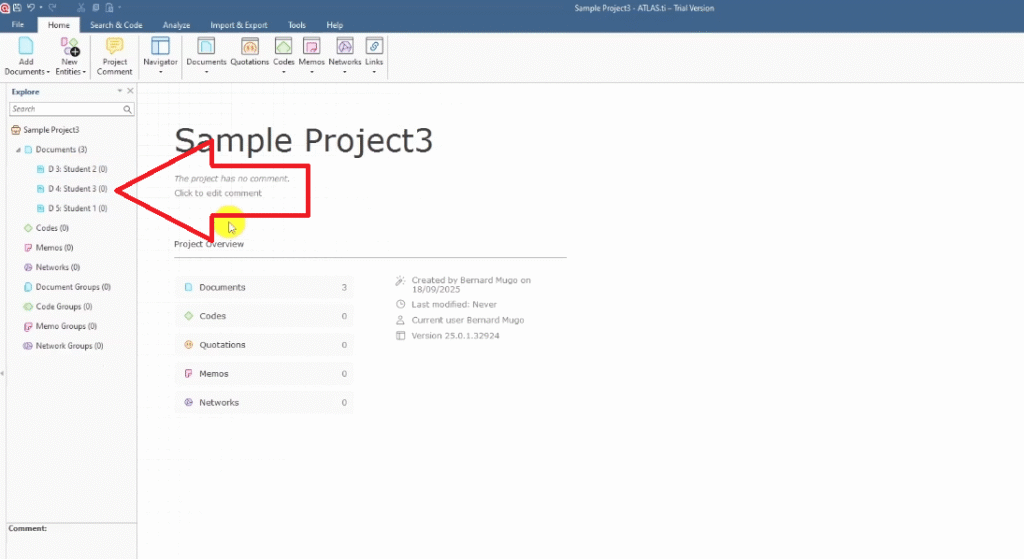
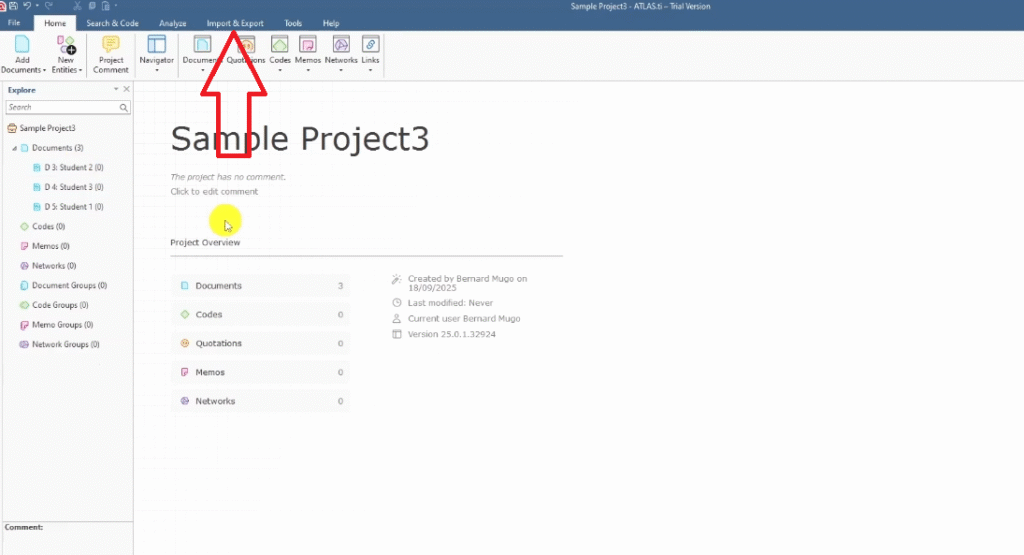
- In the Documents section, drag and drop your transcript files — or use Import & Export > Documents from the top menu.
- ATLAS.ti accepts Word documents, PDFs, and plain text files.
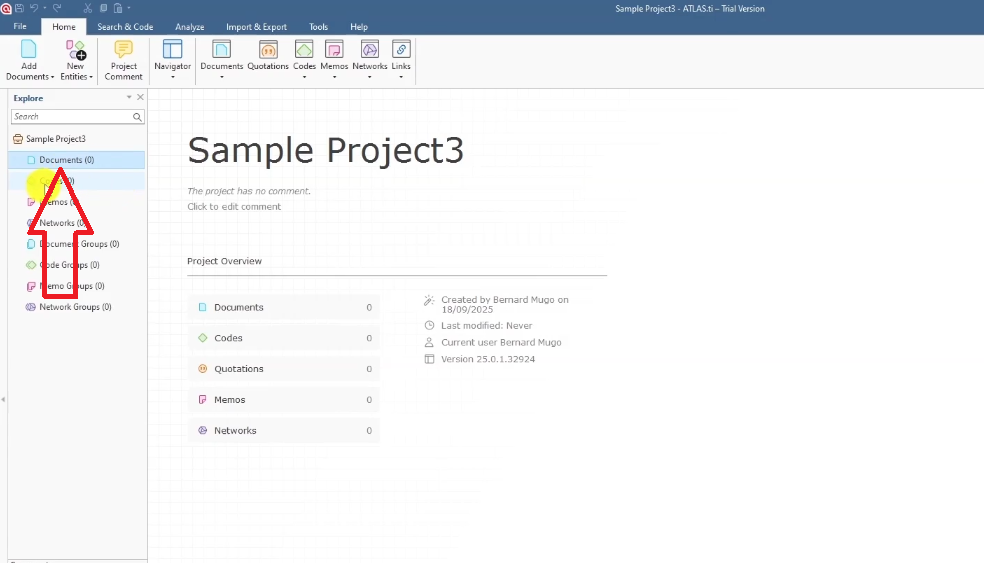
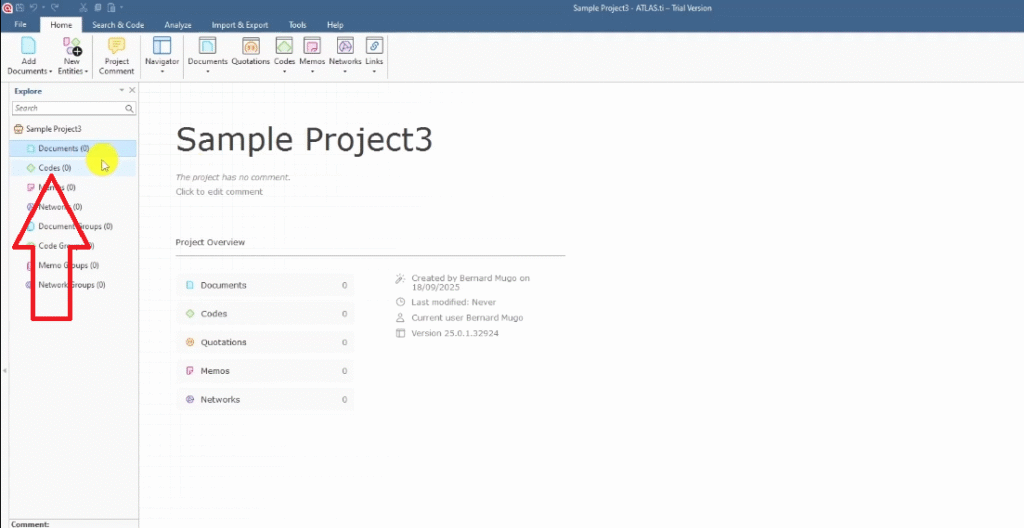
Understanding the ATLAS.ti Workspace
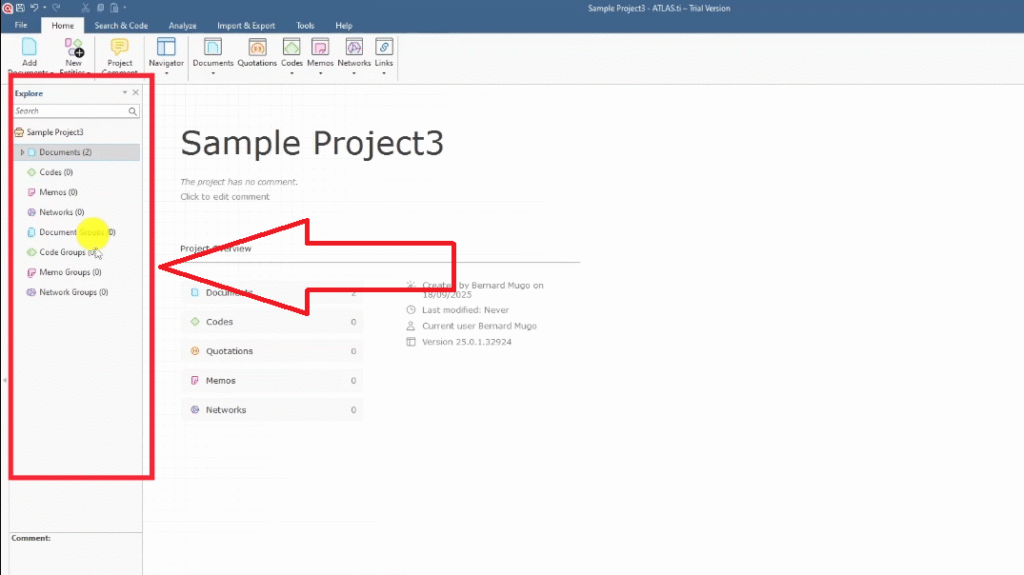
For Braun and Clarke thematic analysis, you only need two panels: Documents and Codes. The rest of ATLAS.ti’s features are for other analysis types — don’t let the interface overwhelm you.
- Documents panel — where your imported transcripts live
- Codes panel — where every code you generate will be stored
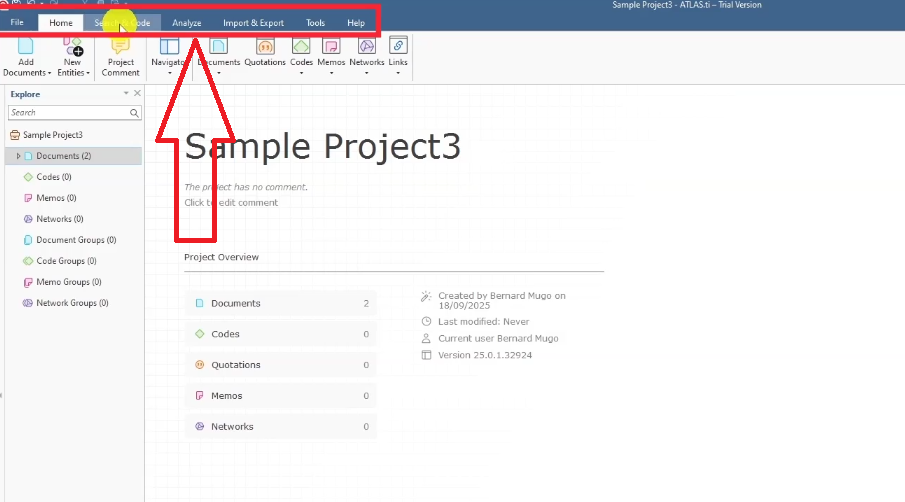
- Top menu: File, Home, Search & Code, Analyzing, Import & Export — you’ll mostly use Home and the right-click menu during coding
Step 2 — Generating Initial Codes in ATLAS.ti
Step 2 is where the analytical work begins. You’re reading through each transcript and attaching short interpretive labels — codes — to segments that are relevant to your research questions.
What Is a Code? (With Examples)
A code is a label or interpretive statement applied to any segment of data that matters to your research question. It captures the meaning of what a participant is saying, not just what they said.
Here’s a quick example. Read this interview extract:
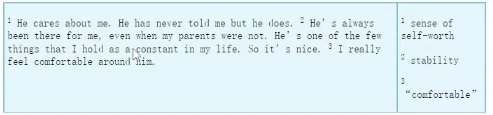
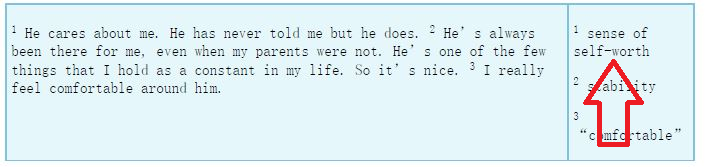
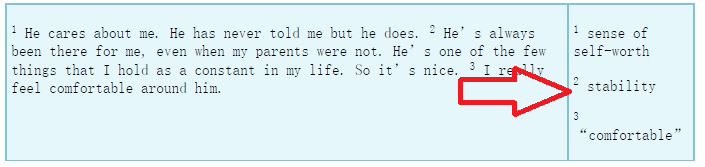
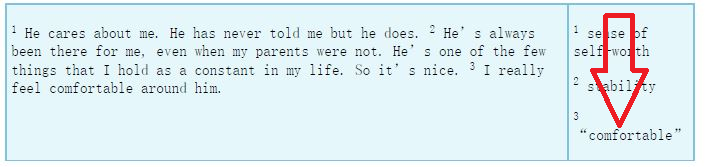
“He cares about me — he has never told me, but he does. He’s always been there for me, even when my parents were not. He’s one of the few things that I hold as a constant in my life, so it’s nice. I really feel comfortable around him.”
From this single paragraph, three codes emerge:
- Sense of self-worth — from “he cares about me, he has never told me, but he does”
- Stability — from “he’s one of the few things that I hold as a constant in my life”
- Comfortable — from “I really feel comfortable around him”
Using Color Coding to Organise by Research Question
Before you start coding, assign a color to each interview question in your transcript. This is optional but highly recommended — it makes the theme-generation step much easier.
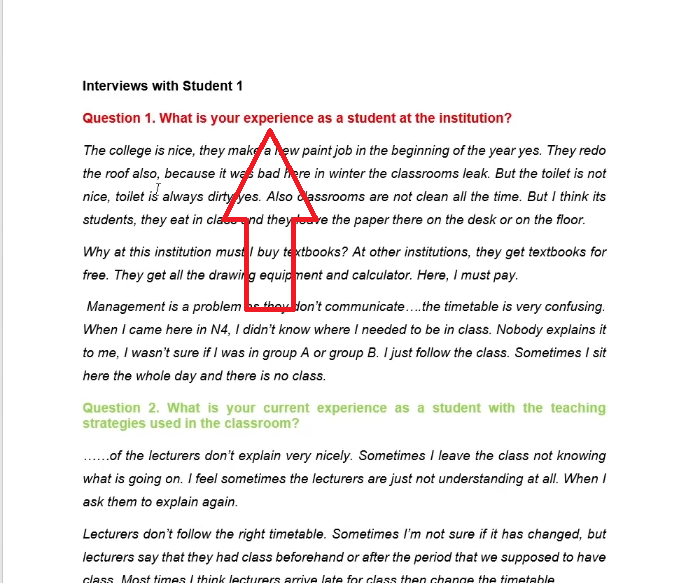
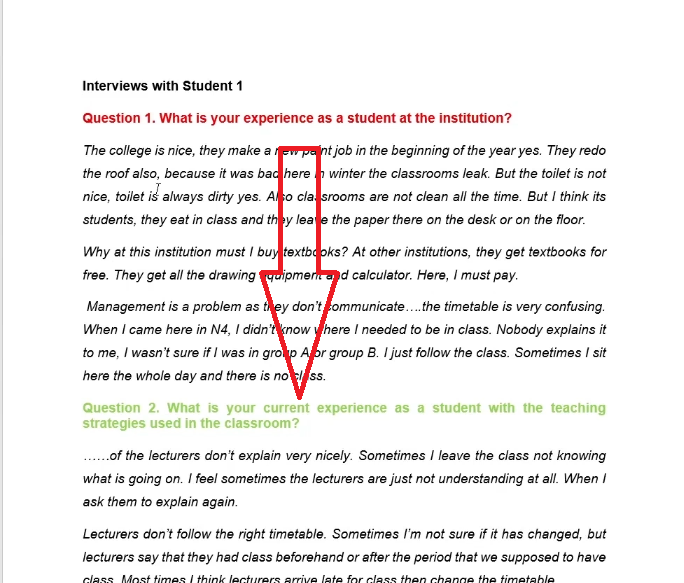
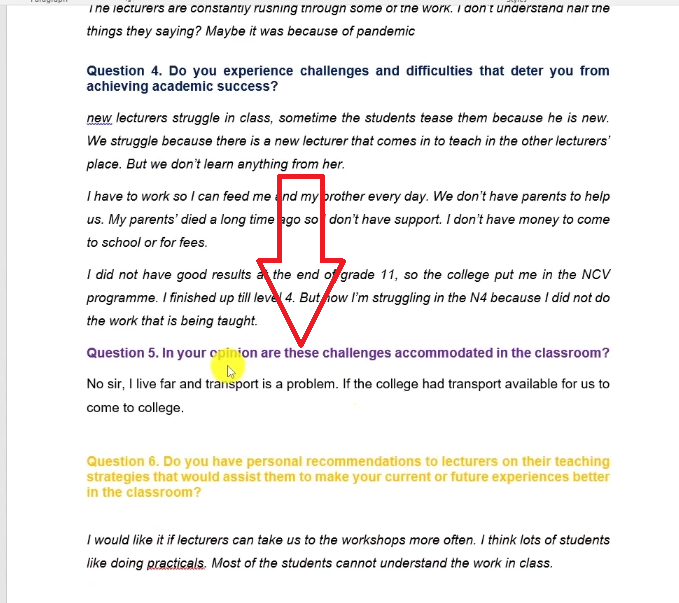
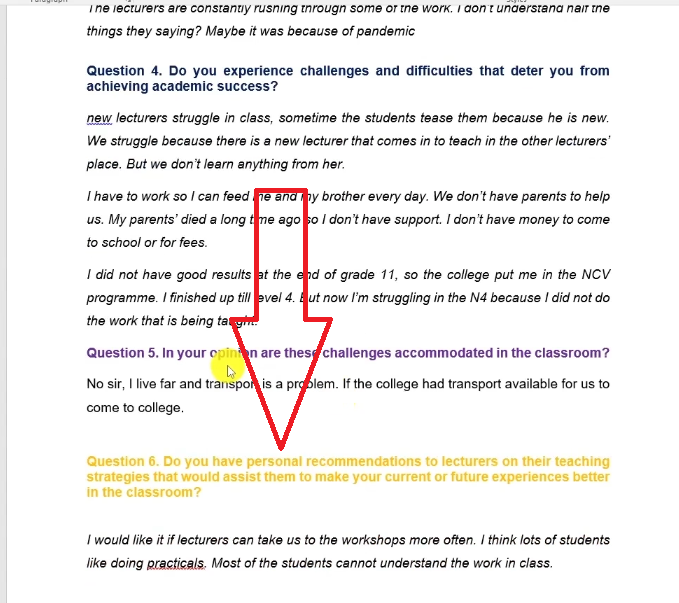
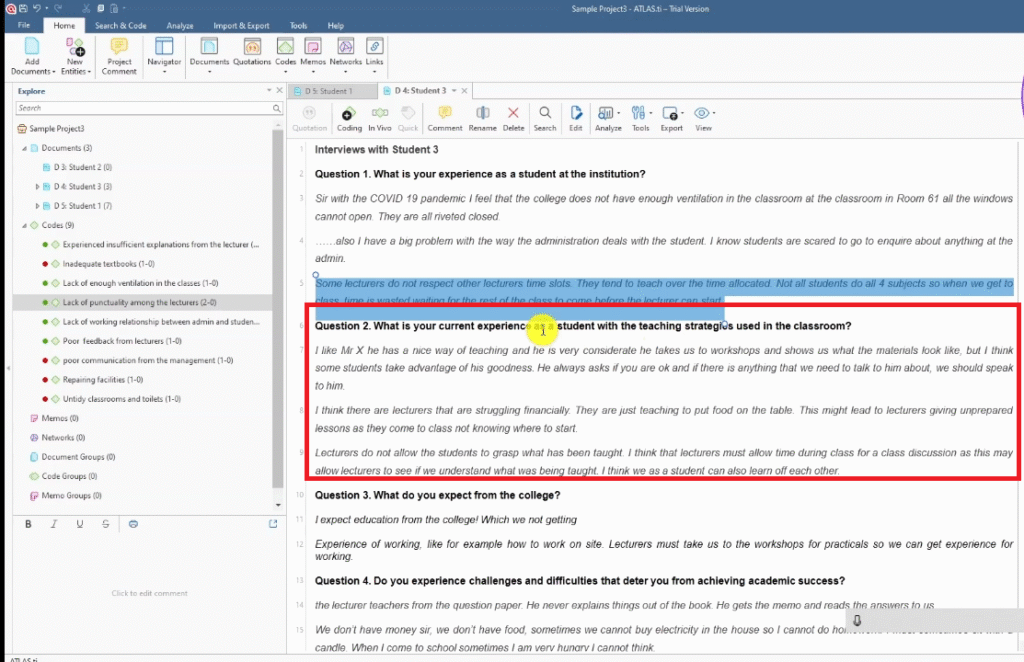
- In your Word transcript, highlight question 1 and apply a red highlight.
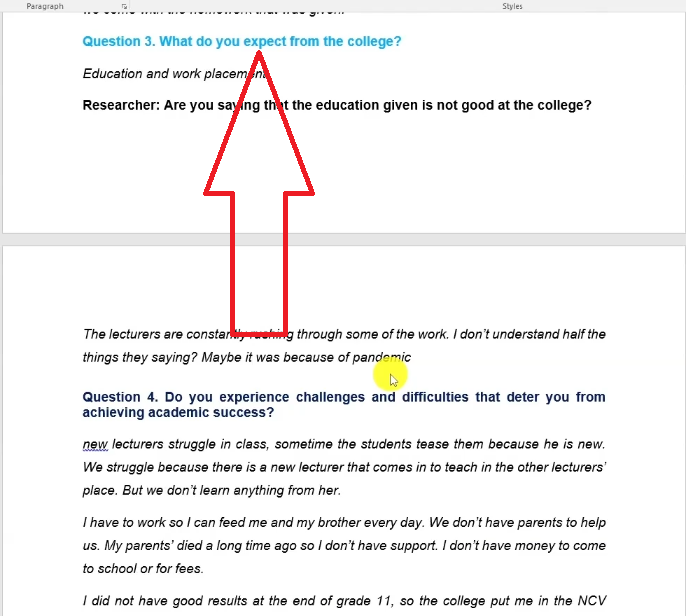
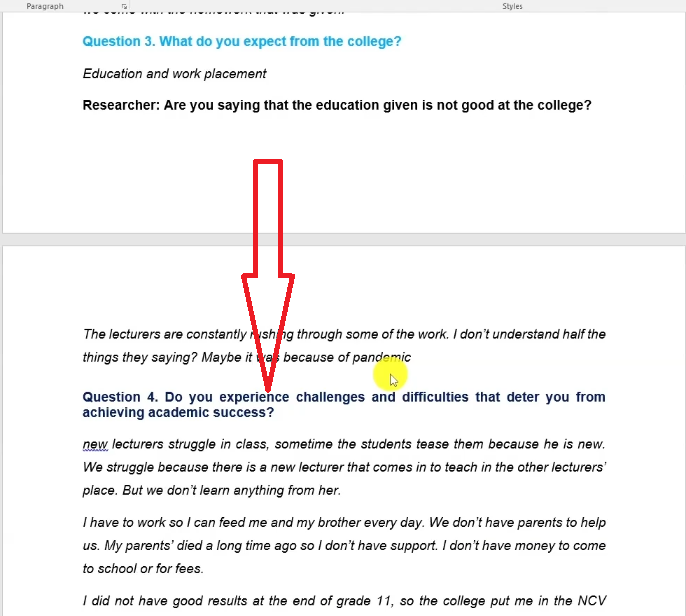
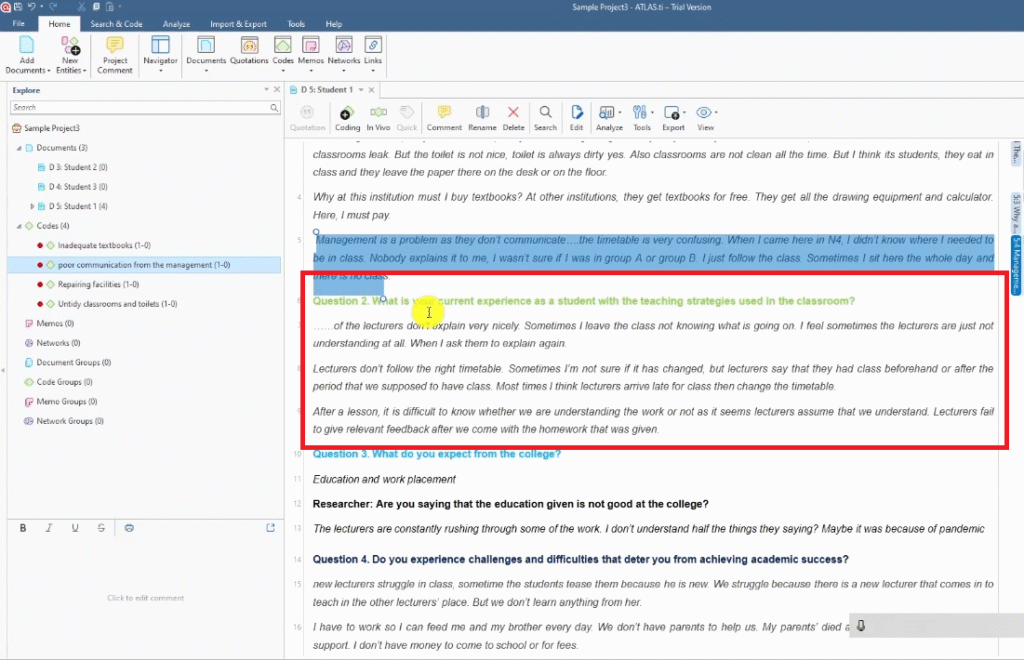
- Highlight question 2 in light green, question 3 in light blue, question 4 in dark blue, question 5 in purple, question 6 in gold.
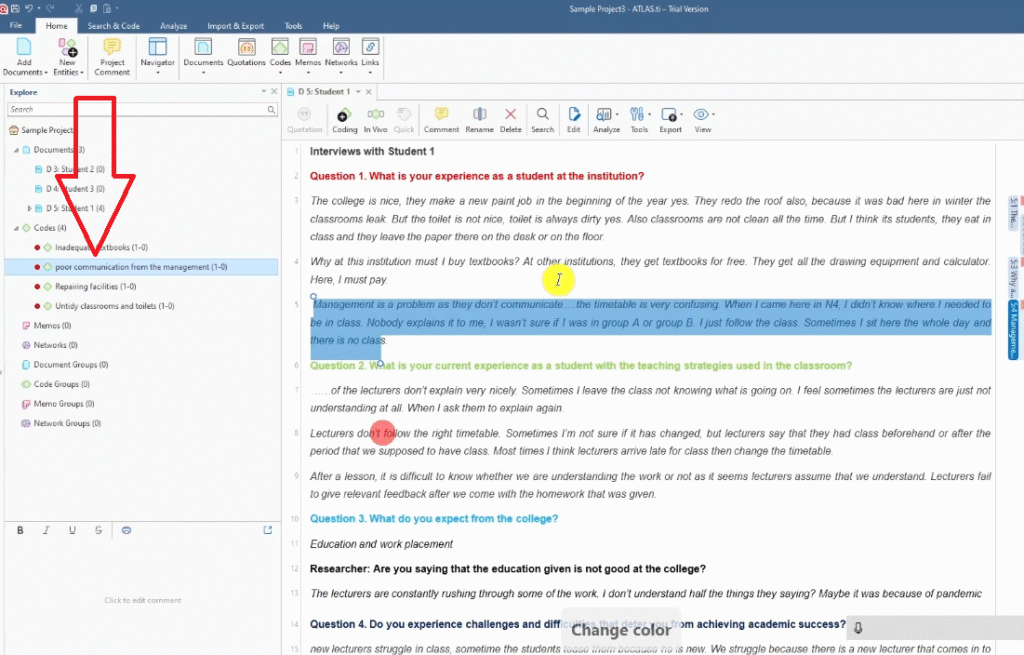
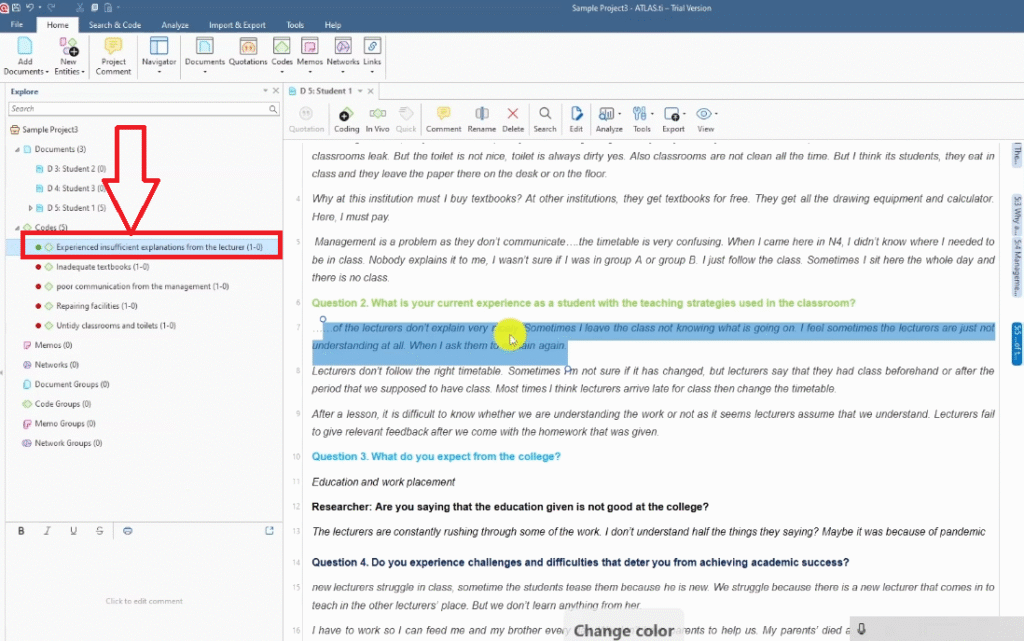
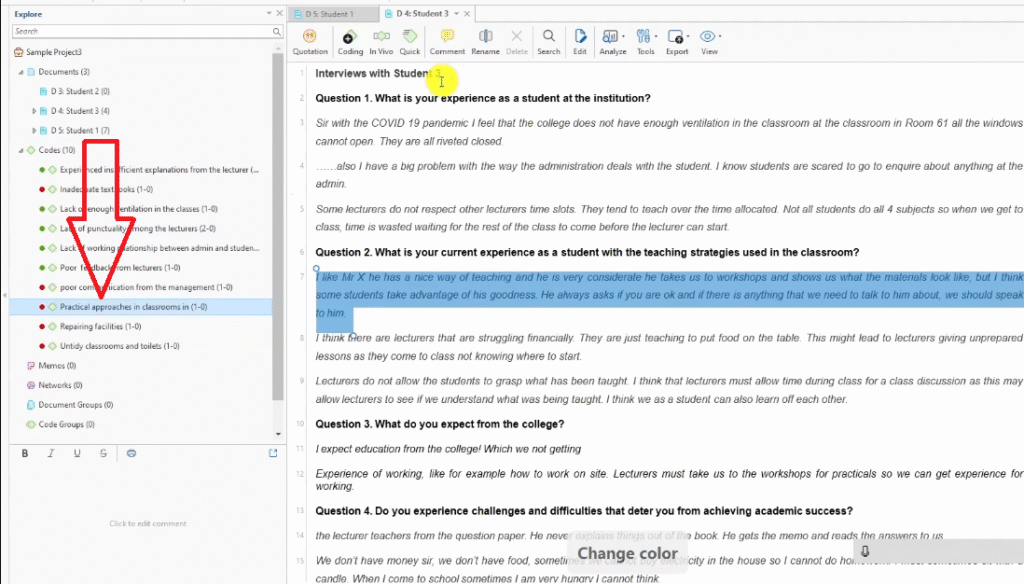
- When you create a code from a response to question 1, right-click the code in the Codes panel, go to Change Color, and mark it red.
- Continue for all questions — every code gets the color of the question it came from.
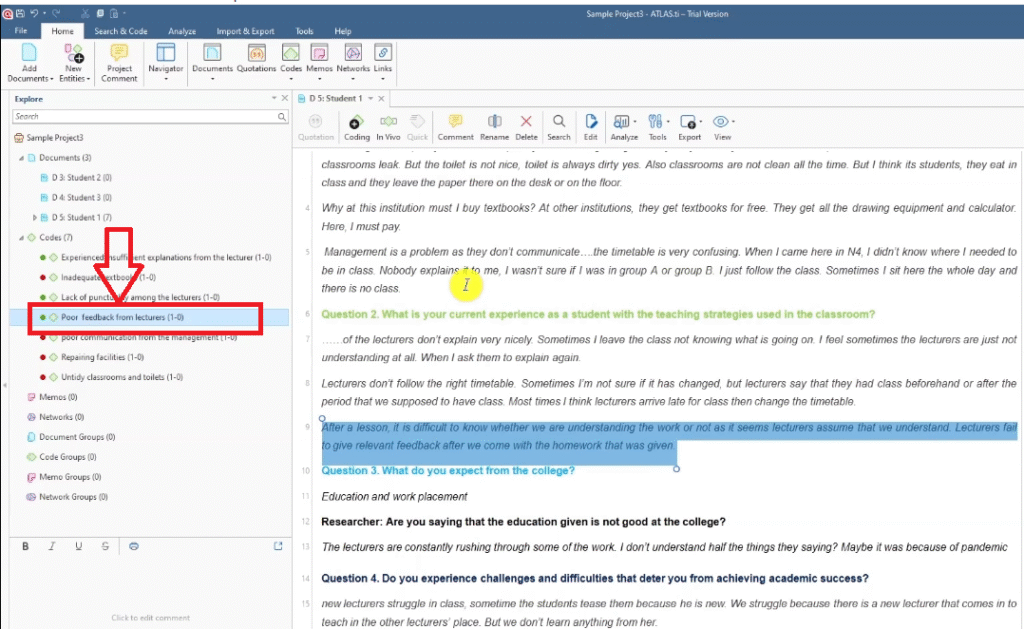
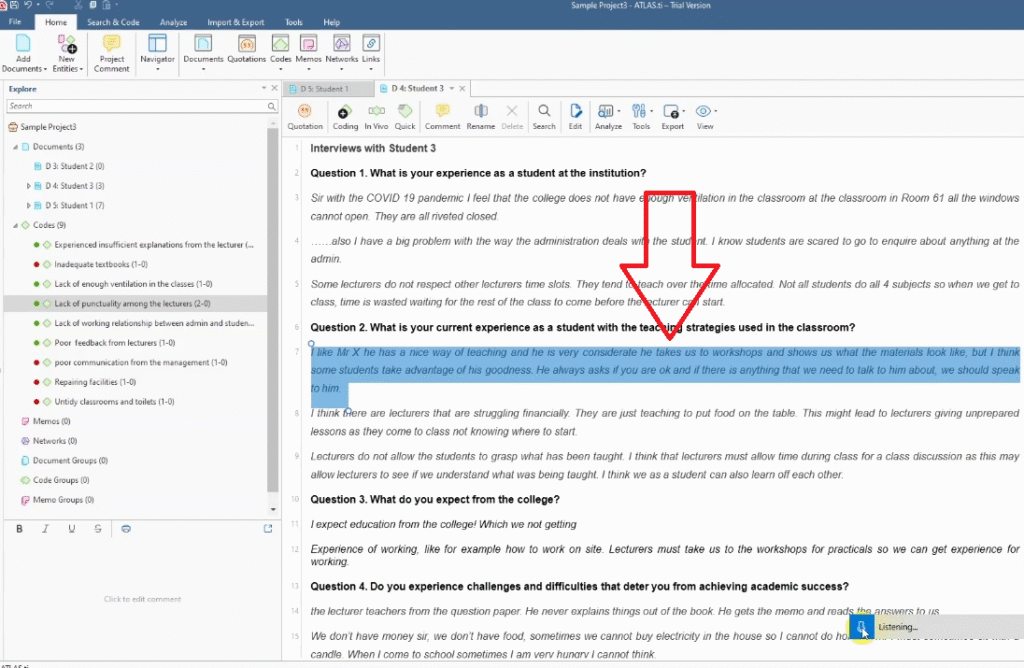
How to Apply Codes in ATLAS.ti Step by Step
Using the college student interview transcripts:
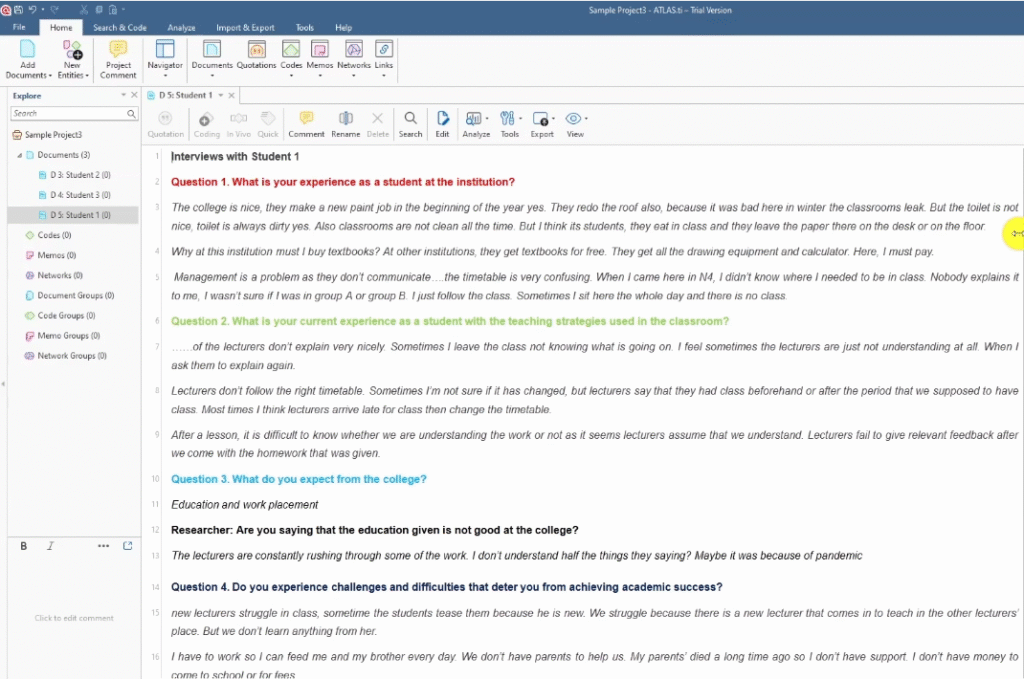
- Double-click a transcript in the Documents panel to open it.
- Read the full paragraph before coding anything.
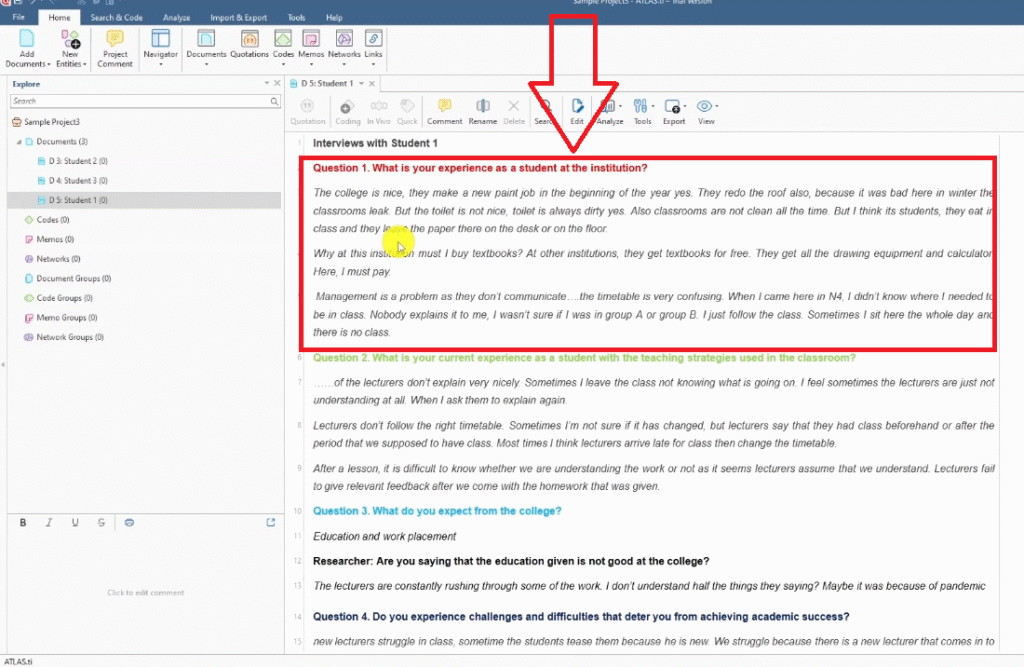
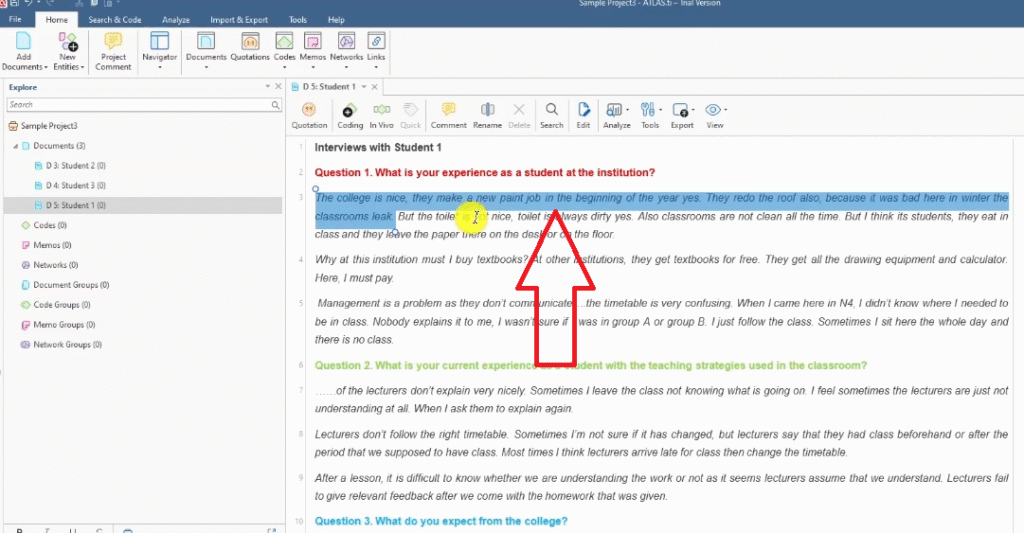
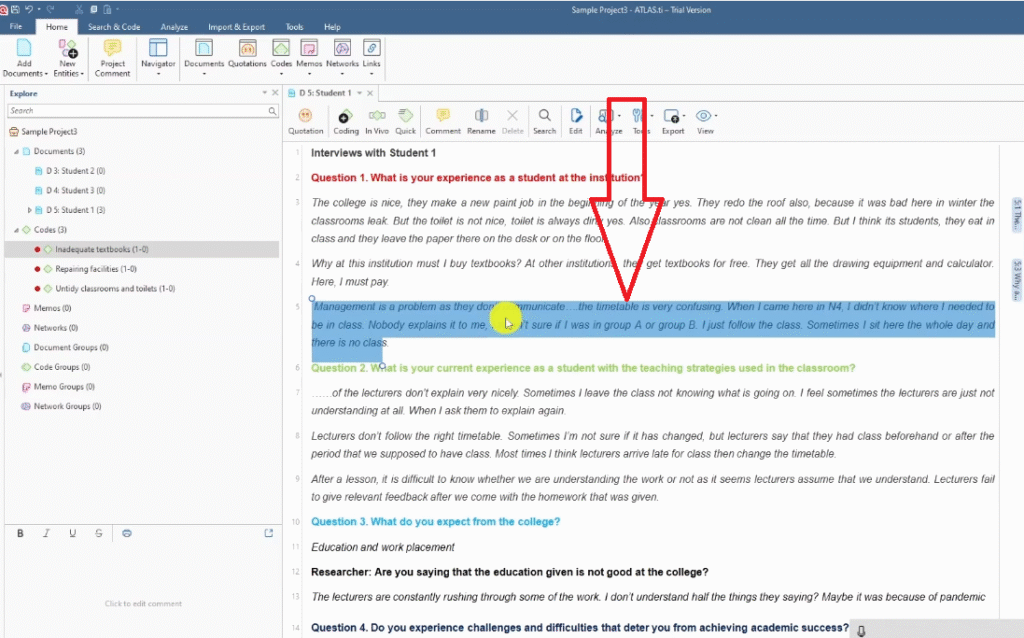
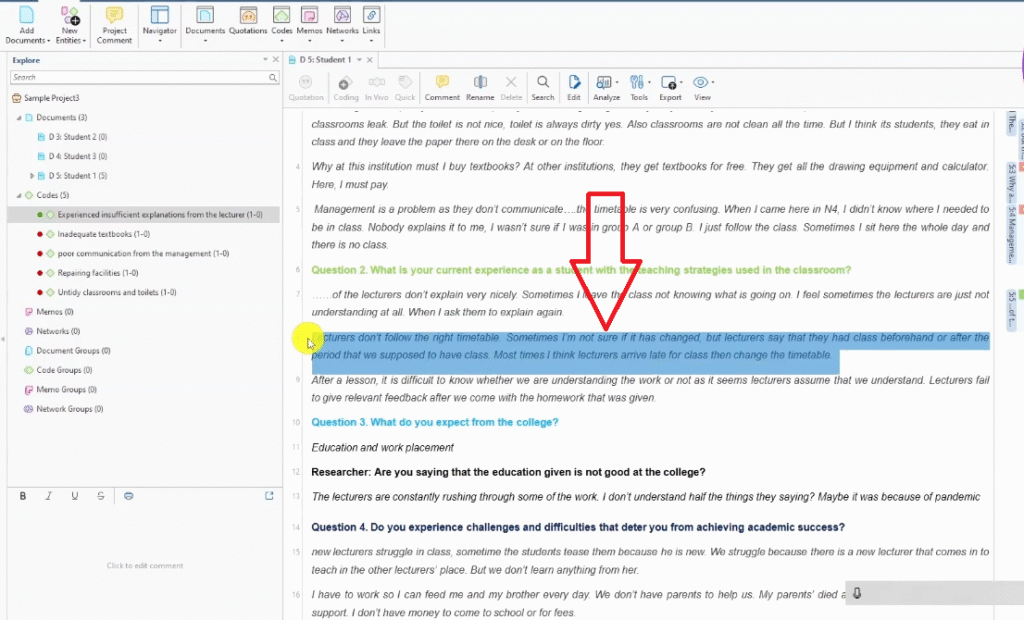
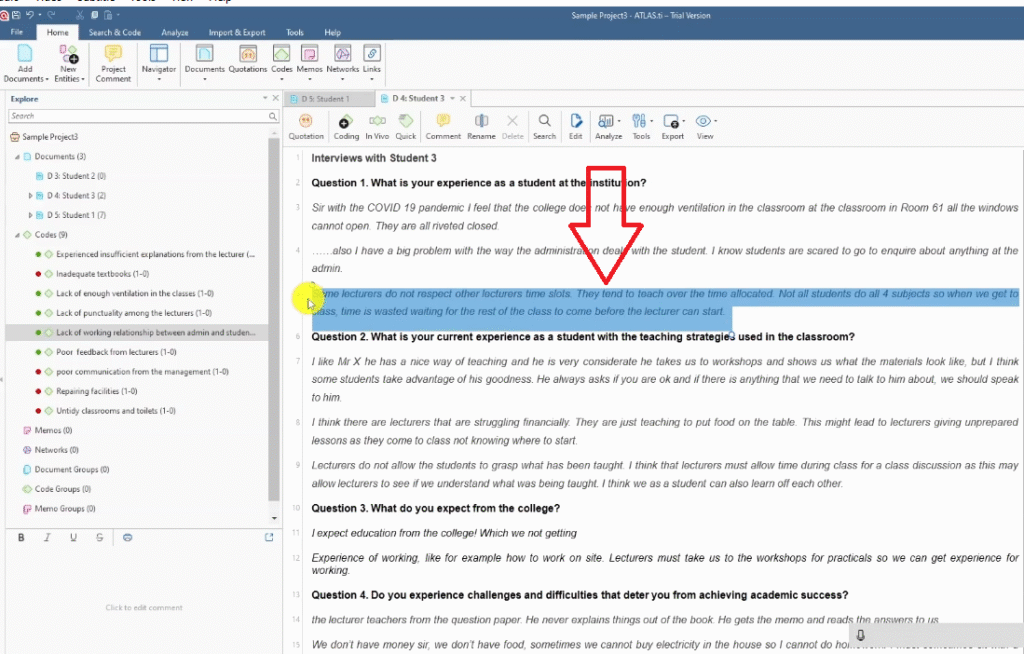
- Highlight the segment you want to code.
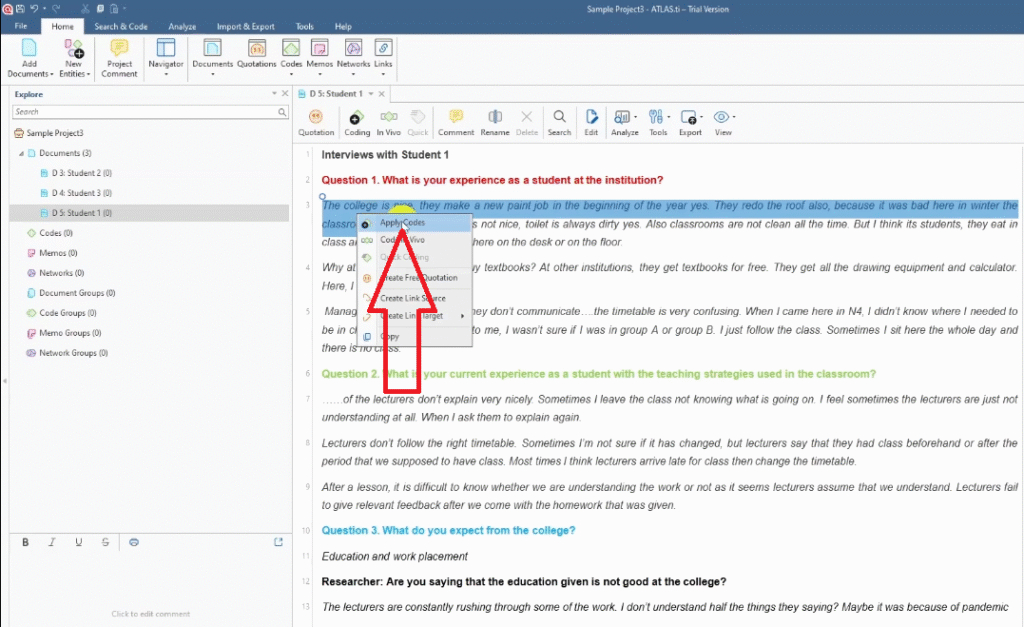
- Right-click the highlighted text and select Apply Codes.
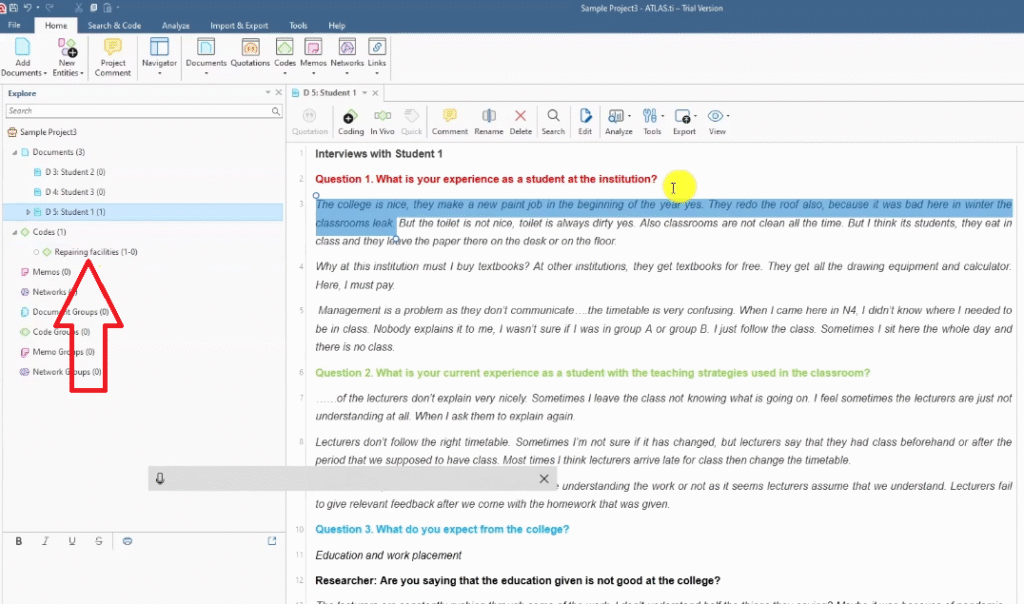
- Type your code label and press Enter. ATLAS.ti creates the code instantly.
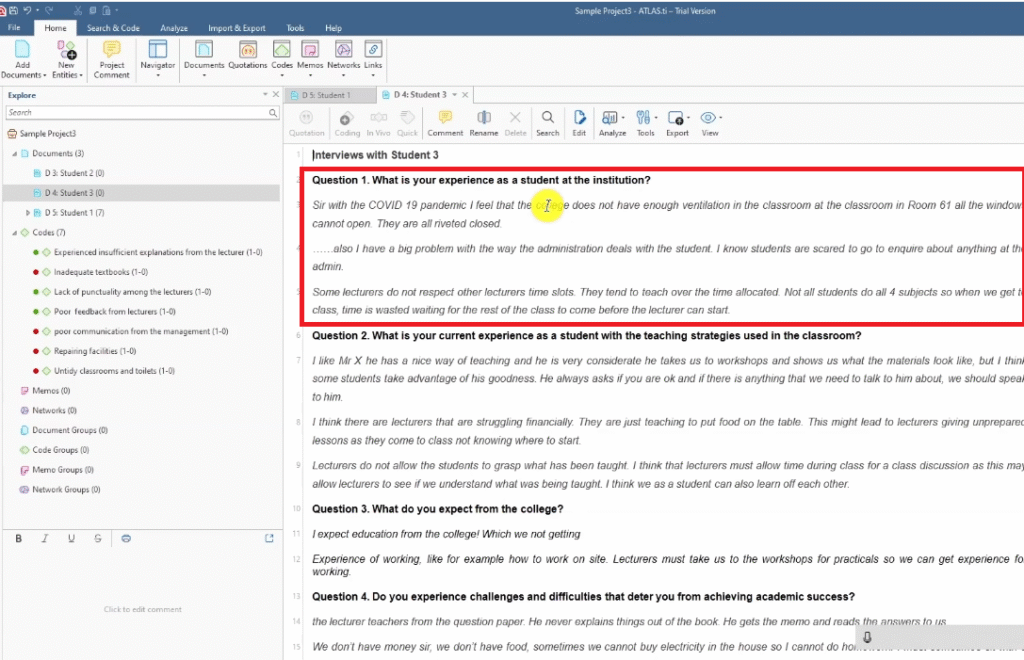
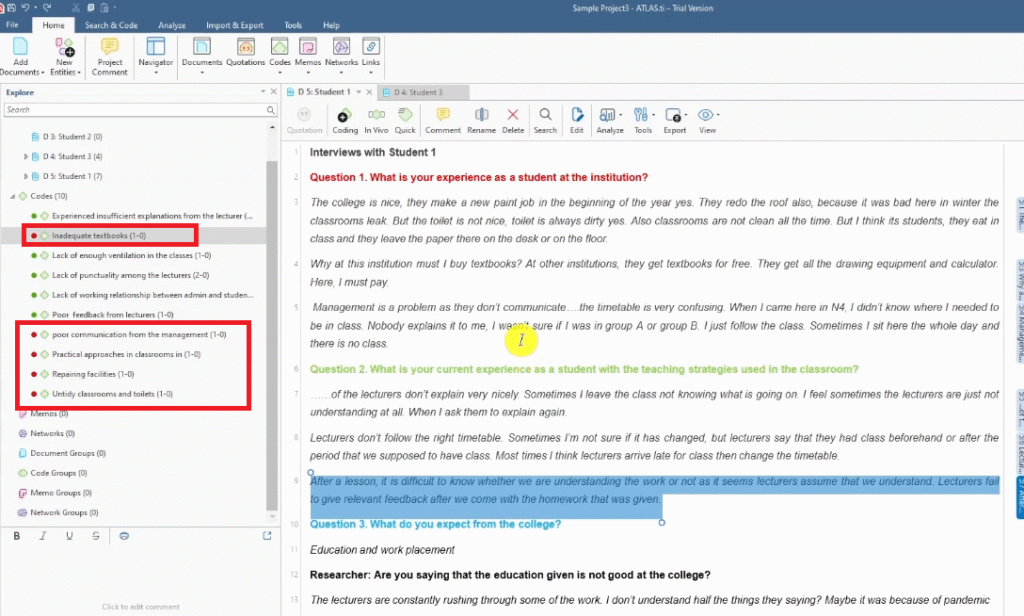
Example from Transcript 1 — question: “What is your experience as a student at the institution?”
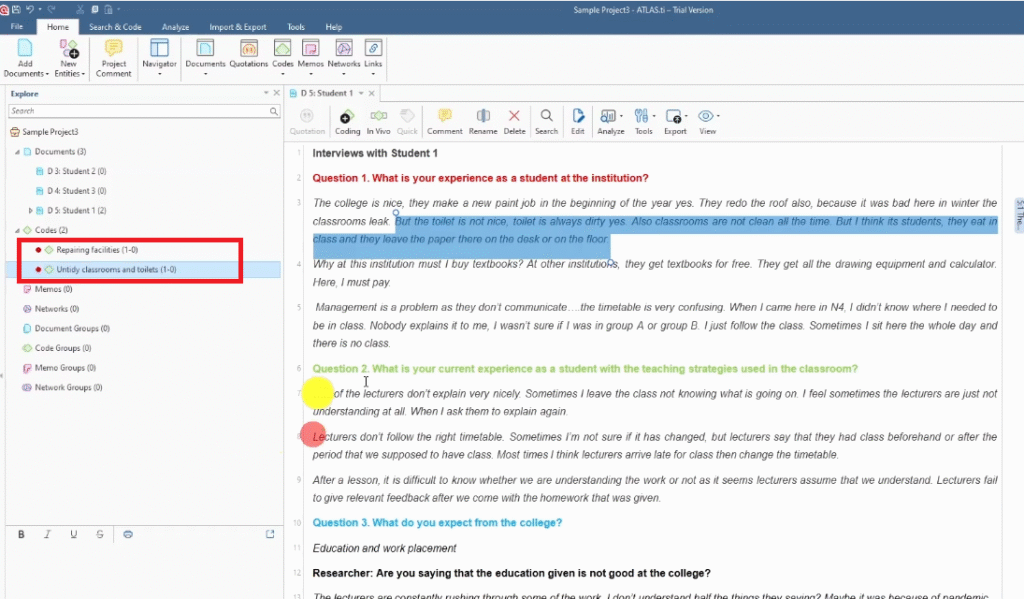
- Segment: college does repairs and repaints each year but classrooms leak → Code: repairing facilities
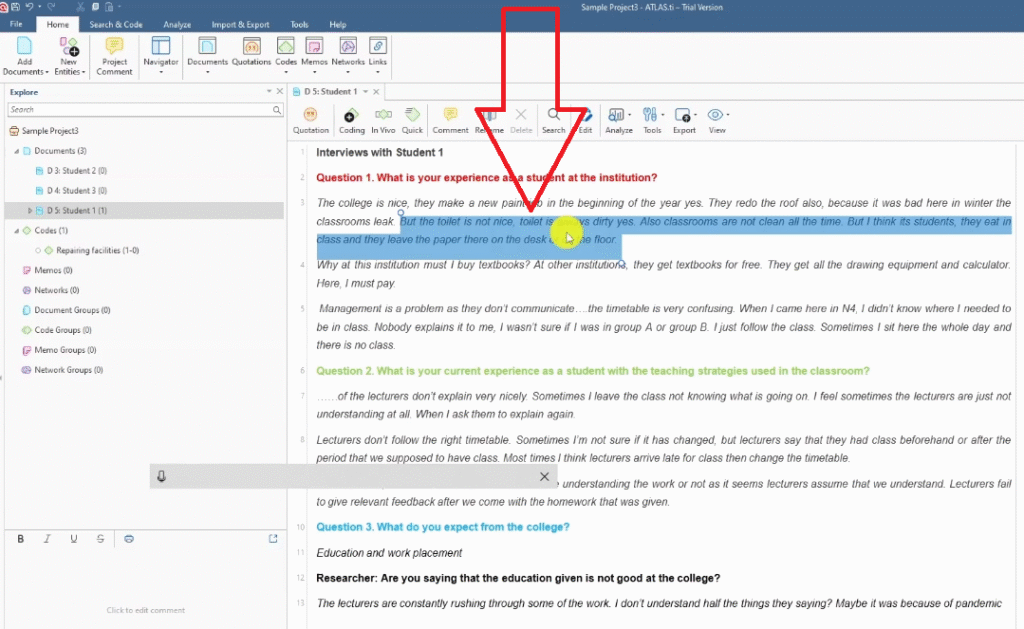
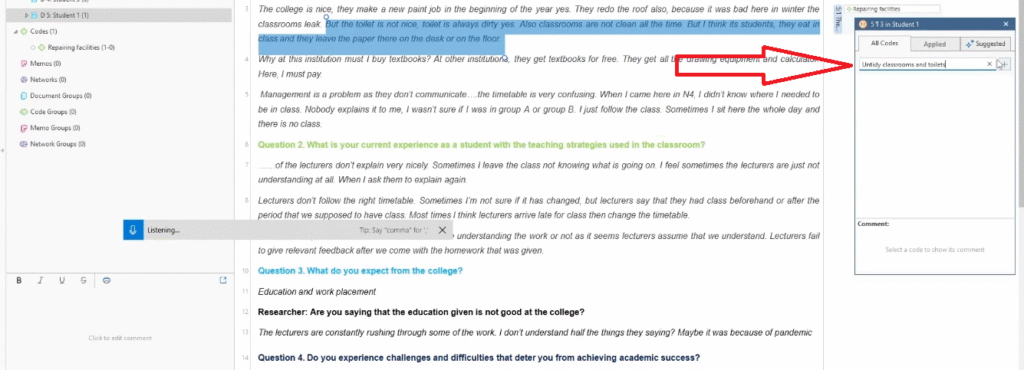
- Segment: toilet is always dirty, classrooms not clean → Code: untidy classrooms and toilets
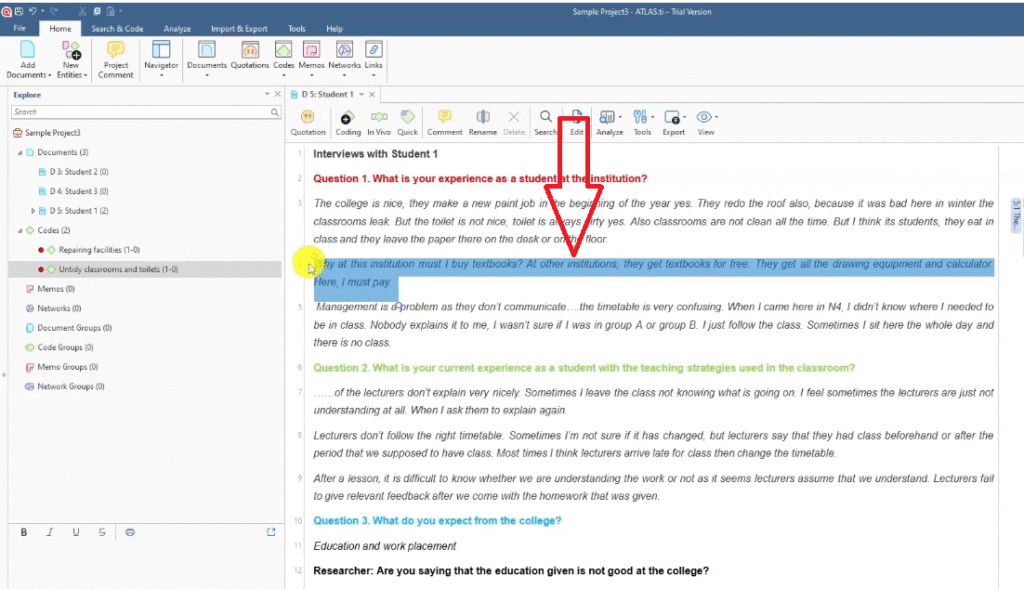
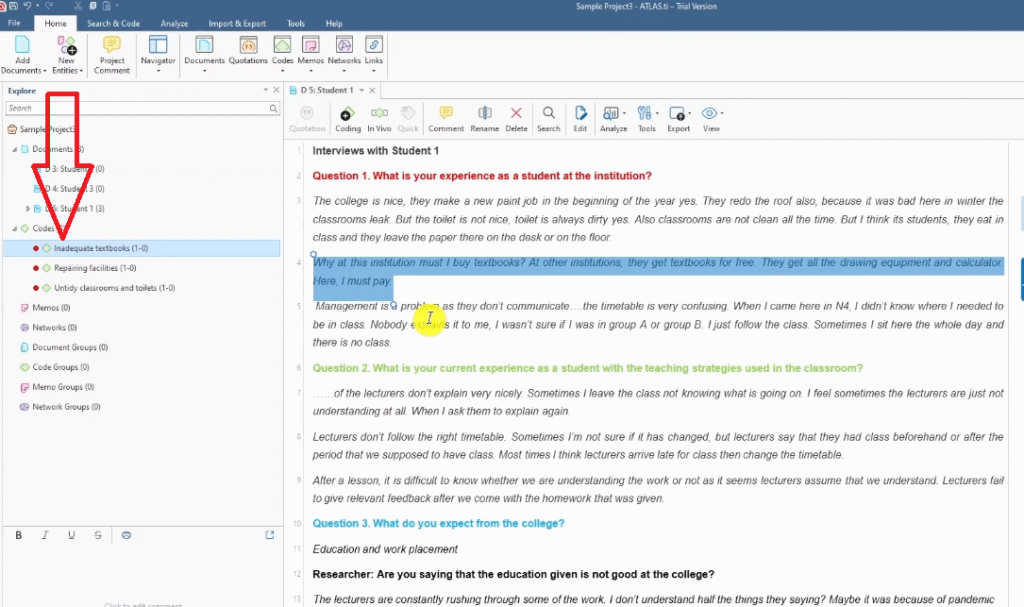
- Segment: must buy textbooks while other institutions provide them free → Code: inadequate textbooks
- Segment: management doesn’t communicate, timetable is confusing → Code: poor communication from management
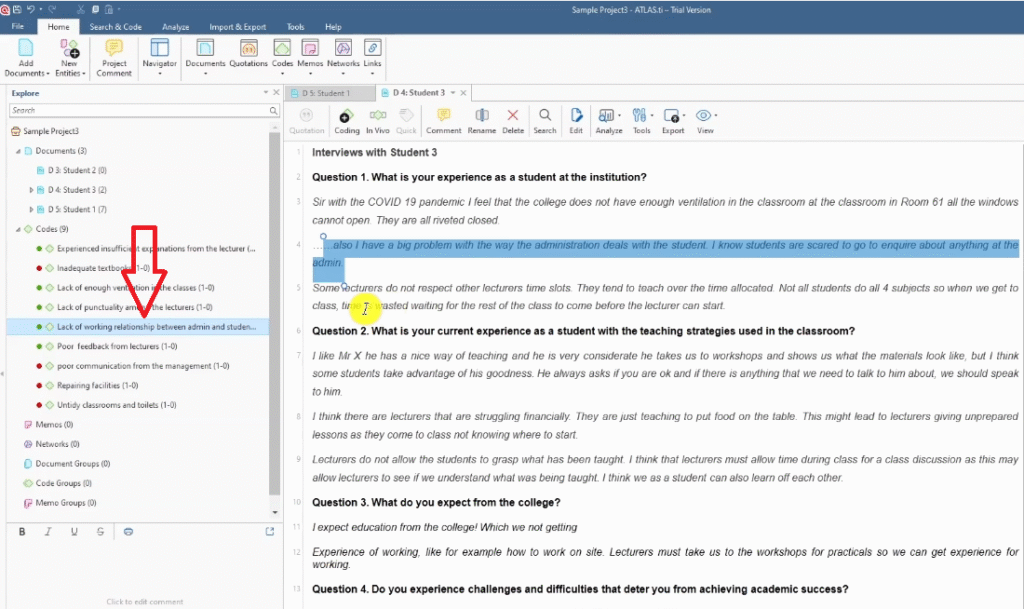
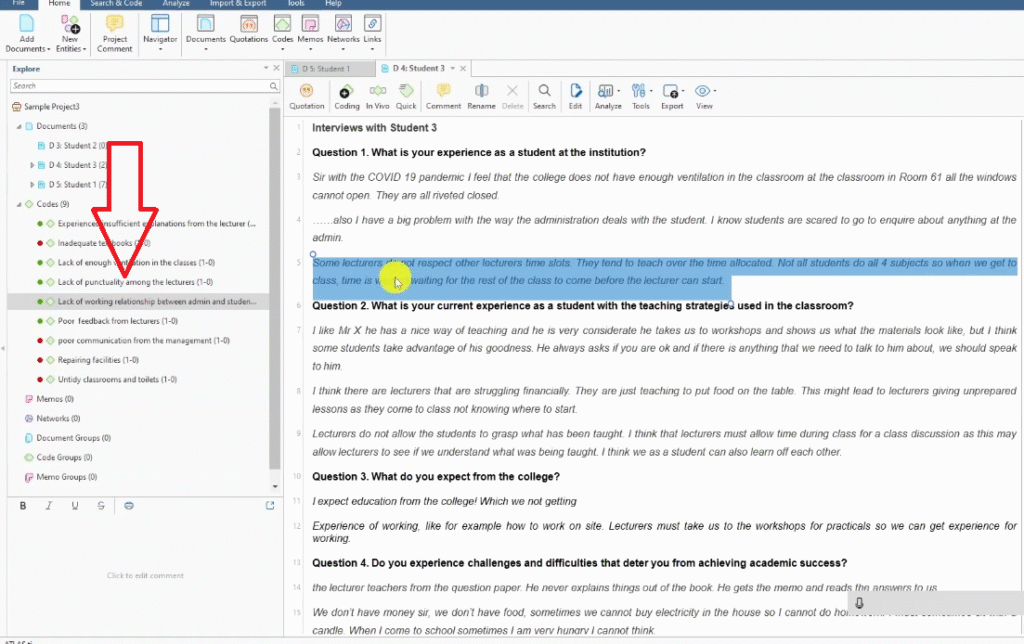
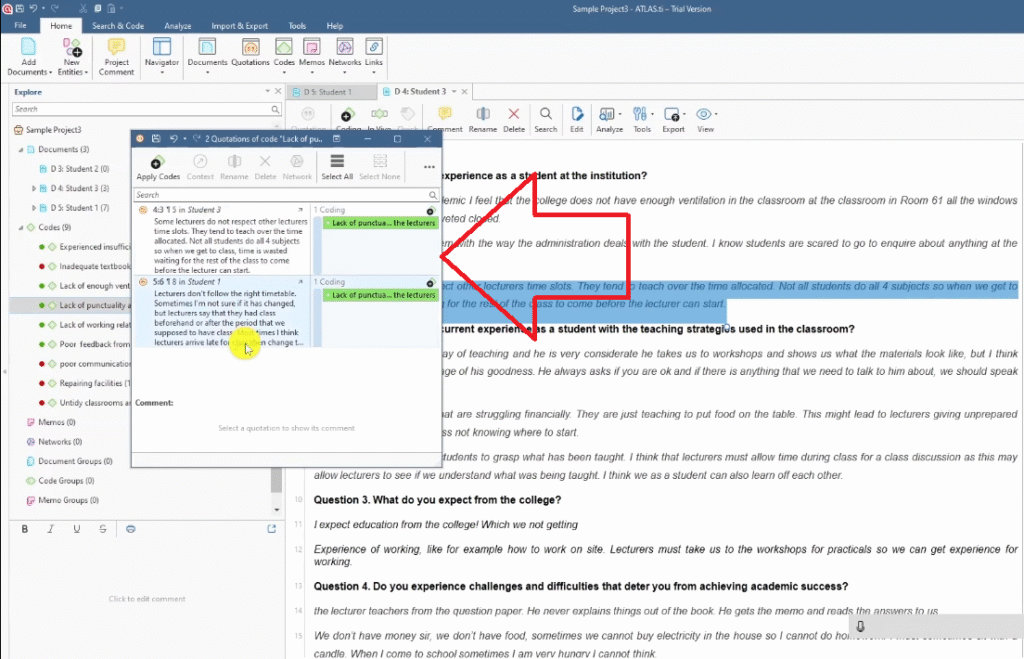
How to Merge Codes Across Multiple Transcripts
When two participants express the same thing, don’t create a duplicate code — merge the quotes into the existing code:
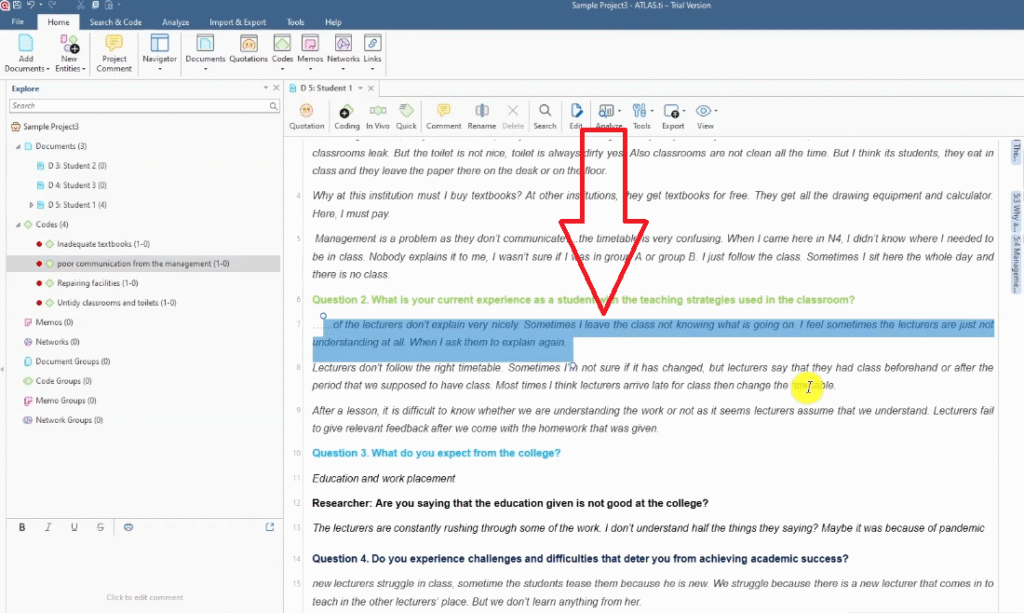
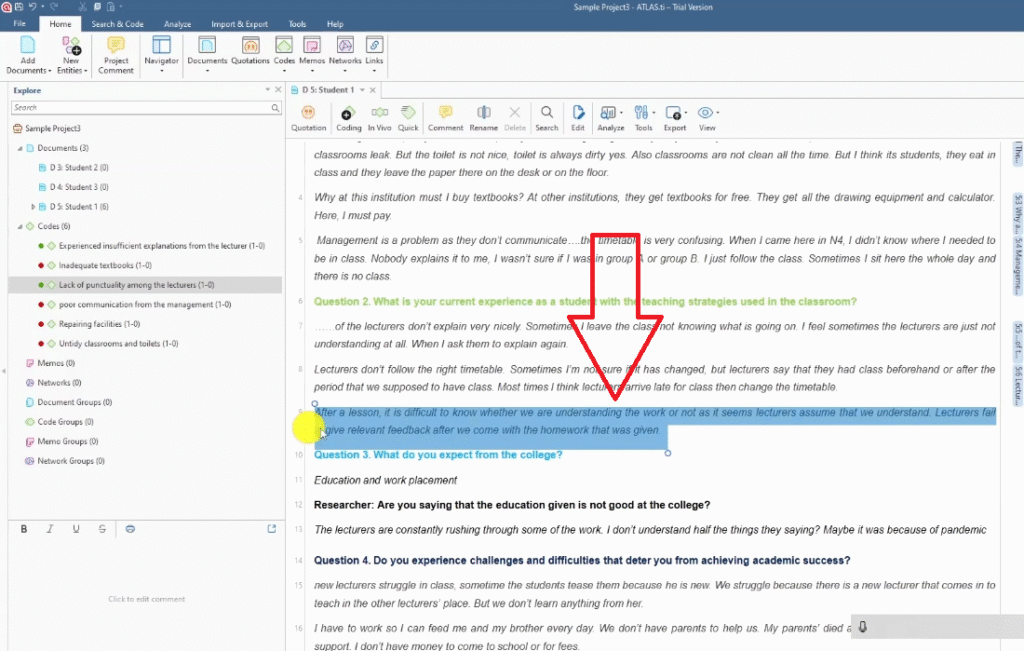
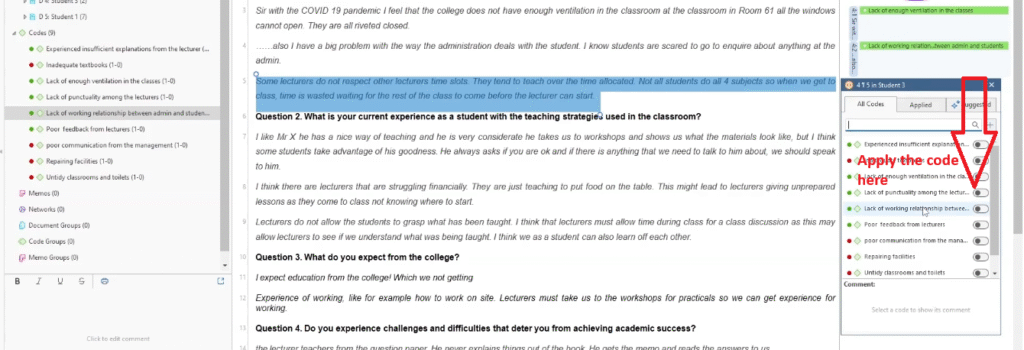
- In the second or third transcript, highlight the relevant quote.
- Right-click and select Apply Codes — search for your existing code name.
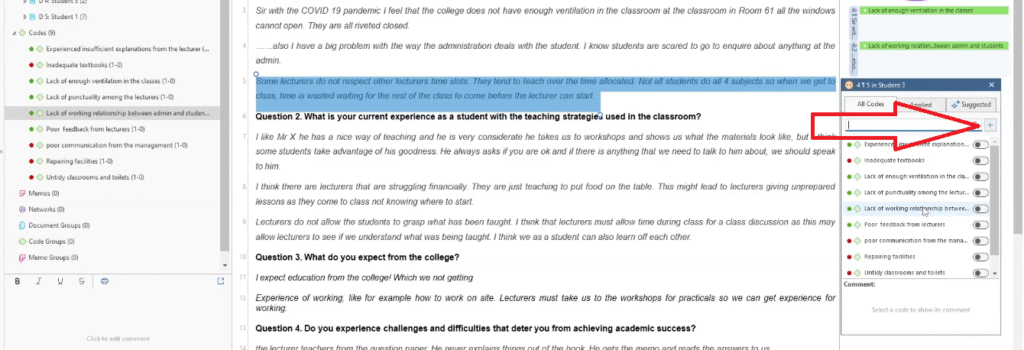
- Click the + sign next to the existing code to add this quote to it.
- Double-click the code to verify both quotes are now captured inside it.
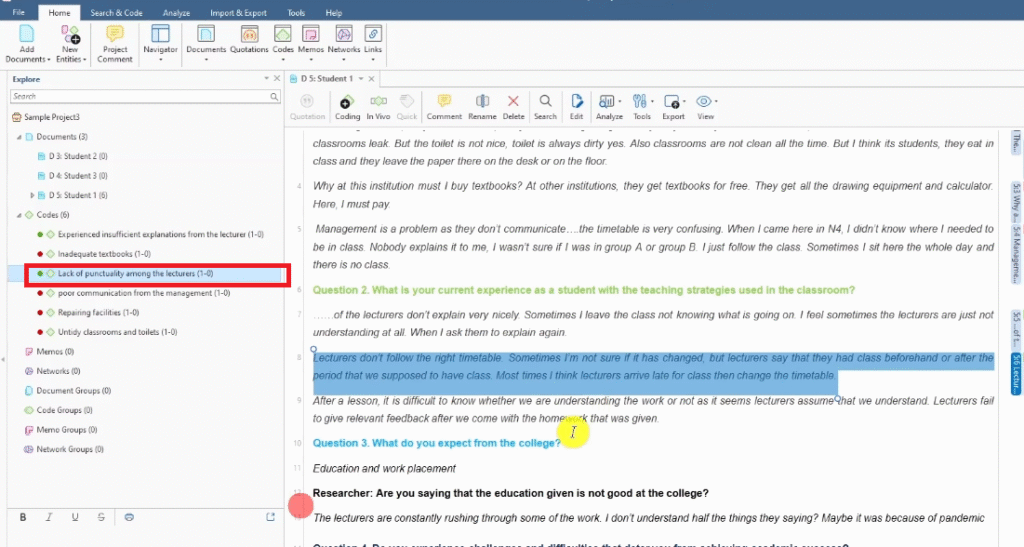
Example: Transcript 1 mentions lack of lecturer punctuality, and Transcript 3 also mentions lecturers not respecting time slots. Both quotes end up inside the single code “lack of punctuality among lecturers” — which now has 2 files and 2 references, signalling cross-participant support.
Work transcript by transcript — never jump between documents. Complete the full coding of one transcript before moving to the next.
Step 3 — Generating Themes from Your Codes
Once you’ve coded all your transcripts, you look across your codes for patterns of shared meaning. Codes that are talking about the same underlying issue get grouped into a theme.
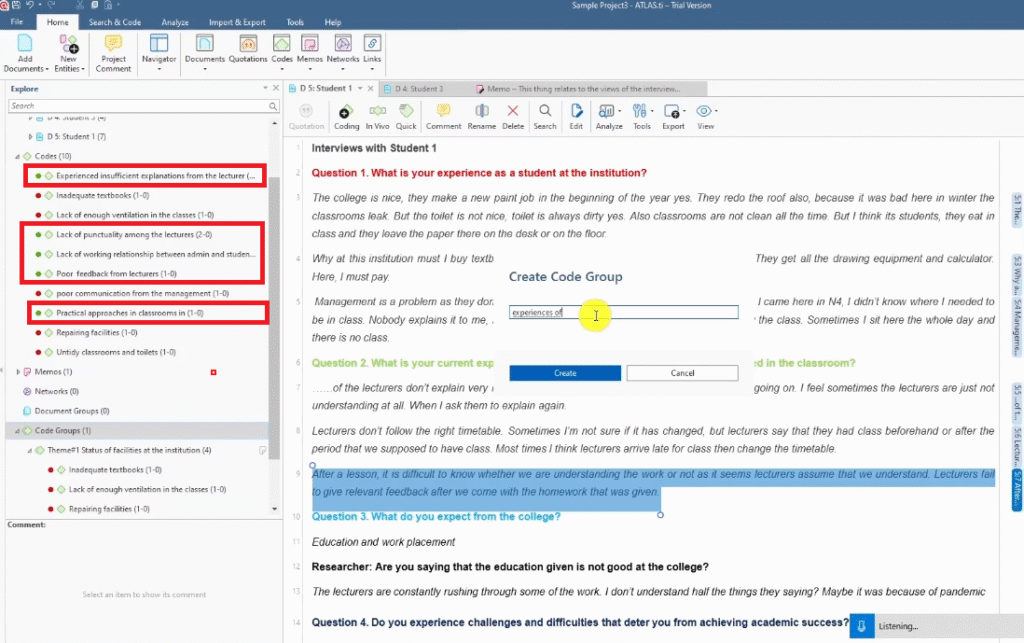
How to Create Code Groups (Themes) in ATLAS.ti
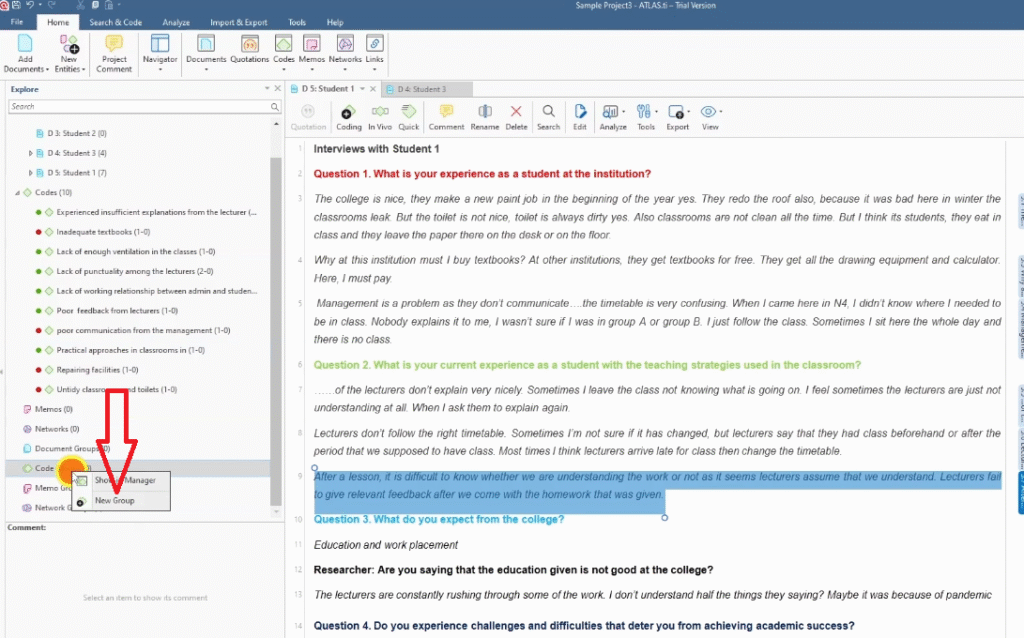
In ATLAS.ti, themes are created as Code Groups. Here’s how:
- In the Codes panel, click Code Groups > New Group.
- Give the group a name — this is your preliminary theme name.
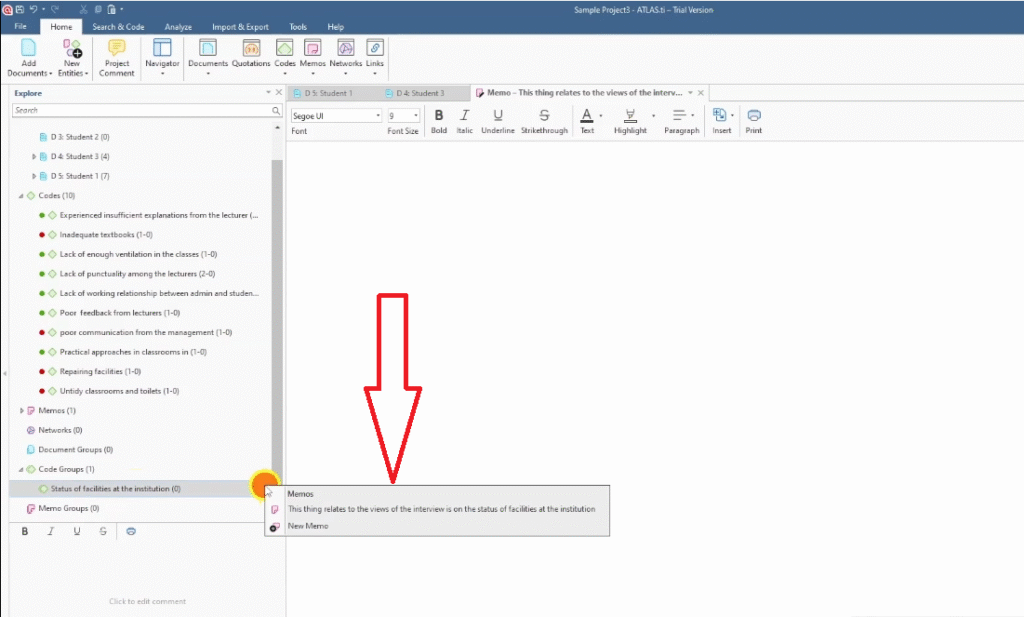
- Right-click the theme and select Add New Memo to write a brief description of what the theme captures.
- Rename the group (e.g. Theme 1, Theme 2) to keep your workspace organised.
- Drag and drop the relevant codes into the theme group.
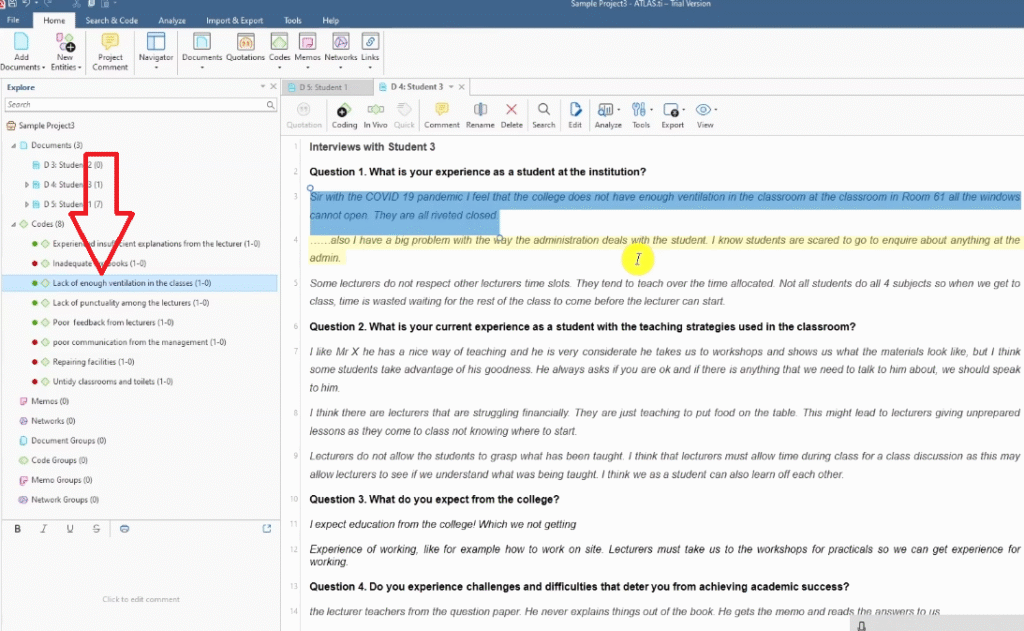
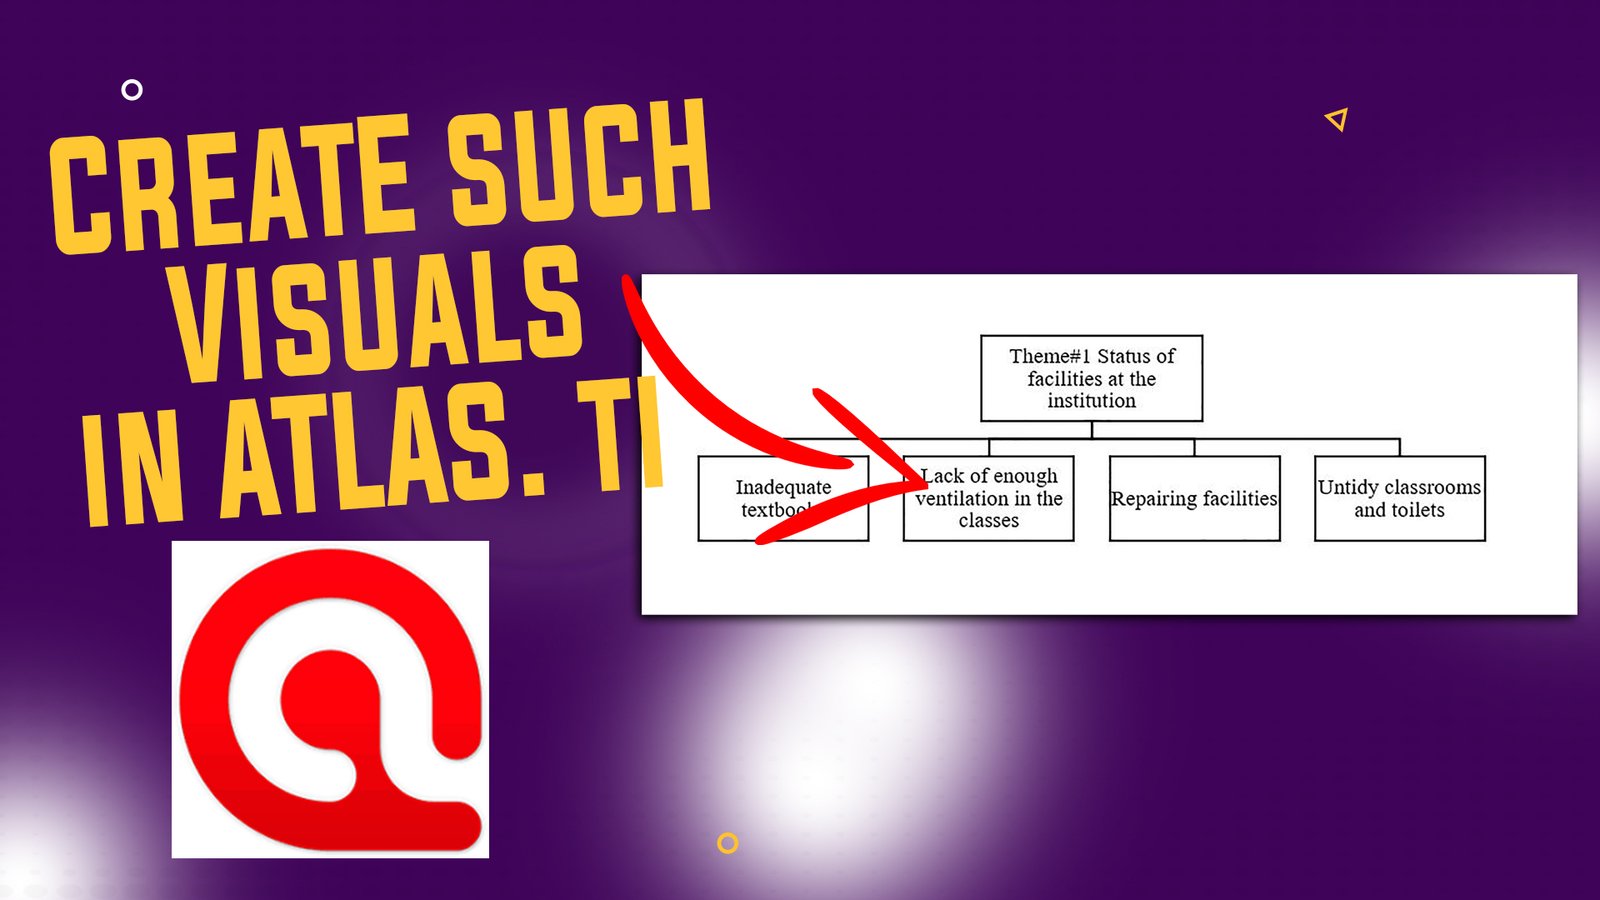
Example: looking at the red codes (question 1 responses) from all three transcripts:
- Lack of enough ventilation
- Repairing facilities
- Untidy classrooms and toilets
- Inadequate textbooks
- Poor communication from management
- Lack of working relationship between admin and students
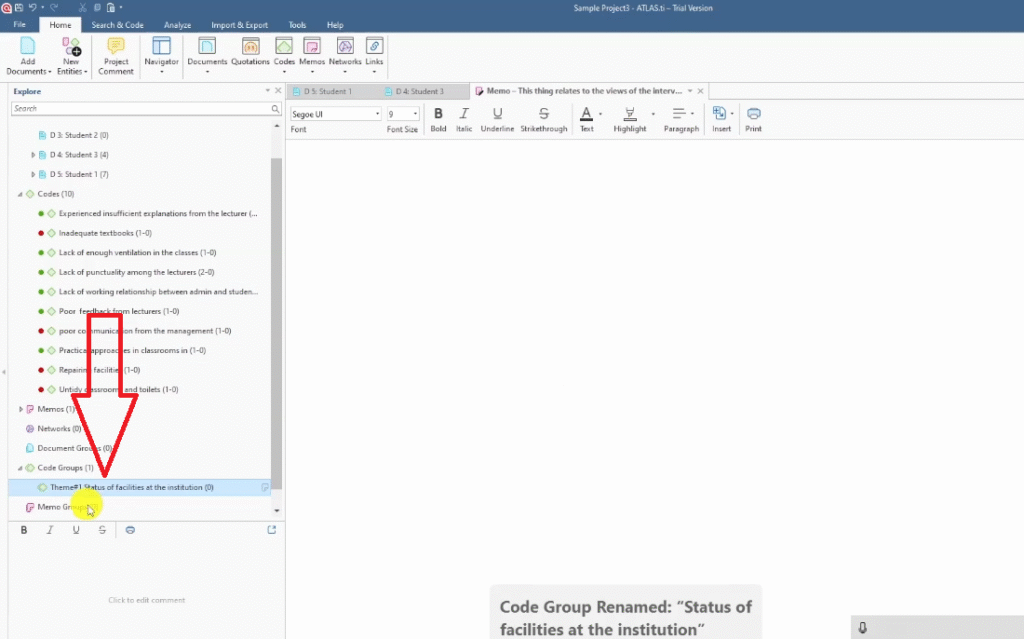
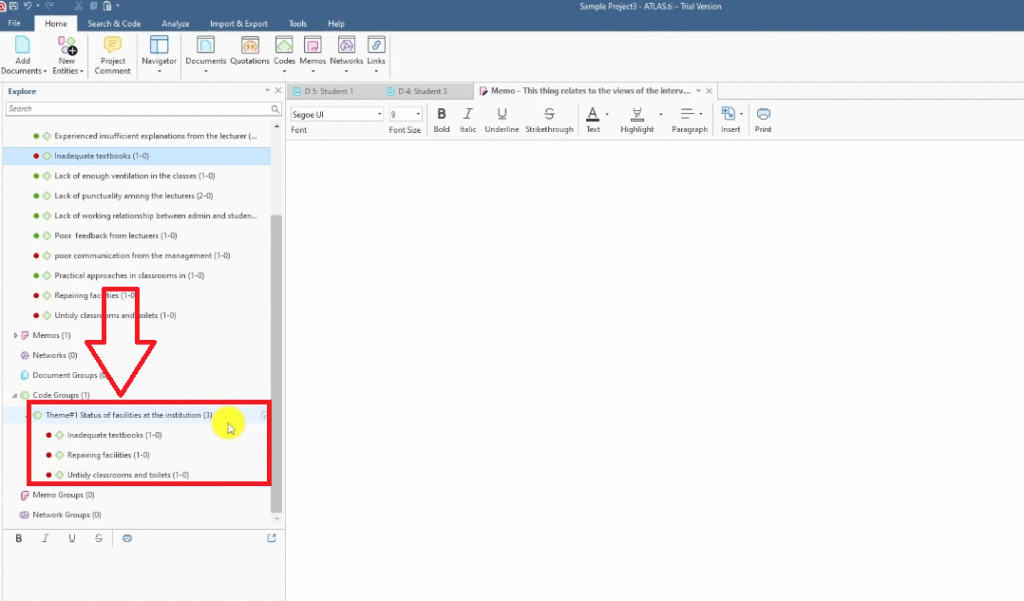
These codes all point to the same underlying issue: the physical and institutional environment at the college. Theme 1 becomes: Status of Facilities at the Institution.
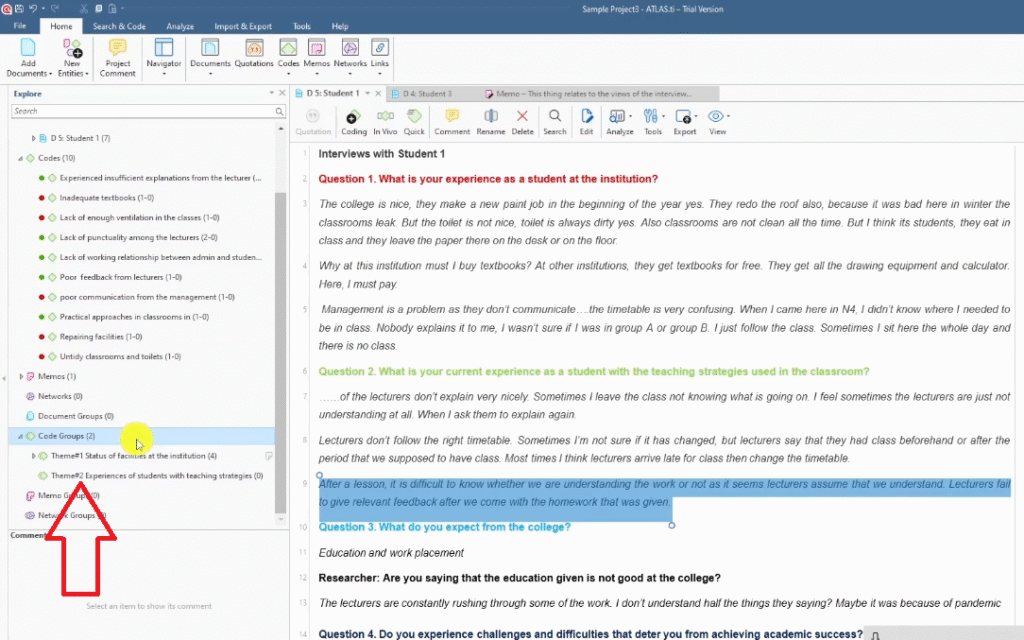
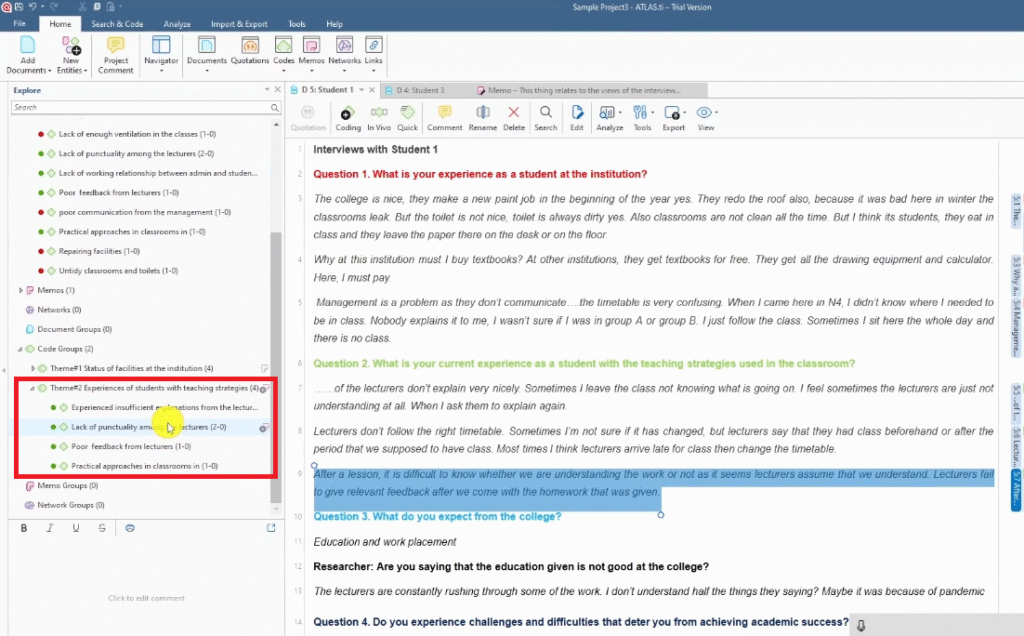
For the green codes (question 2 responses — teaching strategies):
- Experienced insufficient explanations from lecturers
- Lack of punctuality among lecturers
- Poor feedback from lecturers
- Practical approaches in classrooms
These codes speak to students’ experiences of classroom instruction. Theme 2 becomes: Experiences of Students with Teaching Strategies.
Steps 4–6 — Reviewing, Defining, and Reporting Your Themes
The final three Braun and Clarke steps take you from preliminary themes to a publishable findings chapter.
Step 4 — Reviewing themes: Go back through your transcripts with your provisional themes in mind. Ask: do the codes in each theme really belong together? Is any theme too broad or too narrow? Are there quotes that don’t fit? Revise your code groups until every theme has a clear, coherent centre.
Step 5 — Defining and naming themes: Write a one-paragraph definition for each theme that explains what it captures and what makes it distinct from your other themes. Refine the theme name so it communicates the essence clearly — avoid vague labels like “Theme A” or overly descriptive names that just list the codes.
Step 6 — Producing the report: Write up your findings in narrative form, using direct participant quotes as evidence. Each theme gets its own section in Chapter Four. For each code under the theme, you present a quote, interpret it in your own words, and explain how it connects to your research question.
For guidance on the visual outputs that accompany a findings report — word clouds, hierarchy charts, thematic tables — see my guide on 5 ways to visualize your ATLAS.ti results.
If you’d like to see an alternative coding approach for ATLAS.ti, my step-by-step guide on inductive thematic analysis using ATLAS.ti (Saldana’s method) covers how to apply Saldana’s coding framework as a complement to Braun and Clarke.
And if you’re still at the data collection stage, my article on how to conduct a qualitative research interview will help you structure your interviews so the transcripts are easier to code.
Not yet sure whether qualitative research is the right approach for your study? My guide on qualitative vs quantitative data breaks down the key differences.
Frequently Asked Questions
What is the difference between Braun and Clarke thematic analysis and other approaches?
Braun and Clarke’s approach is reflexive — it acknowledges that themes don’t simply emerge from the data but are actively constructed by the researcher. This makes it distinct from grounded theory (which aims for theory-building) and content analysis (which often counts frequencies). It’s particularly suited to interpretivist research that values participant perspectives.
How many themes should I have after thematic analysis?
There is no fixed number, but most dissertation findings chapters have between 3 and 6 themes. Too few themes risk being too broad and unsubstantiated; too many risk being overly fragmented. Each theme should be distinct from the others and supported by multiple codes and participant quotes.
Can I use Braun and Clarke thematic analysis with ATLAS.ti specifically?
Yes — ATLAS.ti is fully compatible with the Braun and Clarke approach. You use the Documents panel for step 1, the Codes panel for step 2, and the Code Groups feature for step 3. The software doesn’t constrain your methodology — it’s a tool for organising and tracking the analytical work you’re doing.
Do I have to use all six steps in the Braun and Clarke framework?
In practice, the six steps are iterative, not strictly linear. You’ll often cycle back — returning to step 1 after step 3 to re-read transcripts, or revising codes in step 2 while you’re reviewing themes in step 4. The framework is a guide, not a rigid checklist. What matters is that your analysis is systematic, transparent, and well-documented.
What’s the difference between a code and a theme?
A code is a short label applied to a specific segment of data — it captures what one participant said or meant in one place. A theme is a higher-level pattern that appears across multiple codes and multiple participants. Themes answer the question: what does this dataset tell us about the research question?
Key Takeaways
- The Braun and Clarke framework has six steps: familiarise, code, generate themes, review, define, and report
- In ATLAS.ti, you use the Documents panel for your transcripts and the Codes panel for all your codes
- Color-coding your interview questions before you start is one of the most effective organisational strategies
- Codes from different participants that share meaning get merged — don’t create duplicate codes
- Themes are created as Code Groups in ATLAS.ti — drag and drop the relevant codes into each group
- Steps 4–6 (reviewing, defining, reporting) are where your analysis becomes defensible — don’t rush them
Need Help With Your ATLAS.ti Thematic Analysis?
If you’ve completed your interviews but aren’t sure how to turn the transcripts into a finished findings chapter, I can help. I’ve worked with more than 250 PhD students on this exact process — from raw data to a submission-ready analysis.
Get in touch here and tell me where you are. I’ll take it from there.
![Qualitative Analysis of Interviews in ATLAS.ti [Step-by-Step]](https://survivingresearch.com/wp-content/uploads/2025/09/Qualitative-Data-Analysis-Just-Got-Easier-Atlas.ti-Tutorial-2025.jpg)
Pingback: Inductive Thematic Analysis in ATLAS.ti: Saldana's Method -
Pingback: 9 Best Qualitative Data Analysis Software Tools [Compared] -