NVivo Qualitative Analysis Tutorial: Coding, Themes & Reporting

Last Updated on 6 days ago by Bernard Mugo

What this tutorial covers: This complete NVivo tutorial walks you through the full qualitative analysis process for interview data — from importing raw transcripts through coding, developing themes using Braun and Clarke’s framework, writing up your findings, and visualizing your results using nine different NVivo tools.

If NVivo feels overwhelming and you’re not sure how to analyze your interviews properly, you’re in exactly the right place.

In this complete step-by-step tutorial, I’ll take you through the full qualitative analysis process in NVivo — from raw transcripts through qualitative coding, developing themes, reporting your findings, and visualizing your results clearly and professionally. By the end, you’ll know exactly how to use NVivo for your thesis or dissertation.

My name is Bernard Mugo. Over the past four years, I’ve helped more than 600 PhD students analyze qualitative data and finally complete their dissertations. This tutorial brings together the most important NVivo skills into one place. For software documentation throughout this tutorial, the NVivo official resource hub is a reliable reference.

This tutorial covers four parts:

  1. How to Code Interview Transcripts in NVivo
  2. How to Develop Themes from Your NVivo Codes
  3. How to Write Up and Report Your Findings from NVivo
  4. 9 Ways to Visualize Your Qualitative Data in NVivo


Part 1 — How to Code Interview Transcripts in NVivo

What Is Qualitative Coding?

One of the most important skills in qualitative data analysis is generating qualitative codes — what we simply call “coding.” Coding is the process of tagging important quotes from your original data and interpreting them in a way that lets you combine those codes to form themes at a later stage.

A code is a short label or interpretive statement you attach to a segment of your data. You’re not summarizing — you’re interpreting. You’re tagging information with a concise label that captures its meaning in relation to your research questions.

What Do Codes Look Like? (Real Examples)

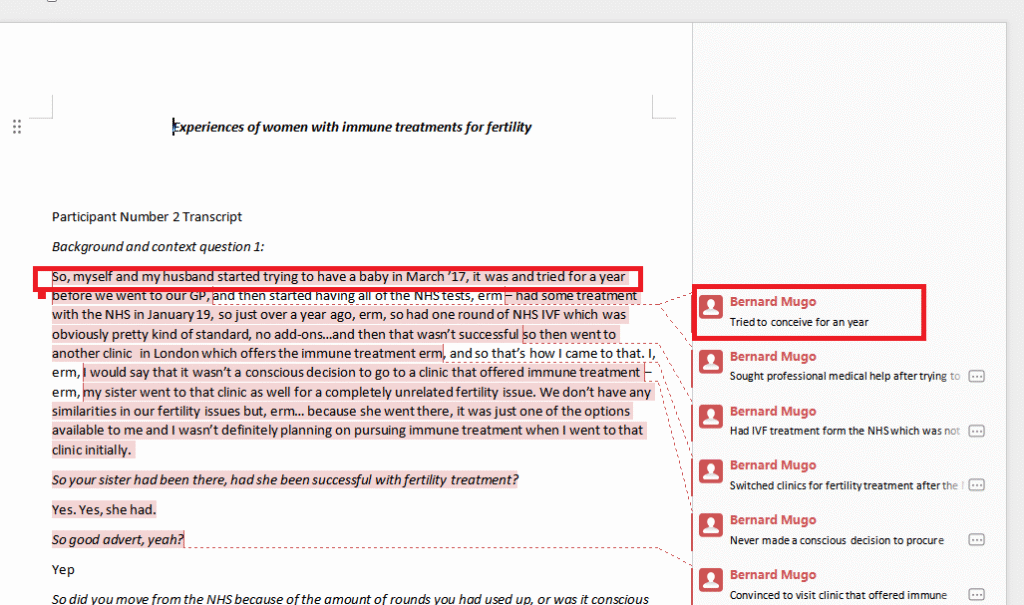
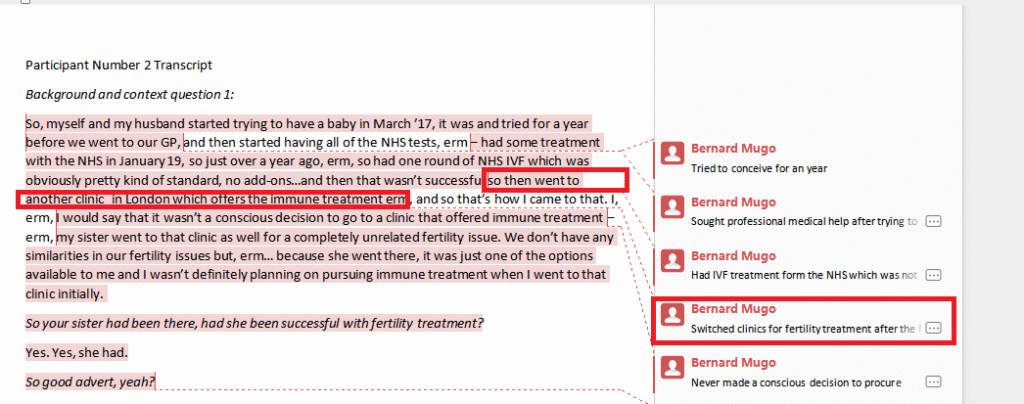
 Here’s a real example. I’m reading through a transcript about the experiences of women with immune treatments for fertility. One participant says:

“…myself and my husband started trying to have a baby in March 17, tried for a year before we went to our GP… had one round of NHS IVF, which wasn’t successful, so then went to another clinic in London which offers immune treatment…”

From this excerpt, I generate two codes:

  • Tried to conceive for a year — attached to the first sentence
  • Switched clinics for fertility treatment — attached to the second sentence

Notice I’m not summarizing what the participant said. I’m interpreting the meaning of their words in relation to the research objective. That is the core discipline of qualitative coding.

Code "tried to conceive for a year" manually generated from qualitative interview transcript
Code “tried to conceive for a year” manually generated from qualitative interview transcript
Code "switched clinics for fertility treatment" manually created from interview transcript coding
Code “switched clinics for fertility treatment” manually created from interview transcript coding

Step-by-Step: Coding Interview Transcripts in Nvivo 15

I’m using NVivo 15 — the current version as of 2025. The core coding process works the same way in NVivo 12, 14, and 15. For this tutorial, I’m working with a study on the opinions of physiotherapists on assessing the psychological well-being of stroke patients. If you want to go deeper into the inductive coding approach before continuing, my guide on inductive thematic analysis using NVivo (Saldana’s method) covers that in full.

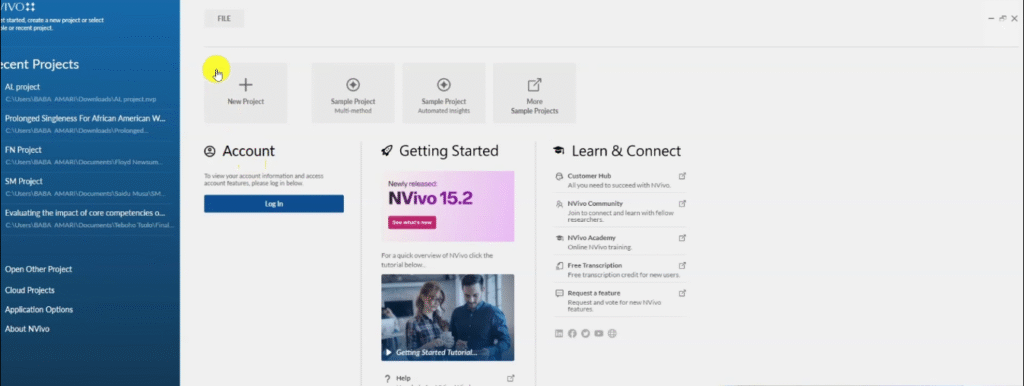
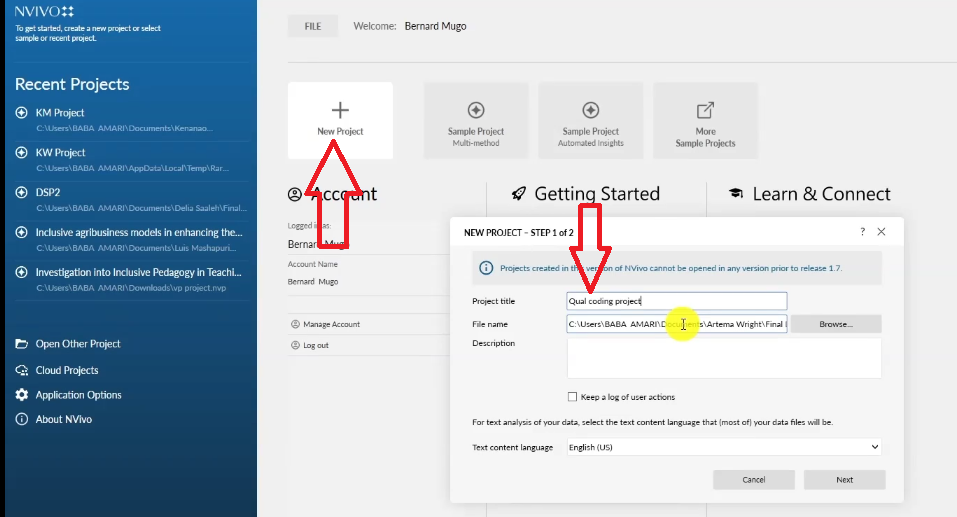
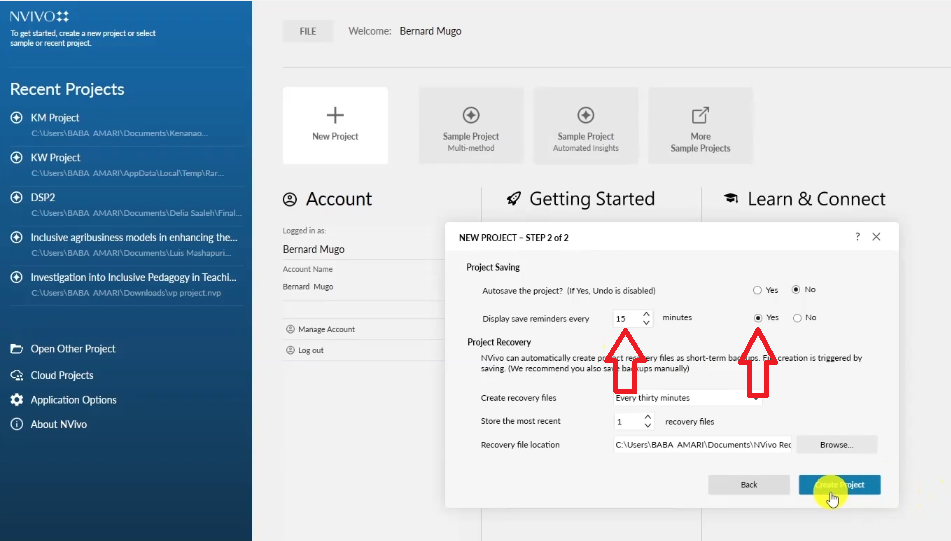
Setting up your NVivo project:

  1. Open NVivo and click New Project. Name it anything — I’ll call mine “Qual coding projects”
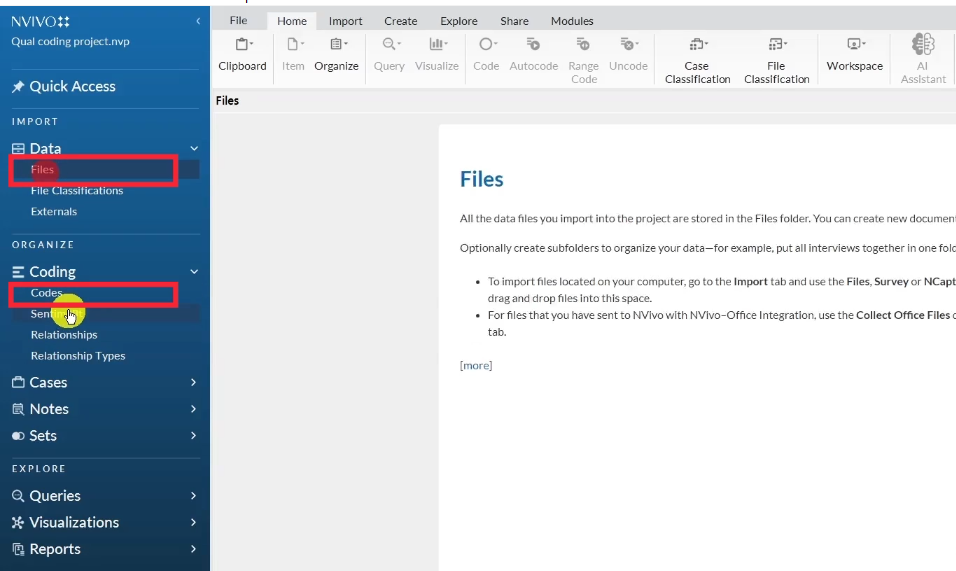
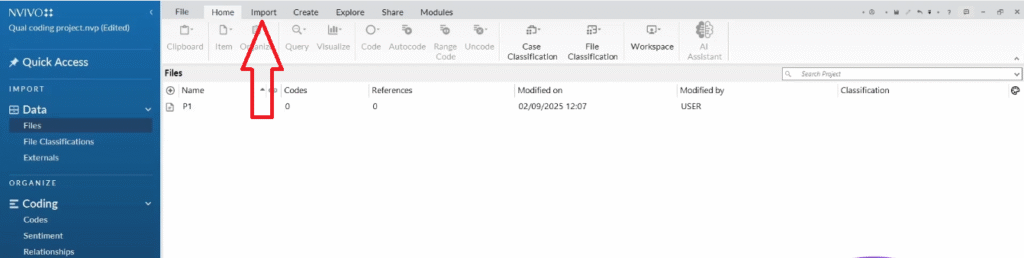
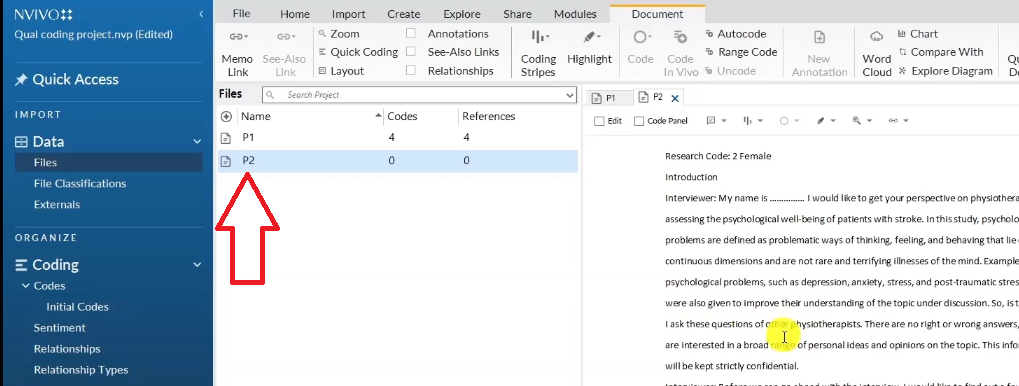
  2. In the Files section, drag and drop your interview transcripts to import them. You can also go to Import → Files if you prefer
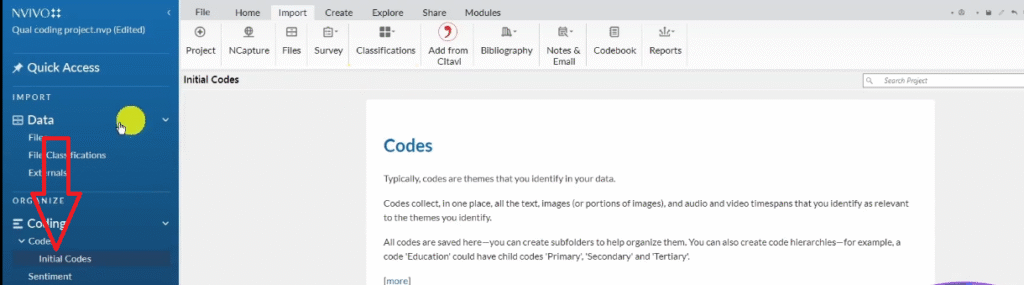
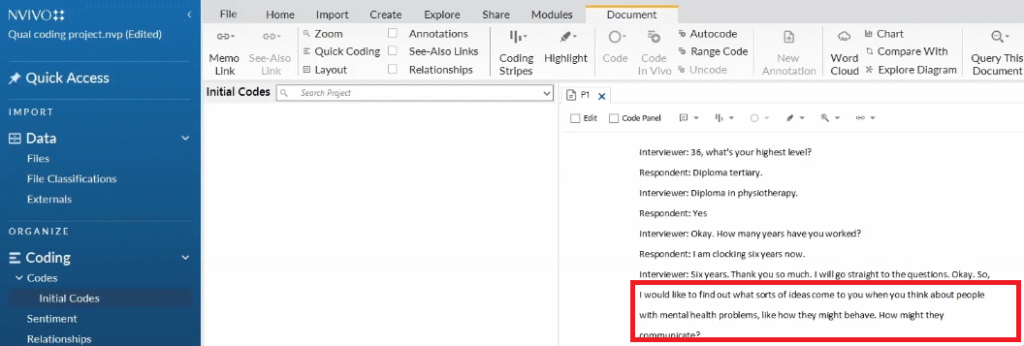
  3. In the Codes section, create a folder called “Initial codes” to keep your work organized. It’s not mandatory, but it helps you track your work as you move toward theme development later
  4. Open the first transcript by double-clicking it
NVivo 15 interface overview showing files and codes panel for qualitative data analysis
New NVivo project named Qual coding projects created for qualitative interview analysis
NVivo project settings and save reminder displayed when creating a qualitative analysis project
Files and codes panel in NVivo 15 — the two core menus used in qualitative thematic analysis
Interview transcripts imported into NVivo 15 files section by drag and drop
An image of the dropped fileInterview transcripts imported into NVivo 15 files section by drag and drop
Import icon in NVivo 15 for uploading interview transcript files for qualitative coding
Files icon in NVivo showing navigation to locate and import interview transcripts
Initial codes folder created in NVivo codes section to organize qualitative coding

How to color-code by interview question:

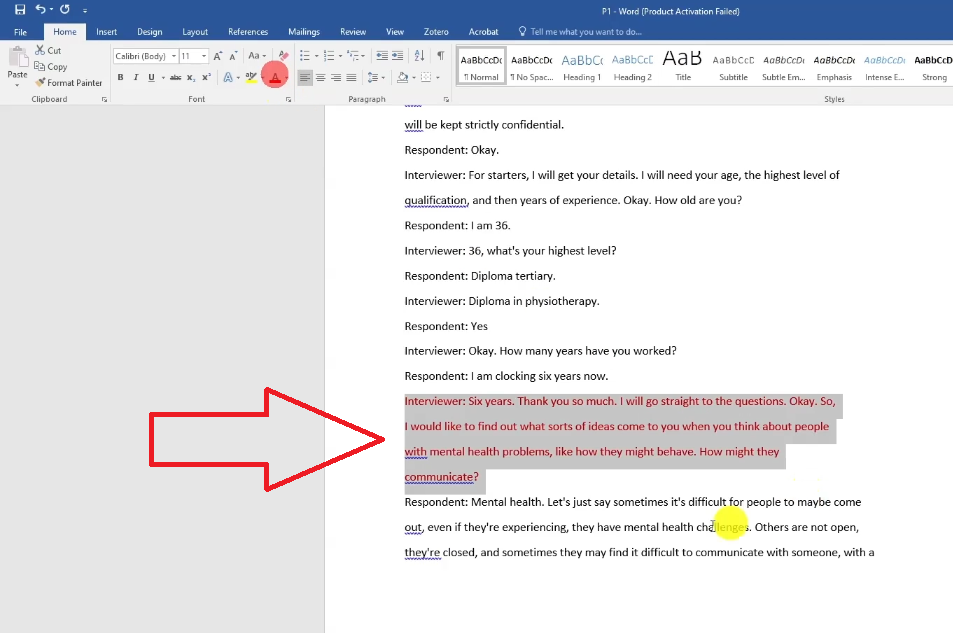
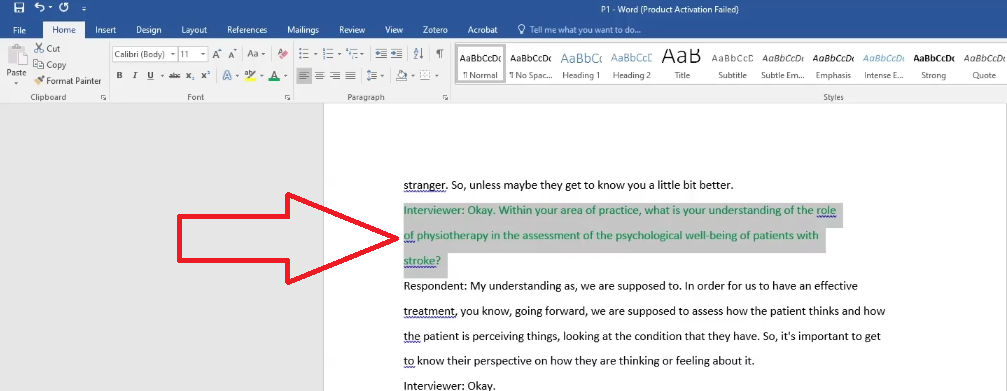
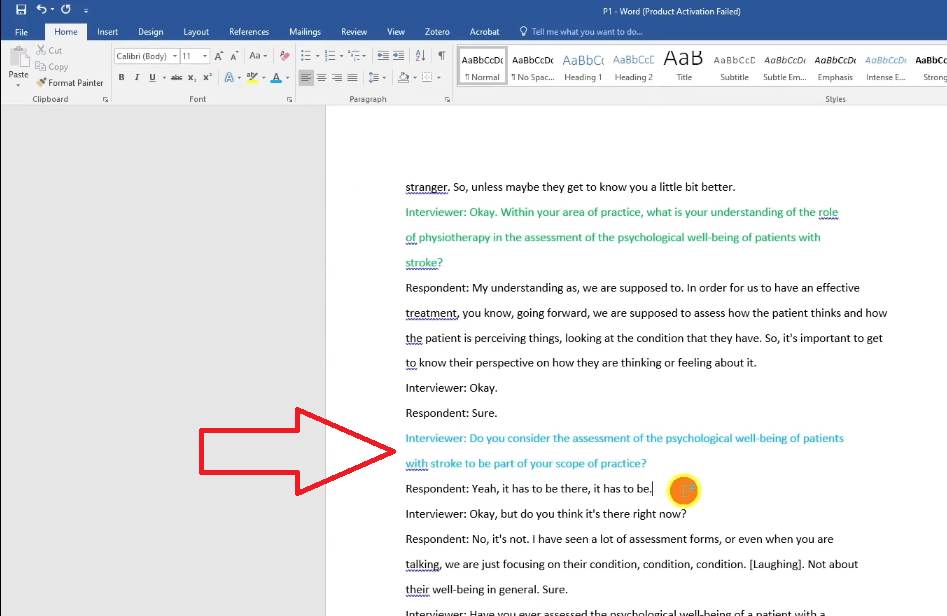
Before coding, I like to color-code the interview questions in the transcript so I can later see which codes came from which question. In NVivo, highlight an interview question and mark it red for question one, green for question two, blue for question three, and so on. This becomes very useful in Step 2 when you start grouping codes into themes.

First interview question highlighted in red in NVivo transcript for color-coded qualitative coding
Second interview question highlighted in green in NVivo transcript for color-coded qualitative coding
Third interview question highlighted in blue in NVivo transcript for color-coded qualitative coding

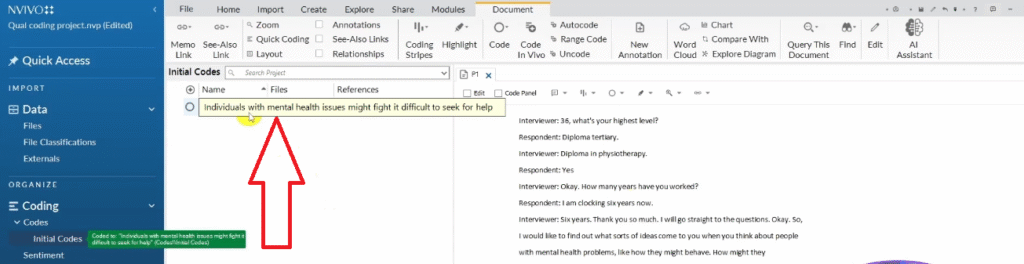
Generating and applying codes:

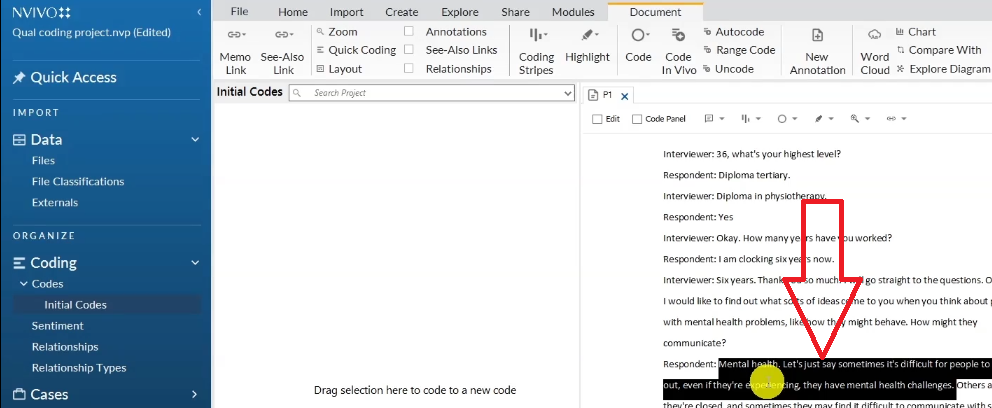
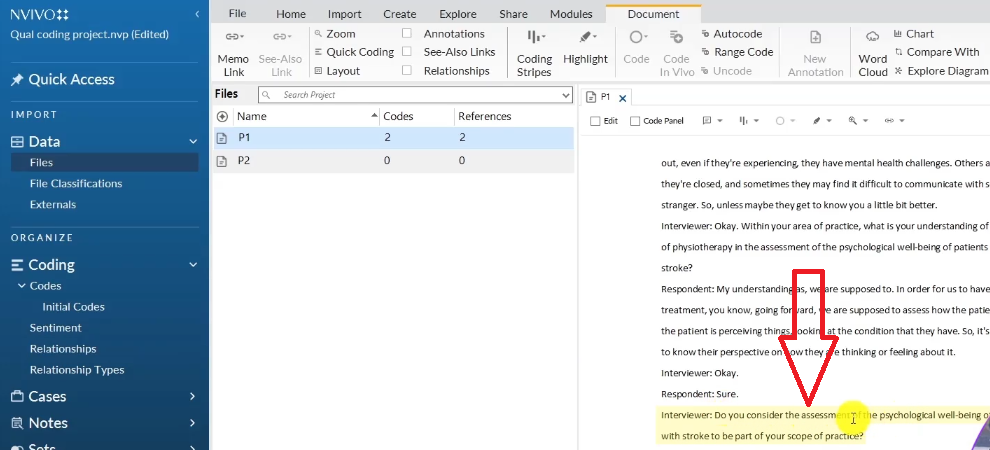
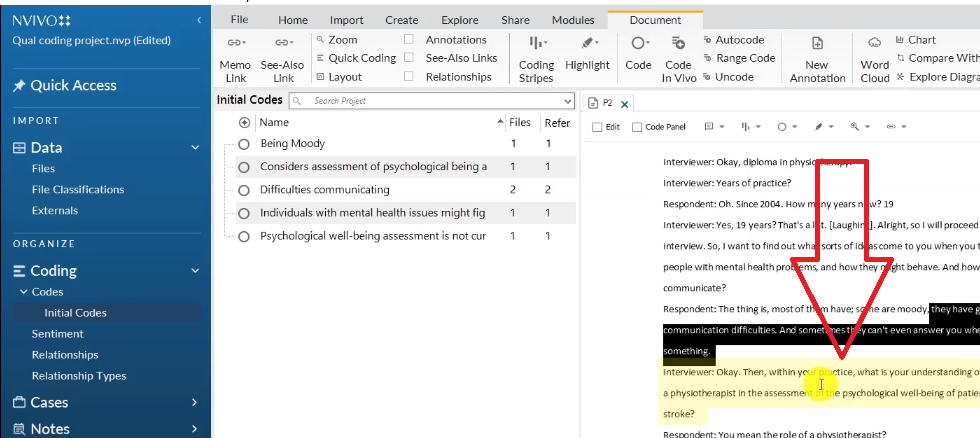
  1. Read through a full paragraph before generating any codes — understand the context before you label it
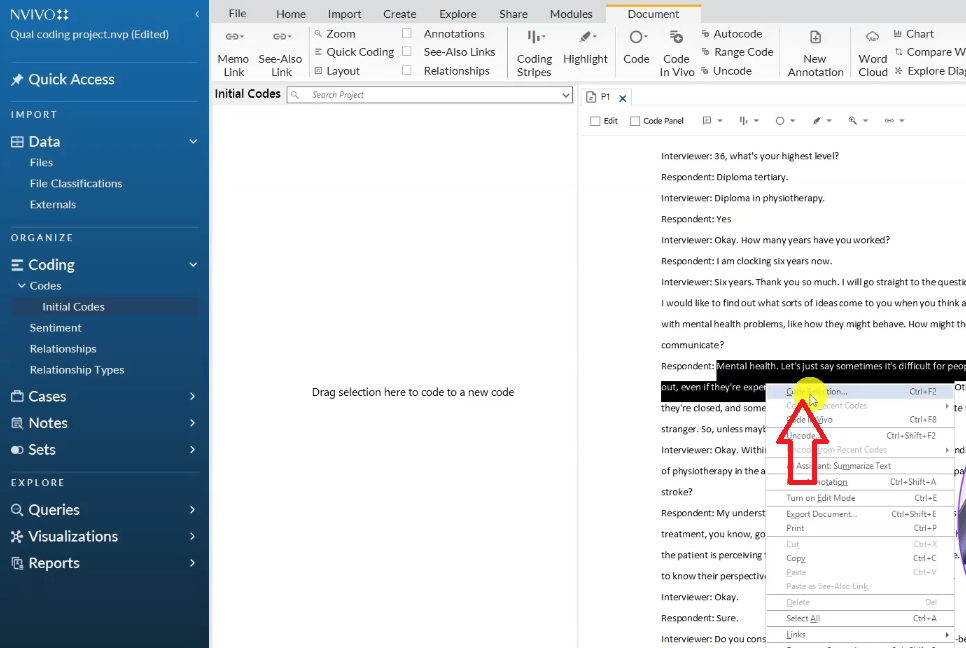
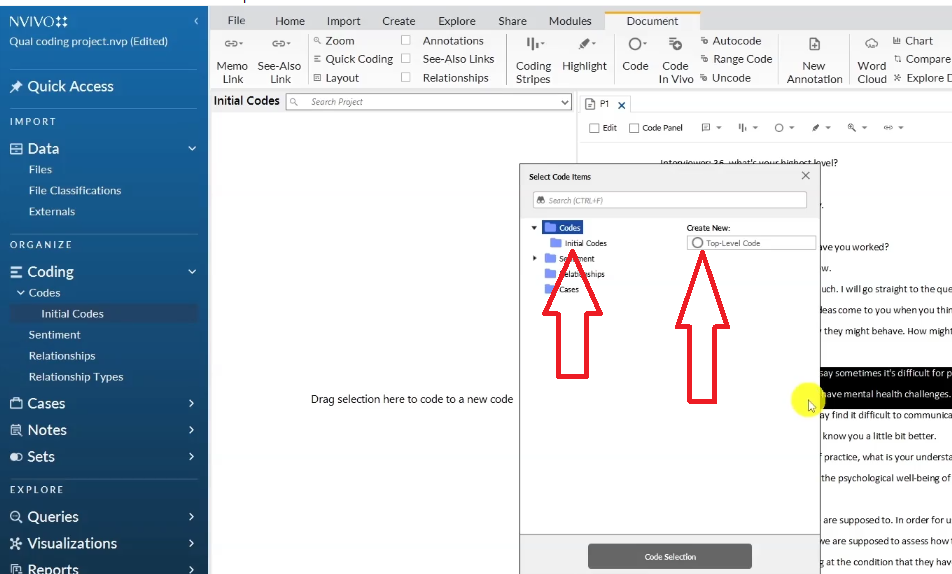
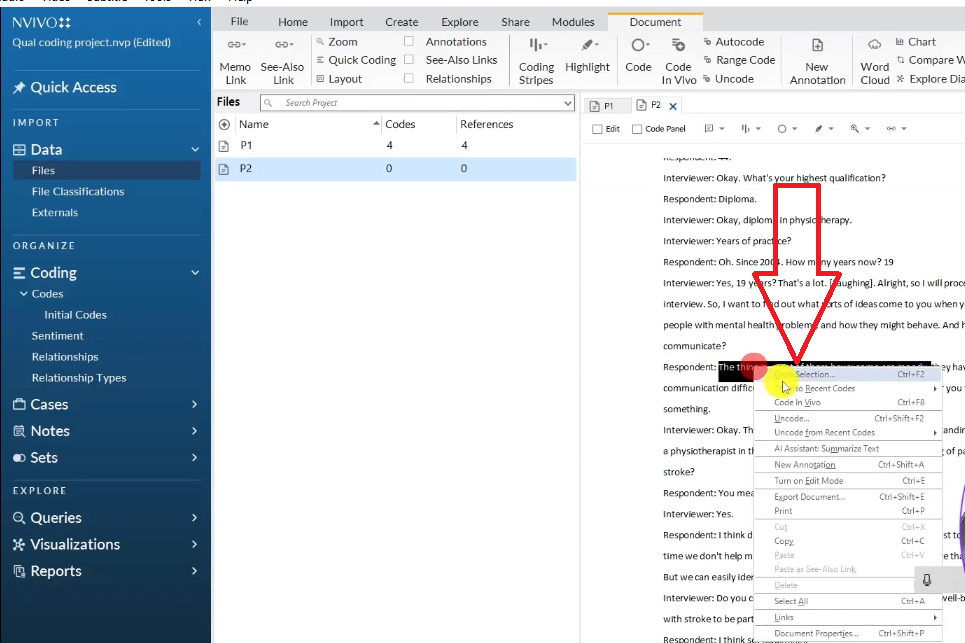
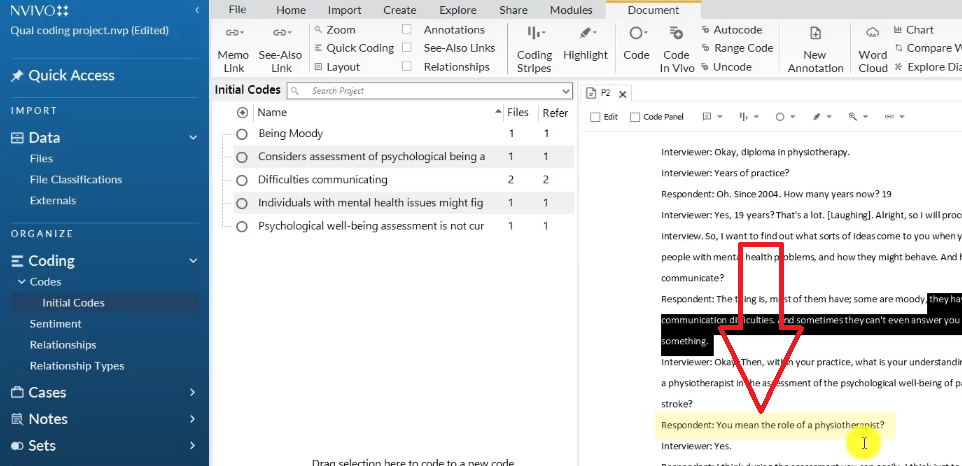
  2. Highlight the key passage → right-click → select Code Selection → navigate to Initial Codes → Top Level Codes → type your code name
  3. Make your codes interpretive, not just descriptive. “Patients reluctant to disclose mental health challenges” is a code. “Mental health” alone is just a topic
  4. Assign a color to each code matching the question it came from — this is how you’ll group them into themes later

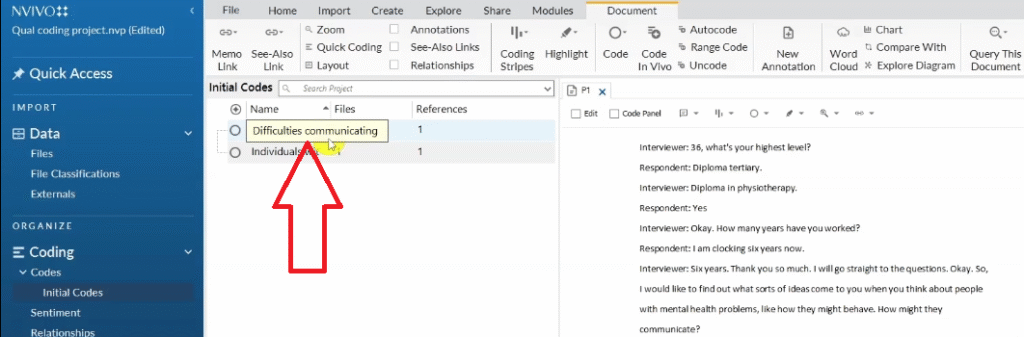
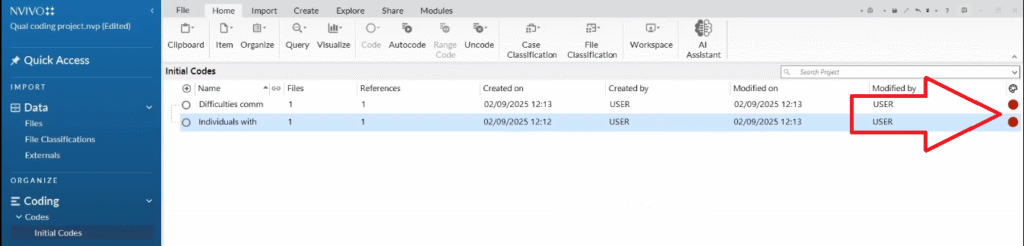
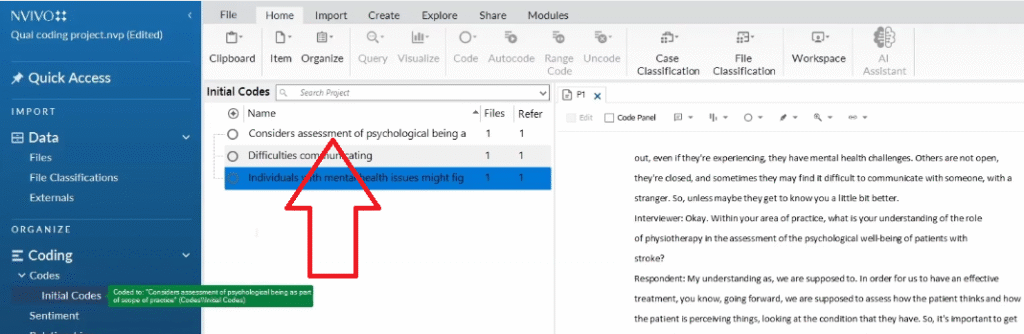
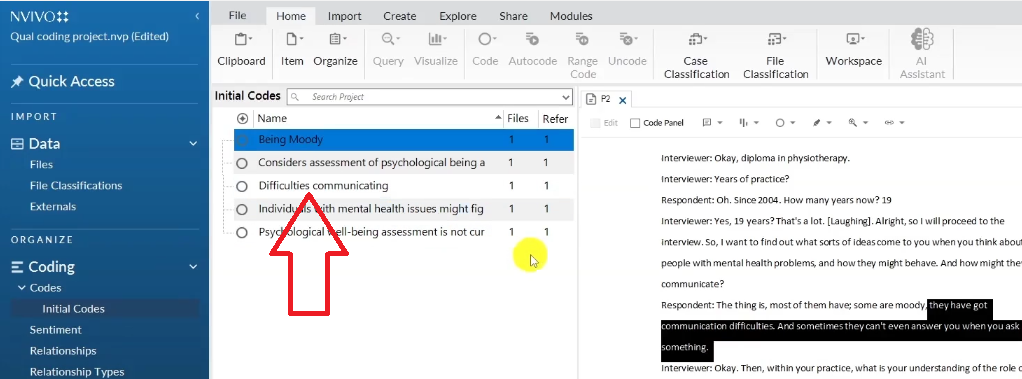
Some examples of codes generated from the physiotherapy study:

  • Individuals with mental health issues might find it difficult to seek help
  • Difficulties communicating
  • Considers assessment of psychological well-being as part of scope of practice
  • Psychological well-being assessment not currently provided to stroke patients
Interview question displayed in NVivo: ideas about how people with mental health problems communicate
Key passage highlighted in NVivo transcript — patients might find it difficult to seek help for mental health
Code selection right-click menu in NVivo for applying codes to highlighted interview text
Navigation to initial codes in NVivo for applying first qualitative code from interview transcript
Code "individuals with mental health issues might find it difficult to seek help" created in NVivo
Code “individuals with mental health issues might find it difficult to seek help” created in NVivo
Second passage highlighted in NVivo transcript — difficulties communicating with mental health challenges
Code "difficulties communicating" created in NVivo from physiotherapy interview transcript
Code “difficulties communicating” created in NVivo from physiotherapy interview transcript
Color icon in NVivo right-click menu for assigning red color to code from first interview question
Qualitative codes color-coded red in NVivo to indicate they came from the first interview question
Interview question about scope of practice in NVivo transcript for qualitative coding
Code "considers assessment of psychological well-being as part of scope of practice" created in NVivo
Code “considers assessment of psychological well-being as part of scope of practice” created in NVivo
Second participant response about current practice visible in NVivo transcript for coding
Code "psychological well-being assessment not currently provided to stroke patients" created in NVivo
Code “psychological well-being assessment not currently provided to stroke patients” created in NVivo
Highlight button in NVivo showing all coded sections after completing first transcript analysis

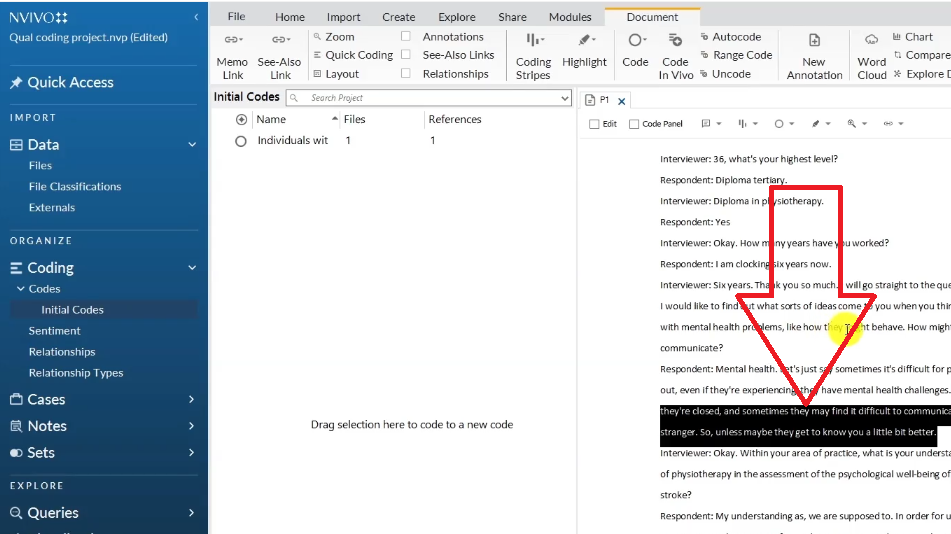
Coding across multiple transcripts:

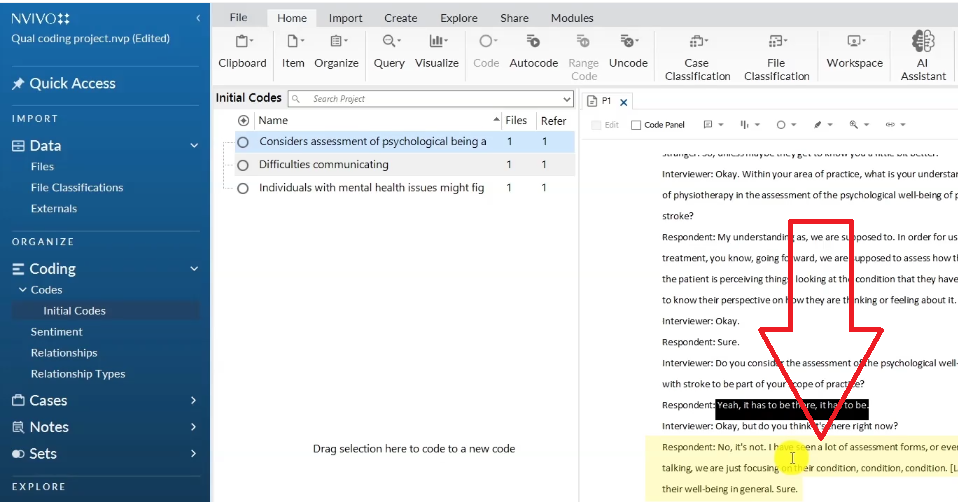
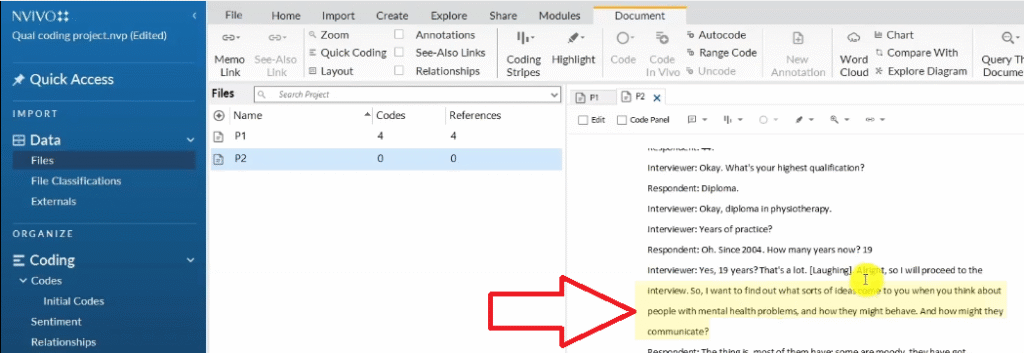
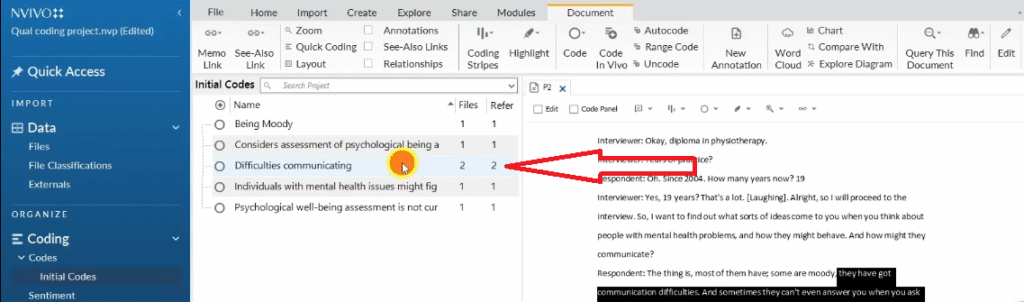
When you move to the second transcript, look for passages that express the same meaning as codes you’ve already created. Instead of making a new code, highlight that passage, then drag and drop it inside the existing code in the Codes panel. NVivo automatically updates the file and reference count.

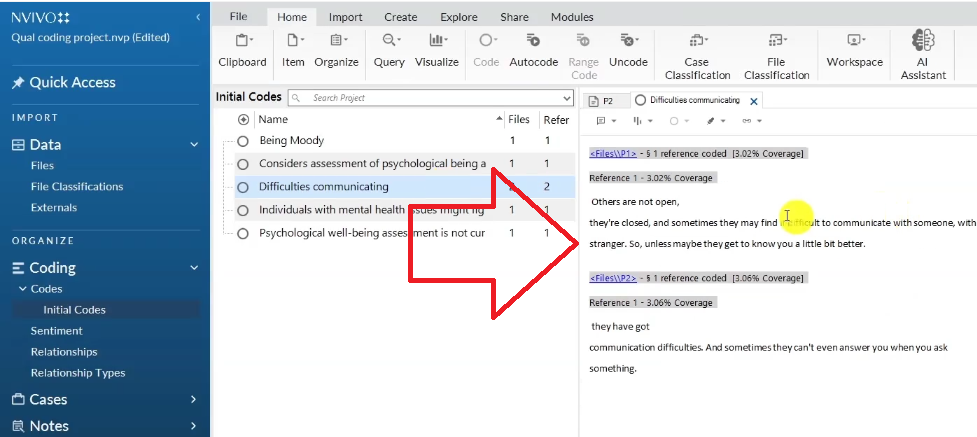
For example — when the second participant also mentions difficulties communicating, I drag that quote straight into the “Difficulties communicating” code. The counter updates from 1 file and 1 reference to 2 files and 2 references. If you double-click the code, you see both participant quotes side by side. That is your evidence base.

Second participant interview transcript open in NVivo for qualitative coding
Second participant transcript in NVivo with response about people with mental health problems
Passage about being moody highlighted in NVivo second transcript for qualitative coding
Red color-coded interview question in NVivo second transcript matching first question category
Existing difficulties communicating code visible in NVivo for drag and drop from second participant
NVivo files and references counter updated to 2 files and 2 references after drag and drop coding
Two participant quotes visible in NVivo after double-clicking the difficulties communicating code
Physiotherapist response about identifying psychological evaluation needs in NVivo transcript
Code "physiotherapists can determine whether stroke patients need psychological evaluation" created in NVivo
Code “physiotherapists can determine whether stroke patients need psychological evaluation” created in NVivo

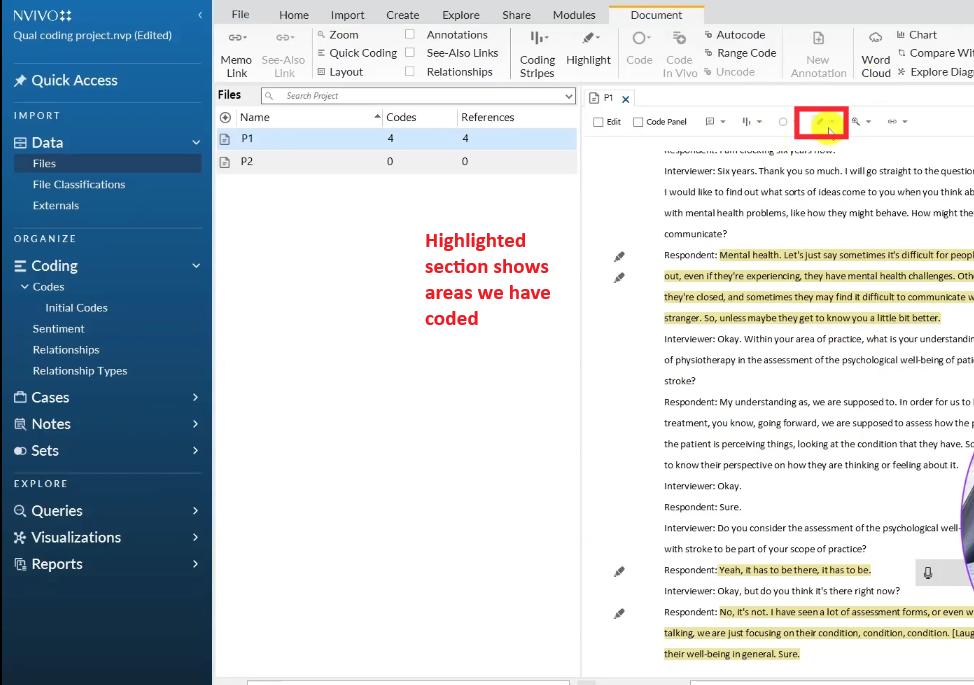
Key rule: Only code sections that are relevant to your research questions. NVivo tracks everything you code, so be selective and interpretive. We do not code everything — we code what matters.

Part 2 — How to Develop Themes from Your NVivo Codes

Moving from Codes to Themes: The Braun & Clarke Approach

Once your coding is complete, the next step is developing themes. If you’re using Braun and Clarke’s six-step thematic analysis framework, theme development is Step 3 — it comes after familiarizing yourself with the data and generating initial codes.

A theme is not a topic. A theme is a pattern of shared meaning across multiple codes. You’re looking for codes that — when grouped together — tell a coherent story in relation to your research questions.

I’ll demonstrate using a study on teachers’ challenges with alternatives to corporal punishment in secondary schools. I analyzed two interview transcripts and generated initial codes, color-coded by interview question.

Step-by-Step: Building Themes in NVivo

  1. In the Codes section, create a folder called “Preliminary themes” and copy all your initial codes into it
  2. Look at your color-coded codes — codes sharing the same color came from the same interview question and are likely related to the same theme
  3. Right-click in blank space → Create New Code → name it as a theme. Note: this is now a theme, not a code, even though NVivo stores them together
  4. Drag all related codes into the theme. These codes become the evidence base for that theme
  5. Write a description for each theme — 1 to 2 sentences explaining what the theme represents. This is the analytical memo that will later become your findings write-up
  6. Repeat until you have 3 to 7 well-defined, distinct themes

In this study, the five themes that emerged were:

  • Stakeholders involved in disciplining learners
  • Teachers’ views on the effectiveness of corporal punishment
  • Common cases of indiscipline in school
  • Causes of indiscipline among learners
  • Strategies teachers use to discipline learners in schools
NVivo screenshot showing revised qualitative codes related to school discipline, used for identifying themes in data analysis.

Colour Coded Codes

Preliminary themes folder created in NVivo codes section to organize codes during theme development
Dark red color-coded qualitative codes in NVivo — grouped by interview question for theme development
Creating a new theme in NVivo on teachers’ views about the effectiveness of corporal punishment in qualitative analysis.
Theme “teachers views on effectiveness of corporal punishment” created in NVivo during qualitative thematic analysis
Theme "teachers views on effectiveness of corporal punishment" in NVivo with its supporting qualitative codes
Theme “teachers views on effectiveness of corporal punishment” in NVivo with its supporting qualitative codes
NVivo theme description for teachers views on corporal punishment — qualitative thematic analysis findings
Dark blue color-coded qualitative codes in NVivo representing common cases of indiscipline in school
Theme "common cases of indiscipline in school" created in NVivo during qualitative thematic analysis
Theme “common cases of indiscipline in school” created in NVivo during qualitative thematic analysis
NVivo theme description for common cases of indiscipline in school — written during qualitative analysis
Light blue color-coded qualitative codes in NVivo representing causes of learners indiscipline
Theme "causes of indiscipline among learners" created in NVivo during qualitative thematic analysis
Theme “causes of indiscipline among learners” created in NVivo during qualitative thematic analysis
NVivo theme description for causes of indiscipline among learners according to teachers in the study
Purple color-coded qualitative codes in NVivo representing strategies teachers use to discipline learners
Theme "strategies teachers use to discipline learners in schools" created in NVivo thematic analysis
Theme “strategies teachers use to discipline learners in schools” created in NVivo thematic analysis
NVivo theme description: different strategies teachers use to discipline learners in public schools
Brown color-coded qualitative codes in NVivo representing stakeholders involved in disciplining learners
Theme "stakeholders involved in disciplining learners" created in NVivo qualitative thematic analysis
Theme “stakeholders involved in disciplining learners” created in NVivo qualitative thematic analysis
NVivo theme description: stakeholders involved in disciplining learners in public schools
Five final themes displayed in NVivo after completing qualitative thematic analysis of interview data

Important: When grouping codes into themes, some codes will not fit neatly anywhere. Do not force them. Leave them in a “miscellaneous” folder or discard them. Your themes should have clear, defensible shared meaning — not be a catch-all.

To see how theme development works using Saldana’s inductive approach instead of Braun and Clarke, I cover that in detail in my guide on inductive thematic analysis using NVivo.

Part 3 — How to Write Up Your Findings from NVivo

What a NVivo Findings Report Contains

Once you have your themes, the next step is writing the findings chapter. If you’re new to qualitative research and unsure how to plan your interviews before analysis, my guide on how to conduct a qualitative research interview is a good starting point.

A qualitative findings report has two main sections:

  1. The data analysis process — a description of the steps you used to go from raw transcripts to themes. If you used Braun and Clarke’s inductive approach, you describe all six steps: familiarization, generating initial codes, searching for themes, reviewing themes, defining and naming themes, and producing the report.
  2. The findings discussion — a theme-by-theme write-up supported by participant quotes as evidence.
Data analysis process section in qualitative findings report showing steps from raw transcripts to themes
Table in qualitative findings report showing initial codes and emerging themes from NVivo analysis

Exporting Your Data from NVivo

NVivo gives you several ways to export your analysis for use in your report:

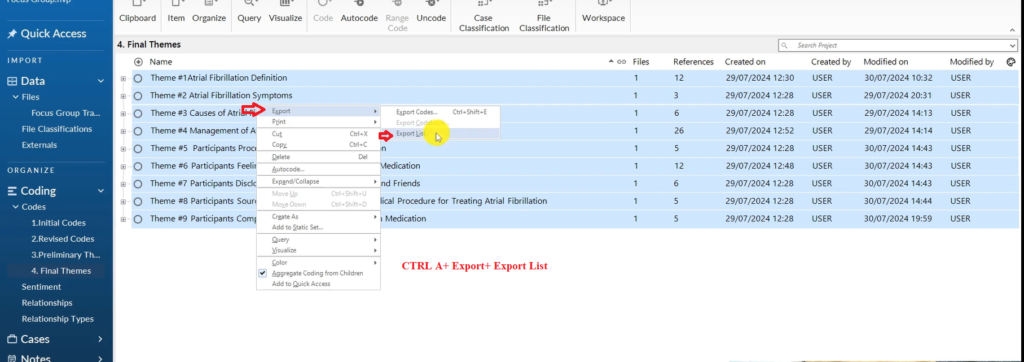
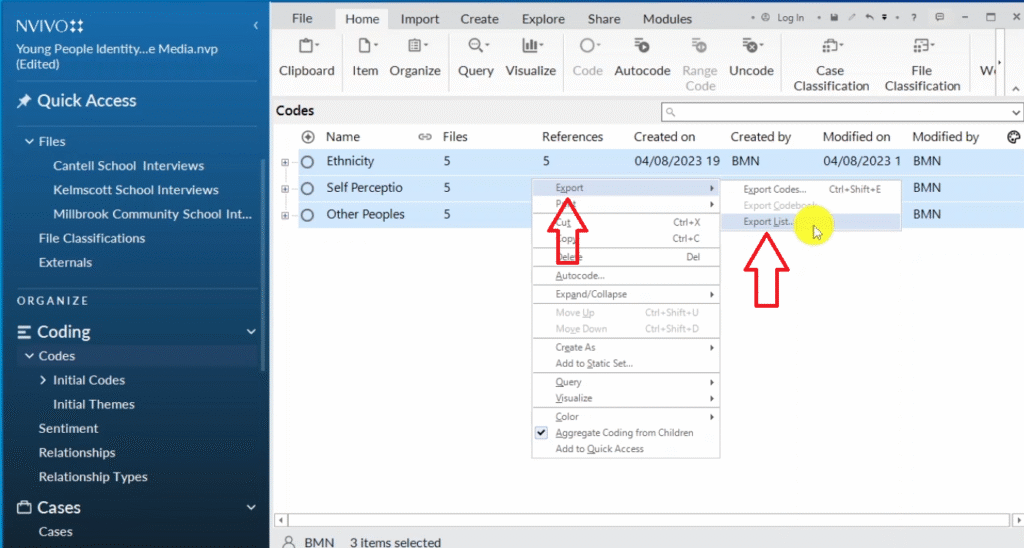
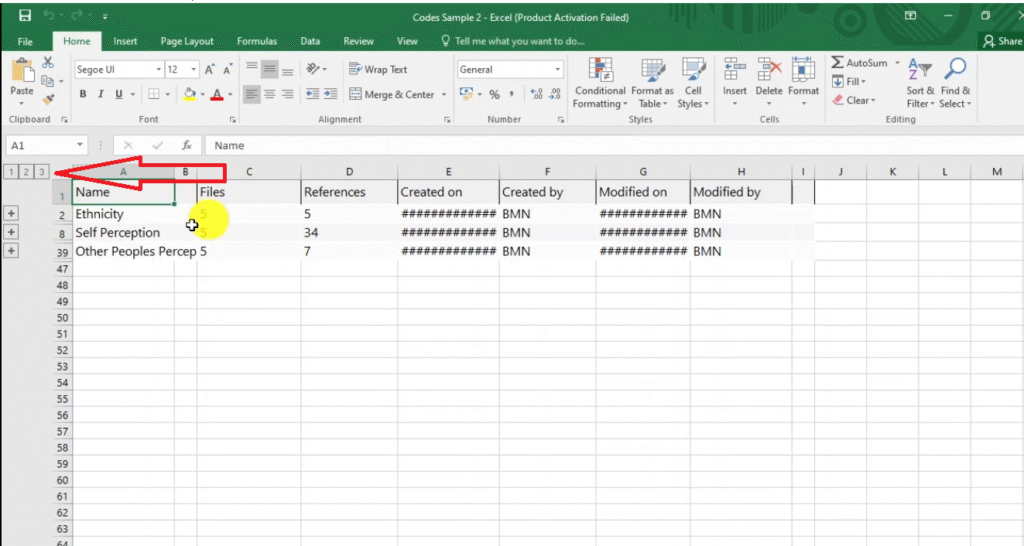
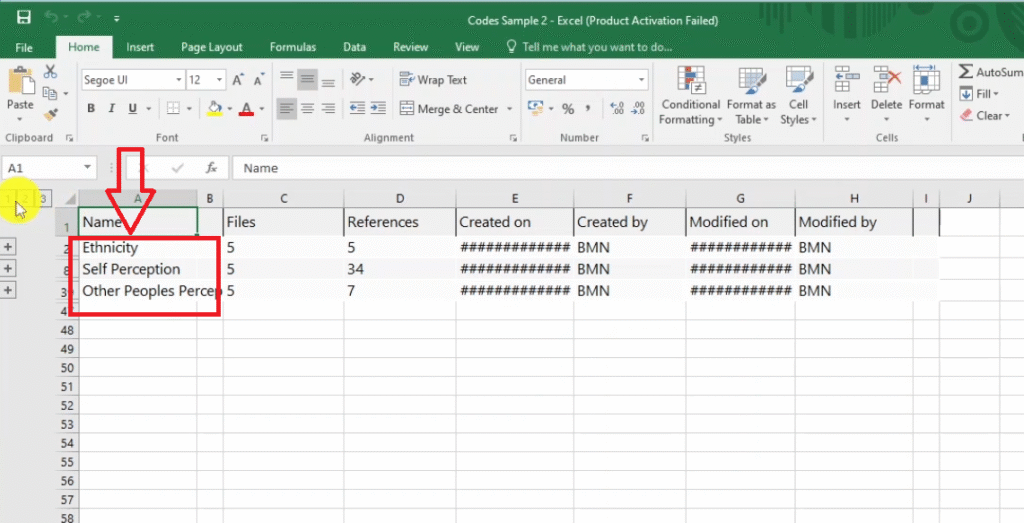
  • Export theme list: Select all themes → Ctrl+A → right-click → Export → Export List. This gives you an Excel file with all themes, codes, file counts, and reference counts.
  • Export codebook: Go to Share → Export → Export Codebook. This exports your full coding structure with theme descriptions, subthemes, and codes — ready for your dissertation appendix.
  • Participant quotes: Double-click any theme or code to access the exact participant quotes it contains. Copy these into your report as direct evidence, formatted in italics.
Exporting final themes list in NVivo using right-click export list menu during qualitative data analysis
Exported NVivo themes displayed in Excel with references, file counts, and timestamps
Exporting codebook in NVivo with participant references and theme descriptions displayed

How to Structure Your Findings Write-Up

For each theme in your findings chapter:

  1. Introduce the theme and explain what it represents (this is where your theme description from NVivo becomes your opening paragraph)
  2. Present the supporting codes and explain what they show about the theme
  3. Provide participant quotes in italics as direct evidence — these are the voices of your research participants
  4. Interpret what the theme means in relation to your research question

Include NVivo visualizations where they add clarity to your write-up. Hierarchy charts and mind maps work particularly well as figures in findings chapters — you’ll see how to create both in Part 4 below. For a comparison of how NVivo and other tools handle the analysis and reporting process, see my guide on qualitative analysis of interviews with ATLAS.ti.

Theme 1 description written in NVivo findings report: definition and meaning of the first qualitative theme
Participant quotes in NVivo theme analysis showing evidence from interview transcripts supporting qualitative themes
Hierarchy chart in NVivo showing coded themes and subthemes from qualitative interview analysis
Mind map in NVivo illustrating Theme 2 with subthemes and supporting codes from qualitative analysis

Part 4 — 9 Ways to Visualize Your Qualitative Data in NVivo

1. Word Clouds

NVivo offers powerful visualization tools that can strengthen both your analysis and your findings report. Here are all nine methods available in NVivo 14 and NVivo 15.

Word cloud created in NVivo 14 showing most prominent words and themes from participant interview

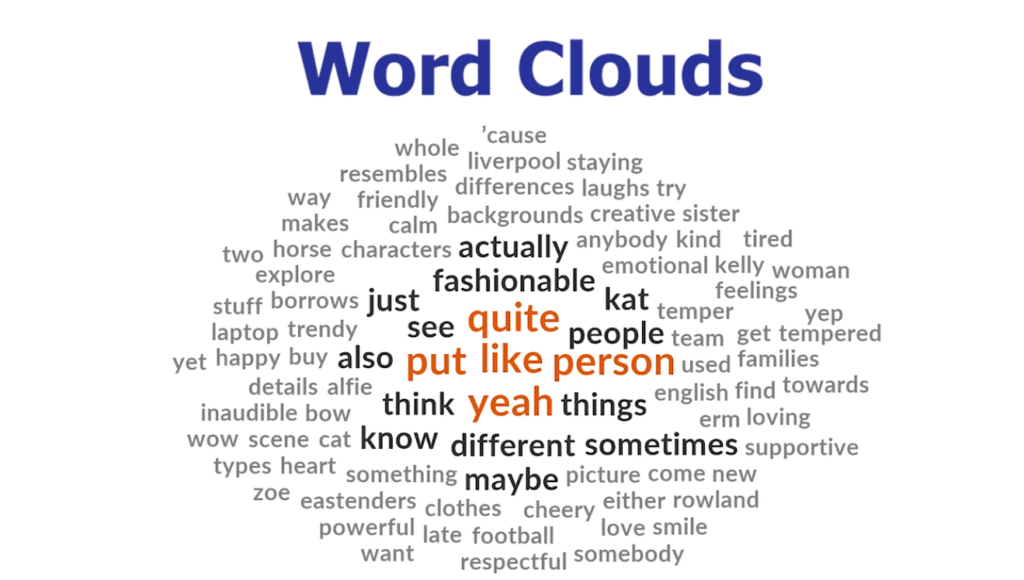
A word cloud shows the most frequently used words by a participant or across your whole dataset. To generate one for a specific participant:

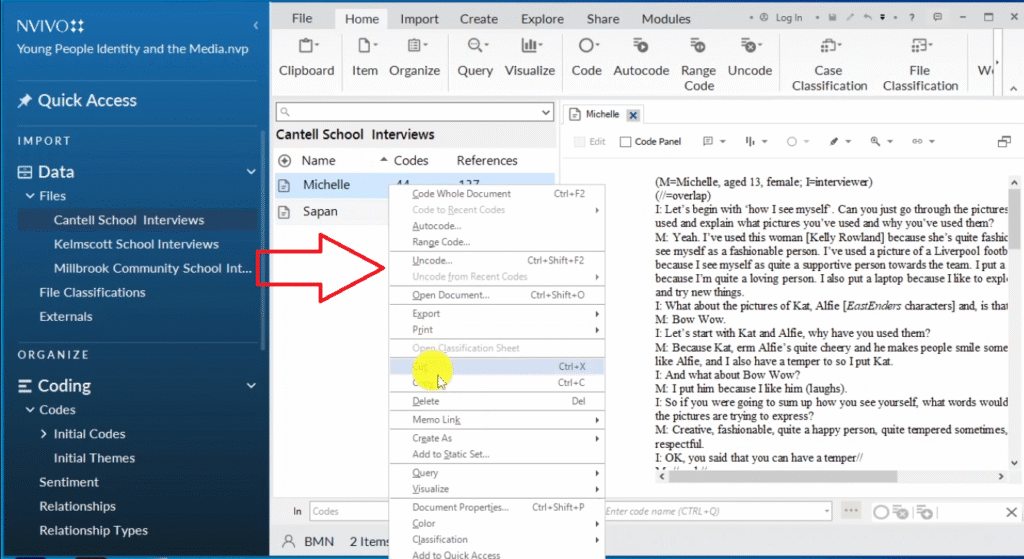
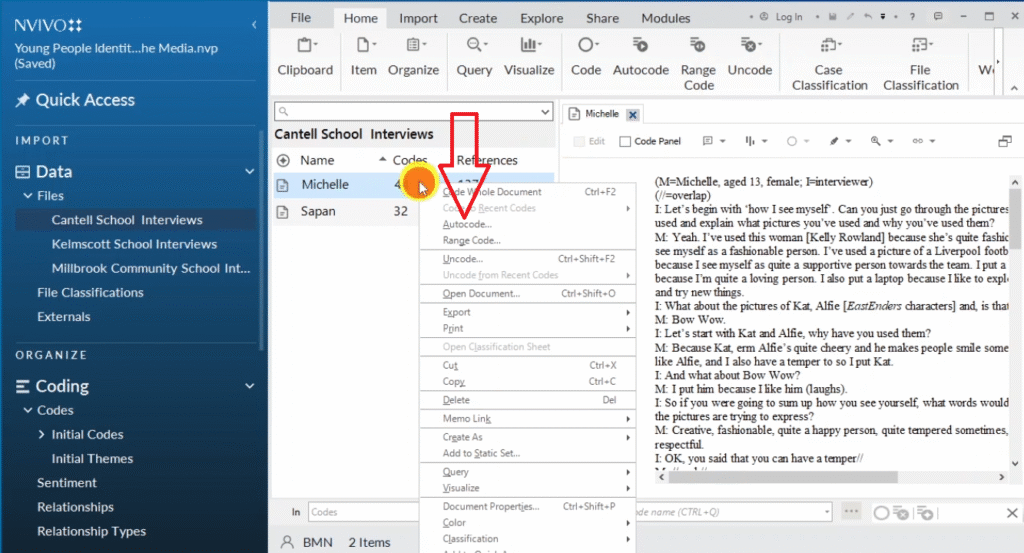
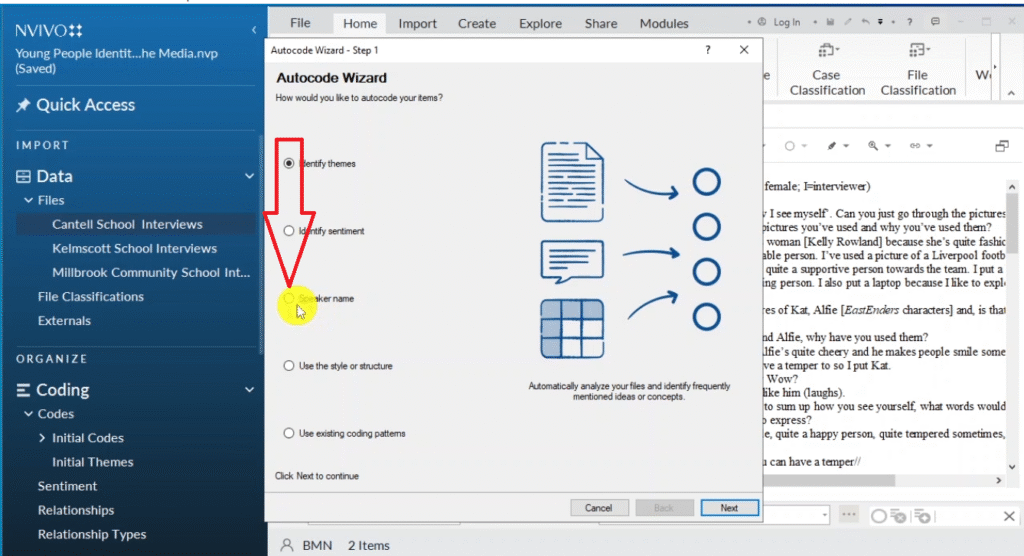
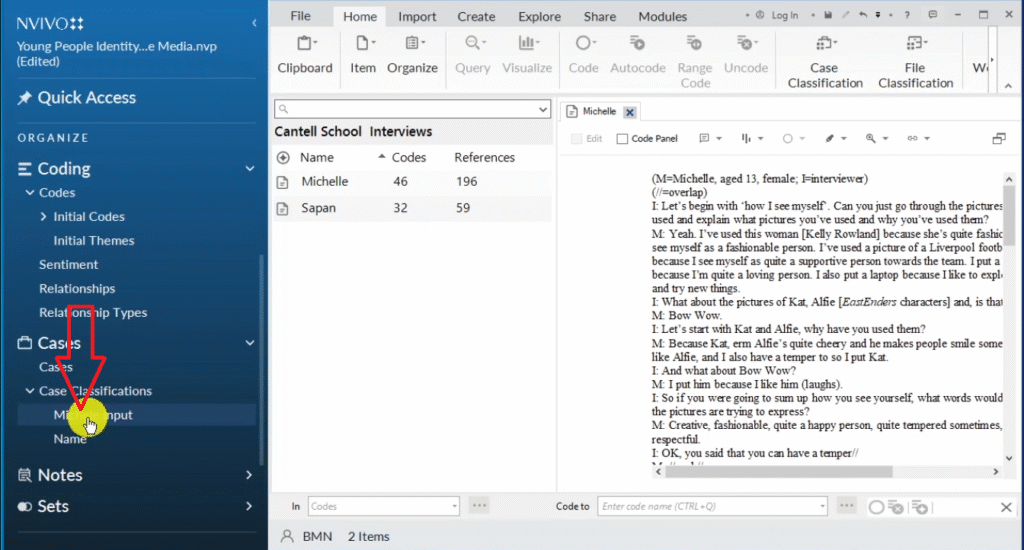
  1. Right-click the participant’s transcript → Auto Code → select Speaker Name
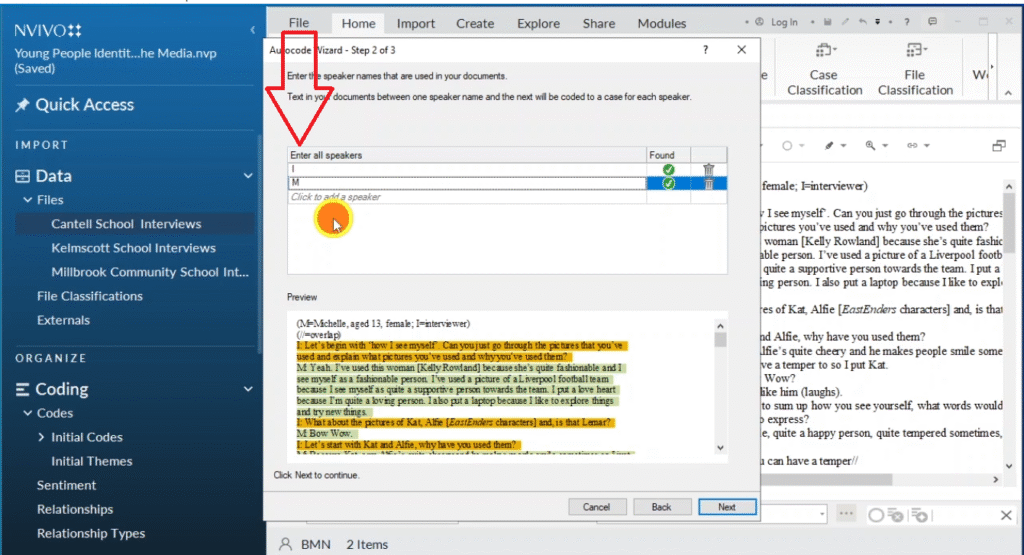
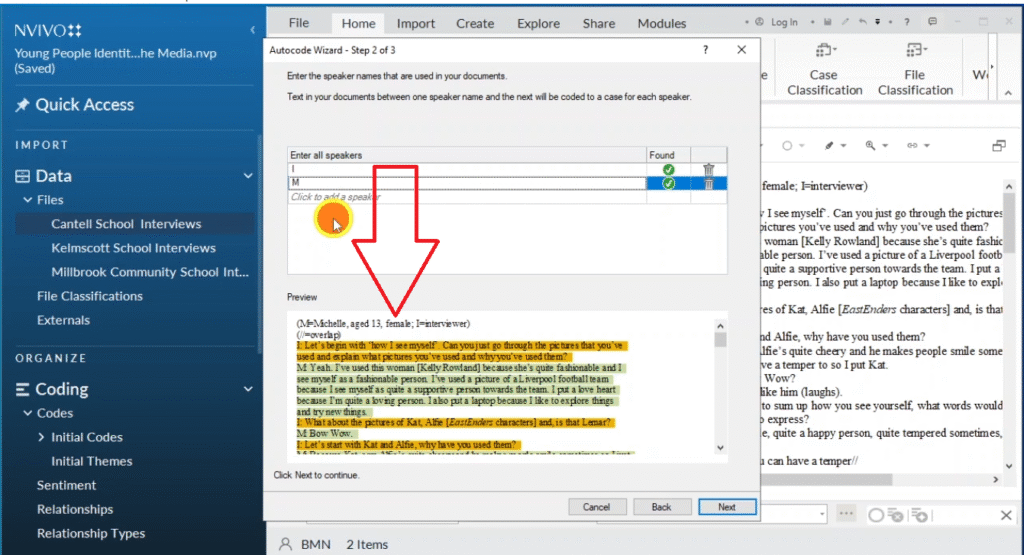
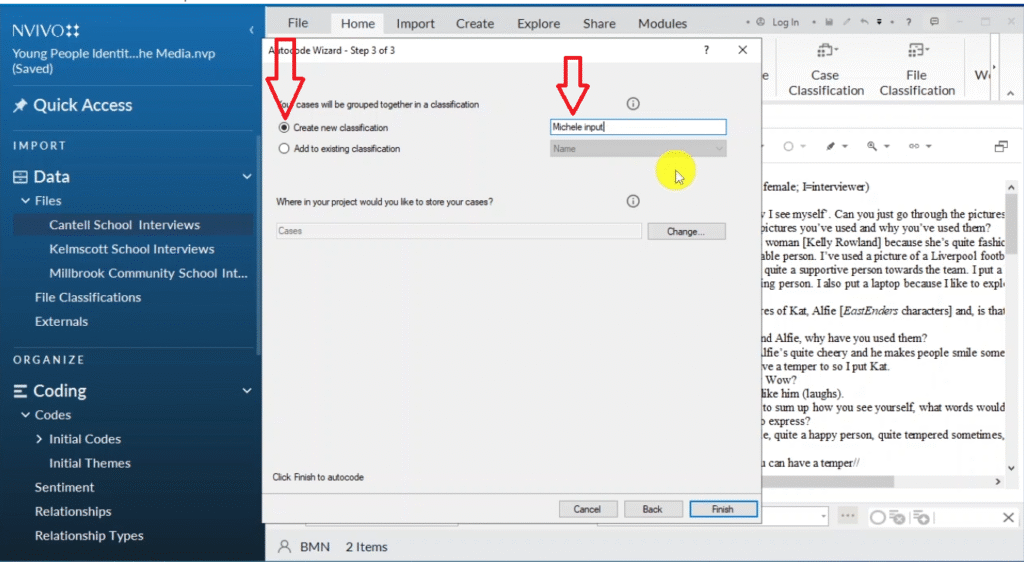
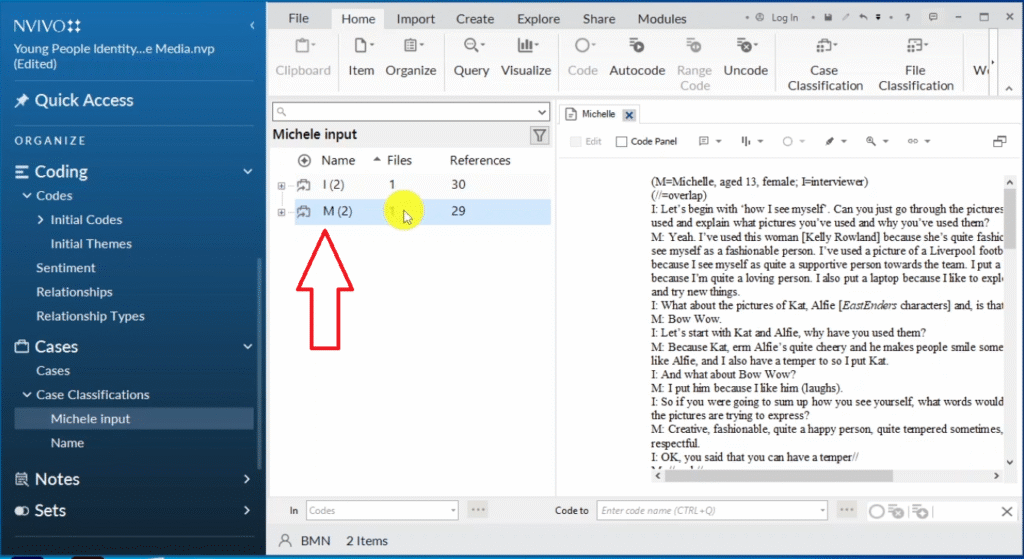
  2. Insert the speaker initials (e.g. I for interviewer, M for Michelle) → Next → create a new case classification (e.g. “Michelle input”) → Finish
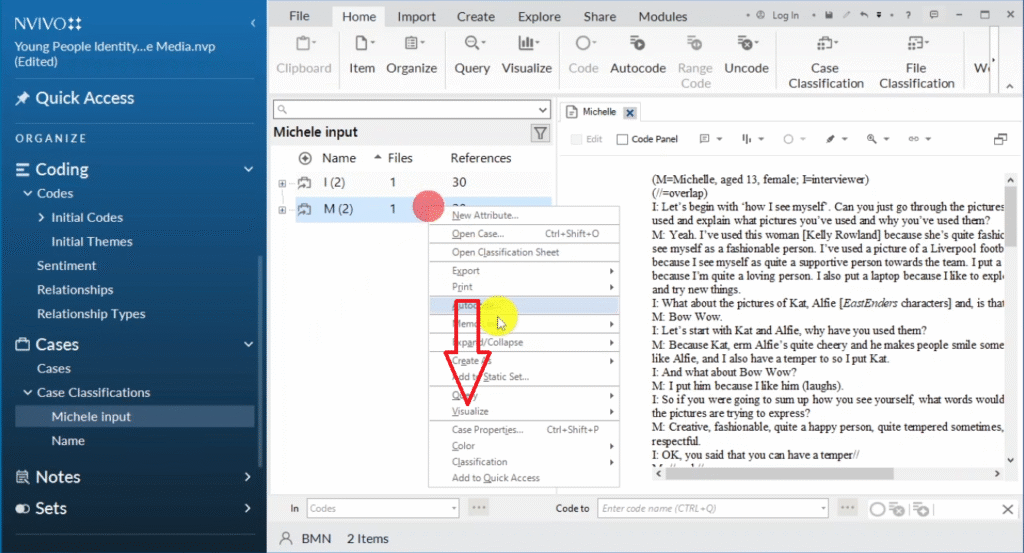
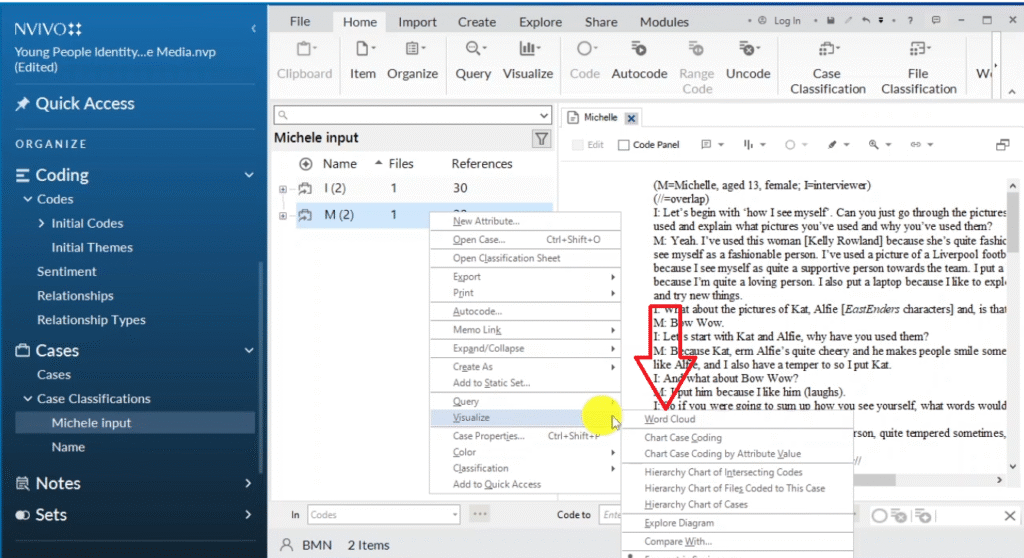
  3. Go to Case Classifications in the left menu → right-click Michelle → Visualize → Word Cloud
  4. Export with Ctrl+Shift+E
Right-click on transcript in NVivo to access auto code by speaker name option
Auto code icon selected in NVivo to automatically identify and separate speakers in interview transcript
Speaker name option selected in NVivo auto code for identifying interviewer and participant
Initials I and M inserted in NVivo auto code dialog to identify interviewer and participant Michelle
NVivo identifying interviewer (I) and participant (M) marked in different shades in interview transcript
New case classification dialog in NVivo named Michelle input for separating participant data for word cloud
Case classification panel visible in NVivo left menu after auto coding by speaker name
Michelle input case visible in NVivo case classifications panel for word cloud generation
Two cases created in NVivo: Michelle and interviewer for separate participant word cloud analysis
Visualize option in NVivo right-click menu on Michelle case for generating word cloud
Word cloud icon selected in NVivo visualization menu for generating Michelle participant word cloud
Word cloud generated in NVivo 14 showing prominent words from Michelle interview including fashionable, temper, feelings

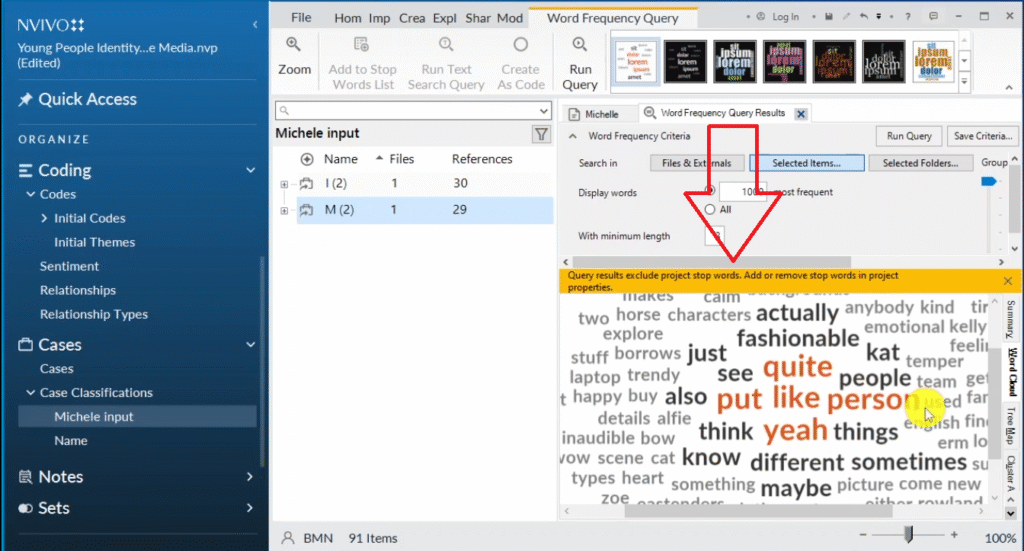
The resulting word cloud shows what that participant talked about most. In my example, Michelle’s word cloud prominently features words like fashionable, temper, feelings, and emotional. This kind of visualization works well as a figure in your methodology chapter.

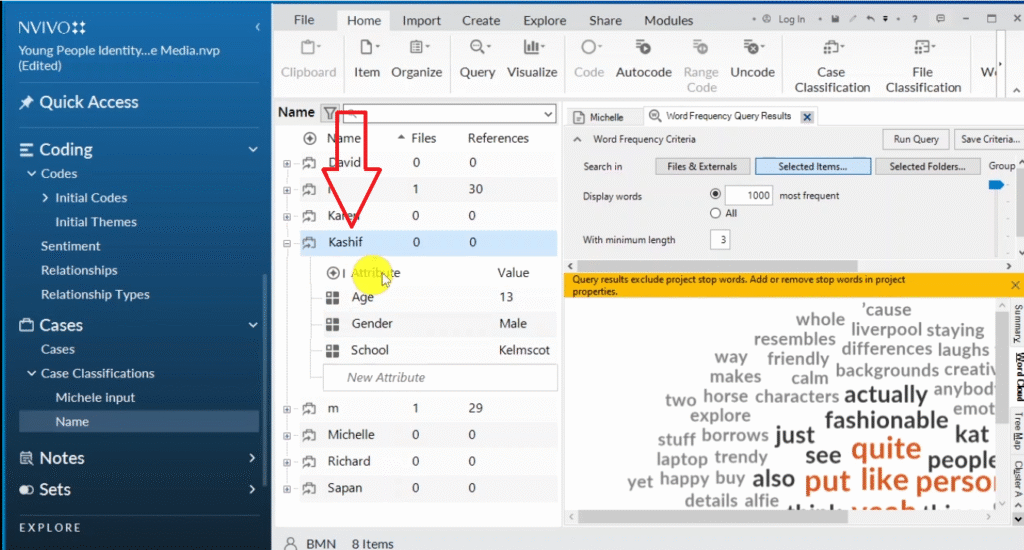
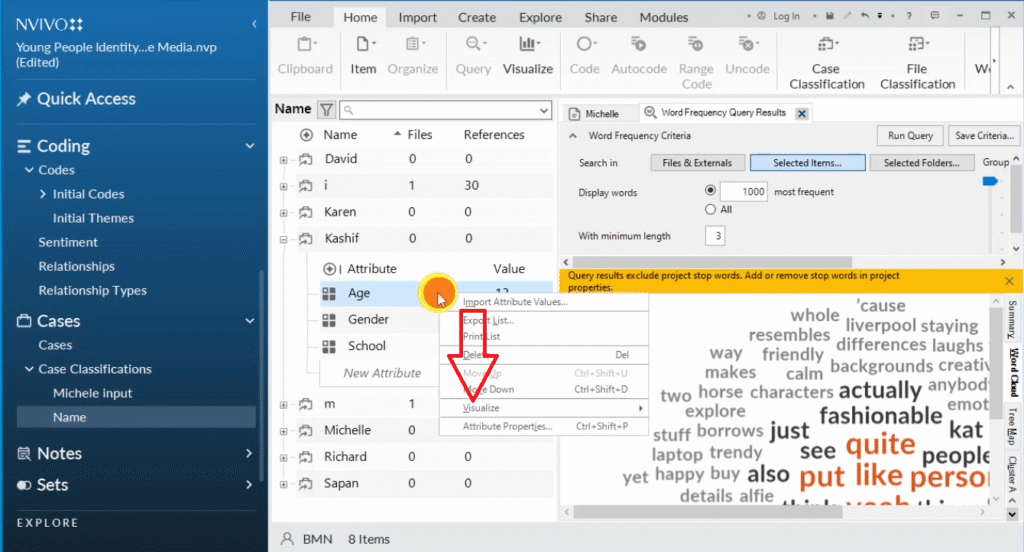
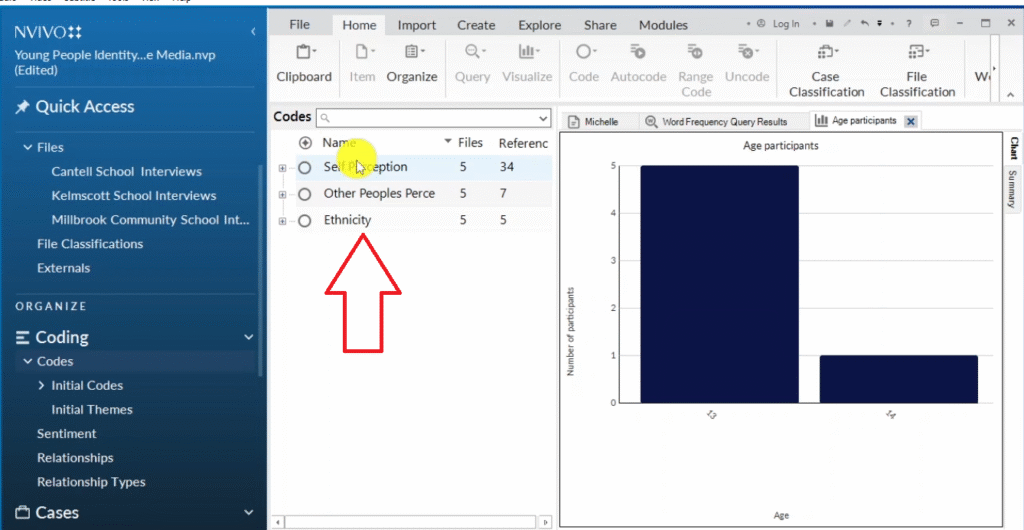
2. Regular Charts (Demographic Data)

Regular charts visualization option in NVivo 14 for displaying demographic participant data

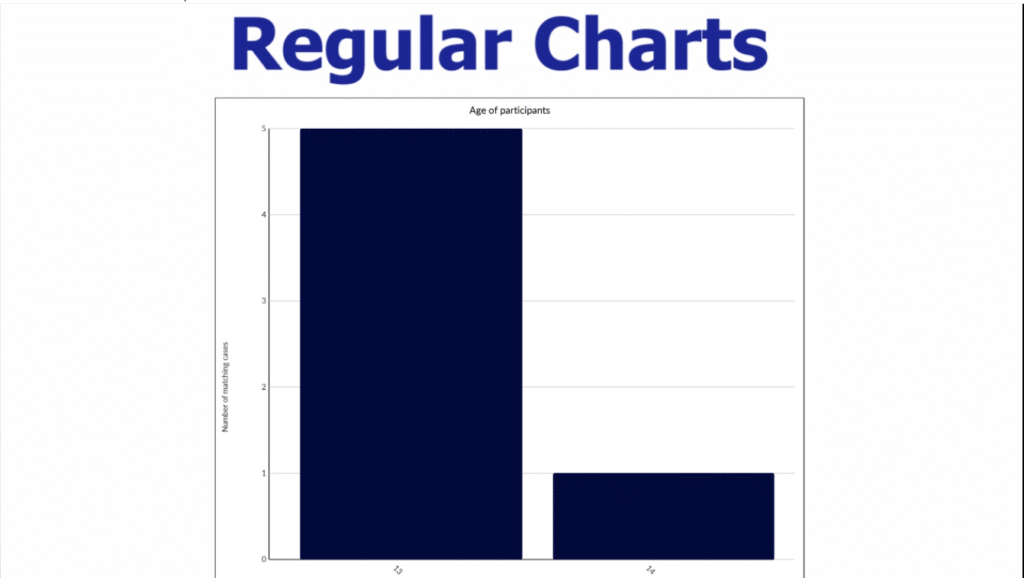
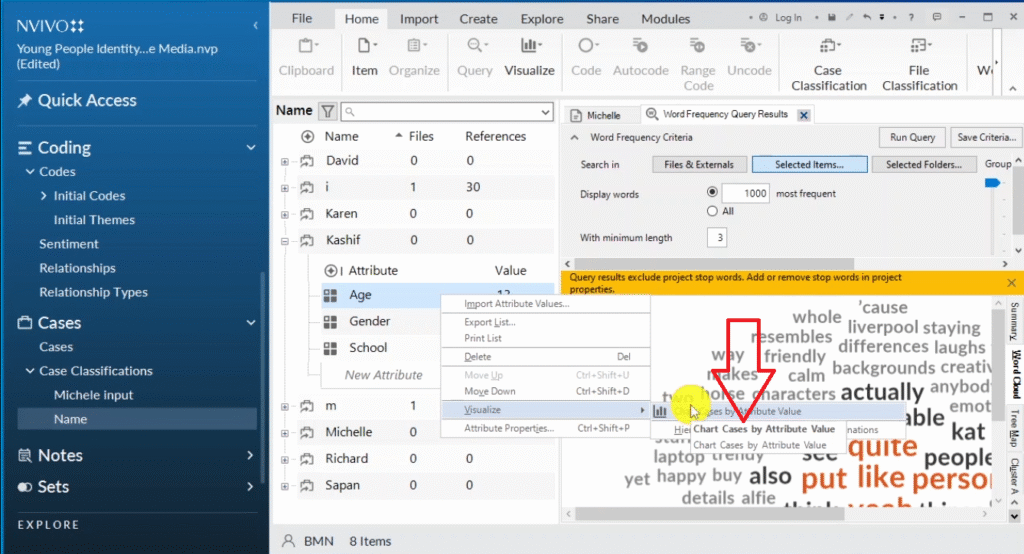
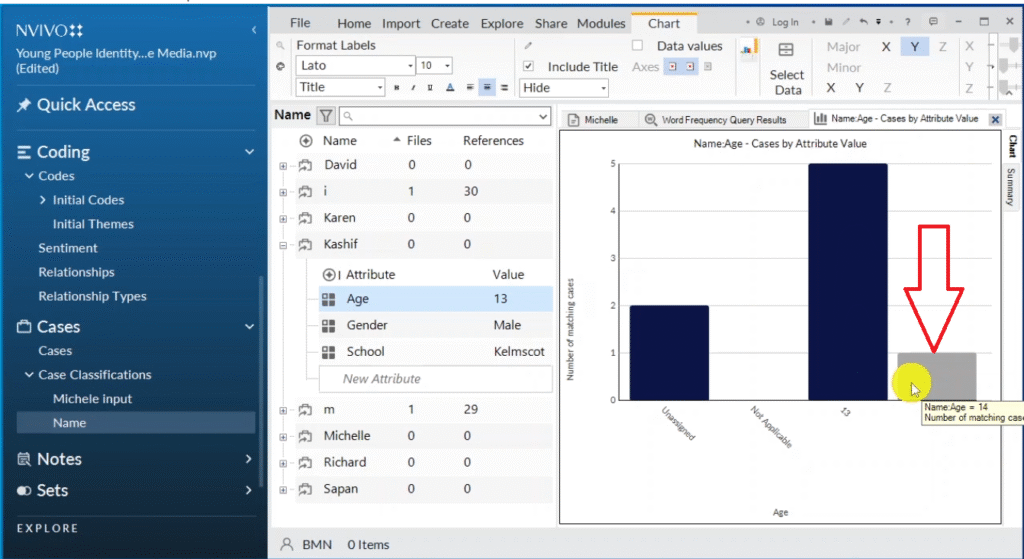
Use regular charts to visualize demographic data you collected from participants — age, gender, education level, and so on. Right-click any participant → Visualize → Chart Cases by Attribute Value.

If your chart shows “unassigned” or “not applicable” values, right-click the chart → Select Data → on the X-axis attribute, choose “All attributes except unassigned and not applicable” → click OK. This gives you a clean, professional chart.

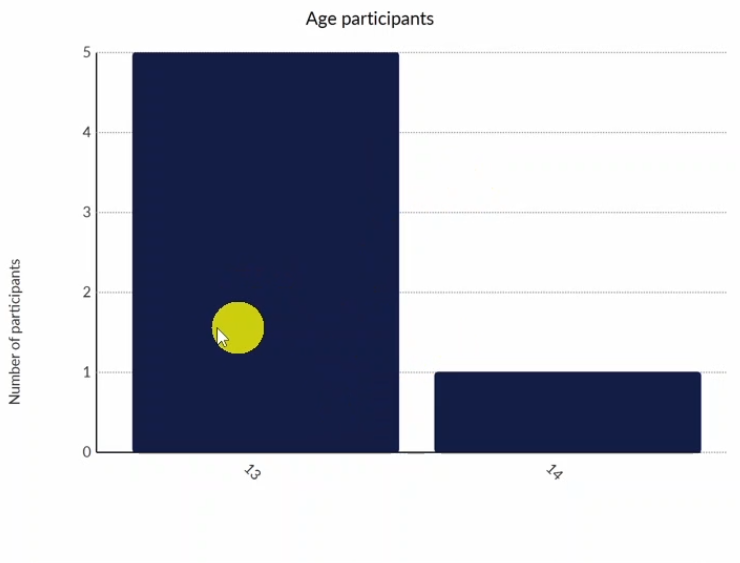
Rename the axis labels (right-click → Edit Labels) to plain English: “Age of participants” instead of “name, age” and “Number of participants” instead of “number of matching cases.” Export with Ctrl+Shift+E.
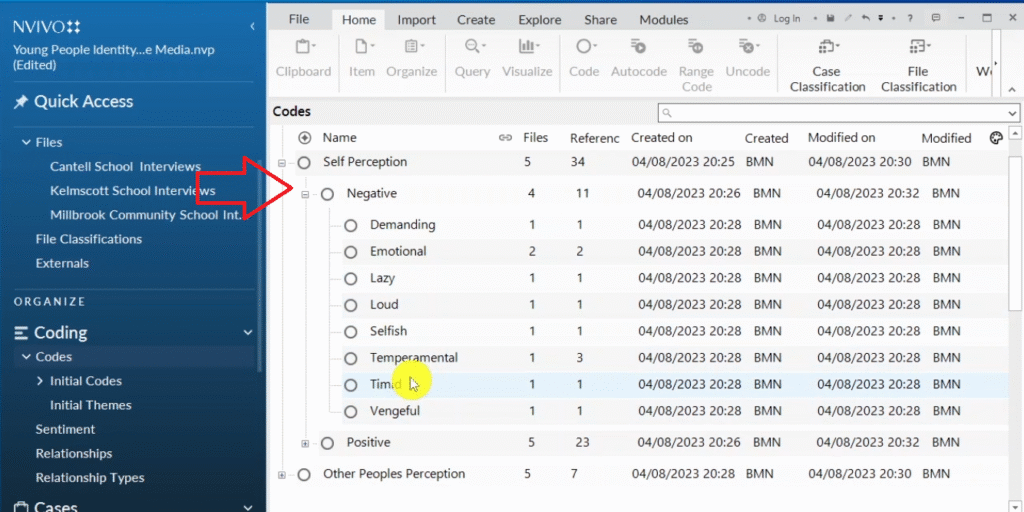
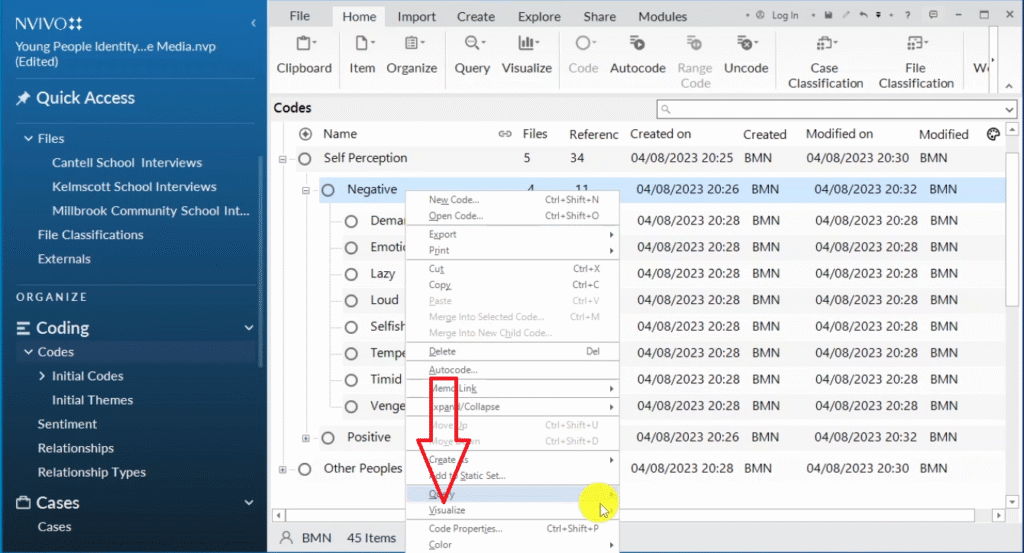
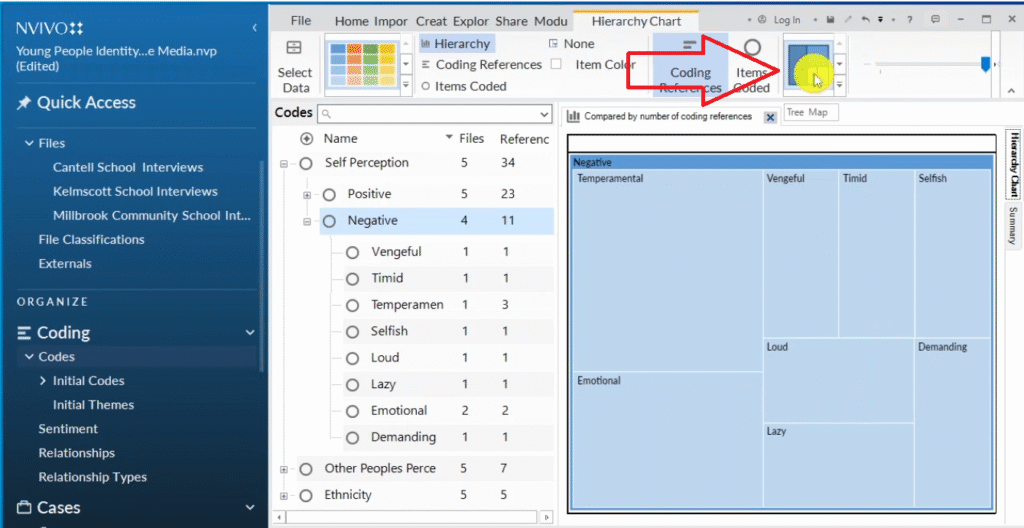
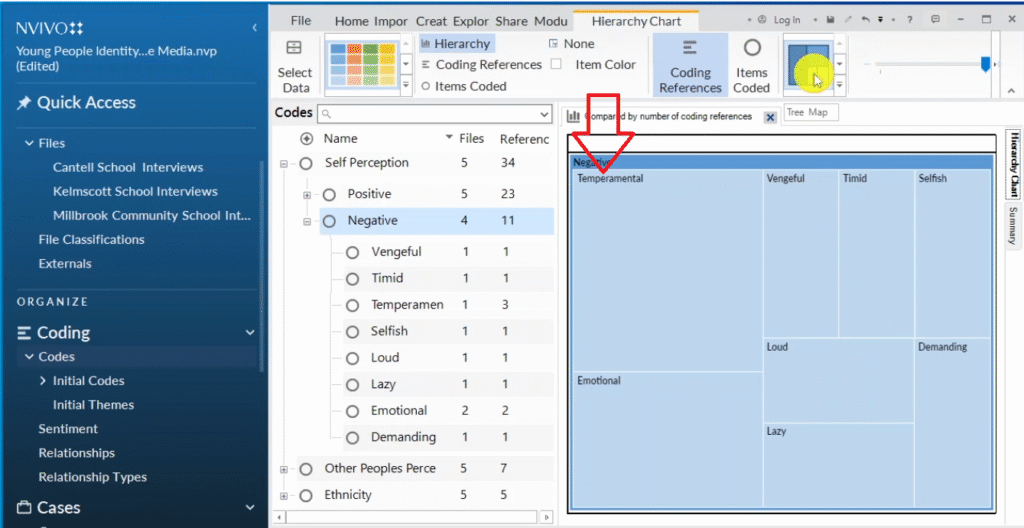
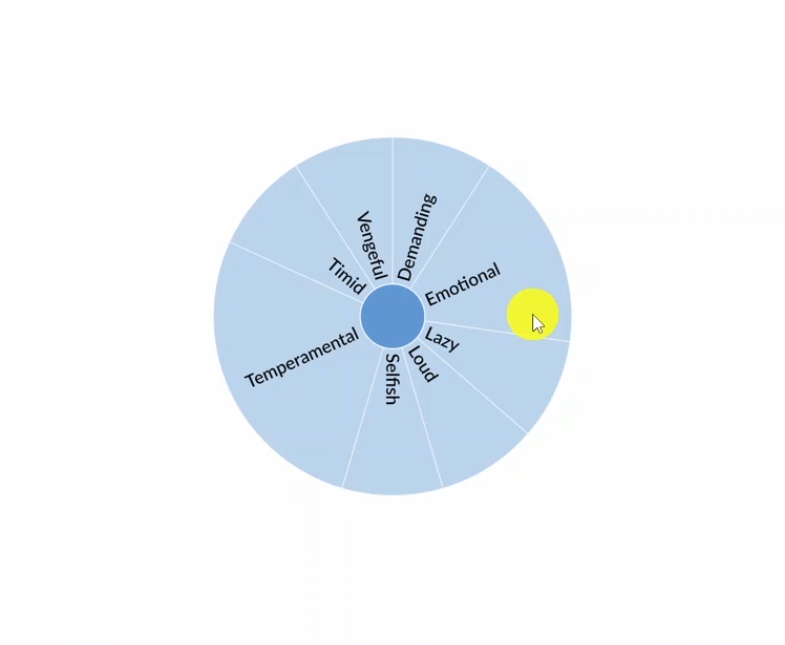
Demographic data imported into NVivo case classifications panel for regular chart visualization
Visualize option right-clicked on participant in NVivo for creating chart from demographic data
Chart cases by attribute value option selected in NVivo for visualizing participant age data
Regular chart in NVivo showing participant age distribution including unassigned values
Exported demographic chart from NVivo showing age distribution: 5 participants aged 13 and one aged 14

3. Hierarchy Charts

Hierarchy chart visualization option in NVivo 14 for displaying code and theme structure

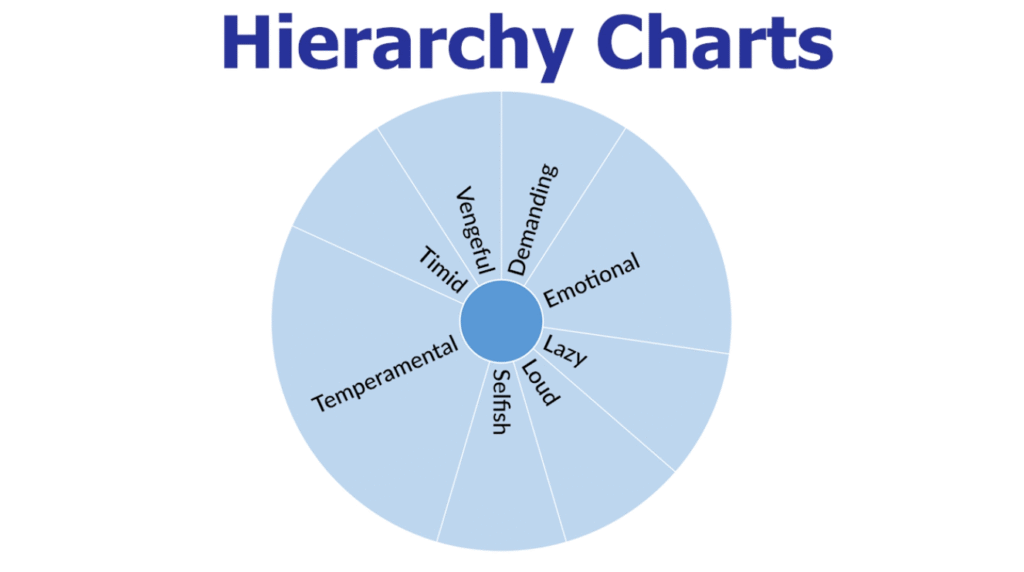
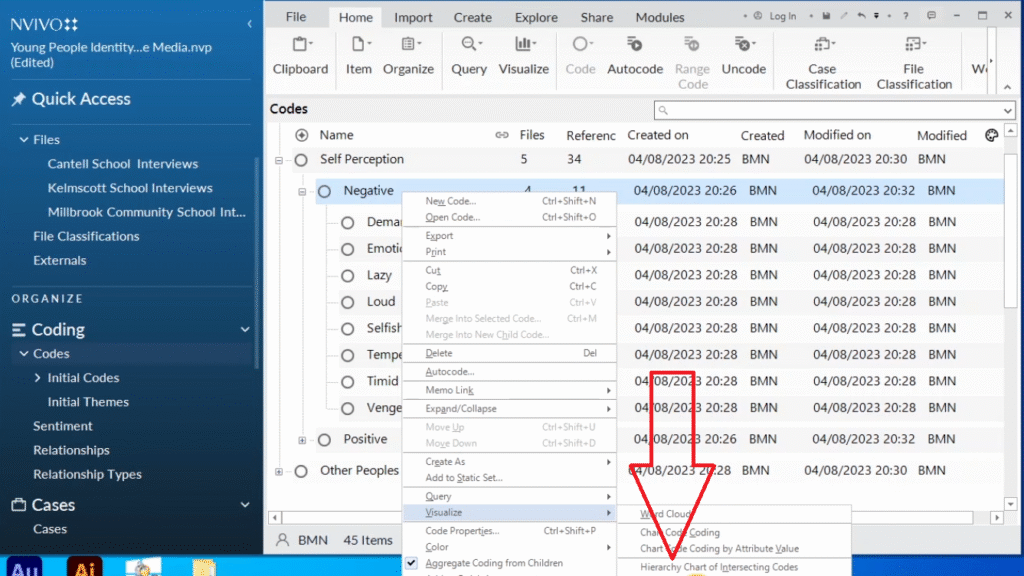
Hierarchy charts show the relative weight of each code within a theme — how much data was attributed to each code. Right-click a subtheme → Visualize → Hierarchy Chart of Codes.

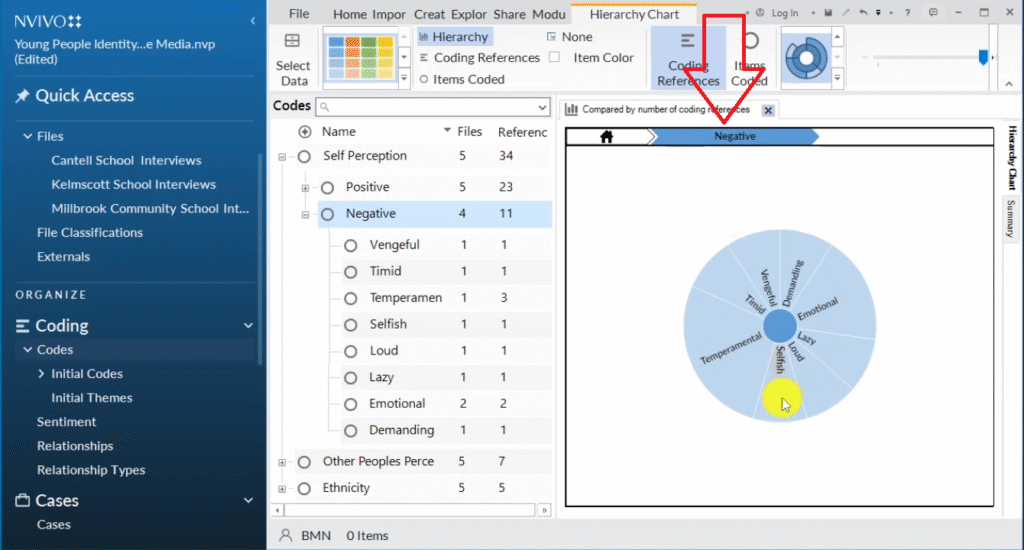
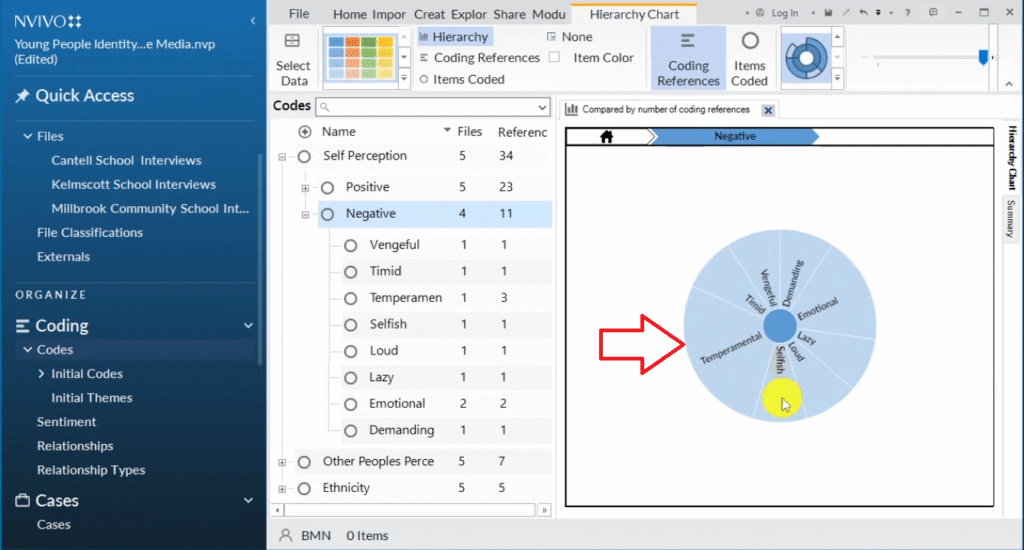
You get two views: the tree map and the sunburst. The sunburst is my preference. In my reflexive thematic analysis example, the sunburst clearly shows that the code “temperamental” has far more references than the others under self-perception. That’s not a value judgment — it means more participant data was coded to that concept. Export with Ctrl+Shift+E.

Three themes from reflexive thematic analysis displayed in NVivo codes panel
Self-perception theme in NVivo showing negative sub-theme and associated qualitative codes
Visualize option right-clicked on sub-theme in NVivo for generating hierarchy chart of codes
Hierarchy chart of codes option selected in NVivo visualization menu
Tree map in NVivo hierarchy chart showing code distribution with temperamental most prevalent
NVivo tree map showing codes under self-perception theme with temperamental code taking largest area
Sunburst chart in NVivo showing distribution of codes under self-perception theme by reference count
NVivo sunburst chart showing temperamental code has most references under self-perception theme
Exported hierarchy chart from NVivo showing code distribution for self-perception reflexive thematic analysis

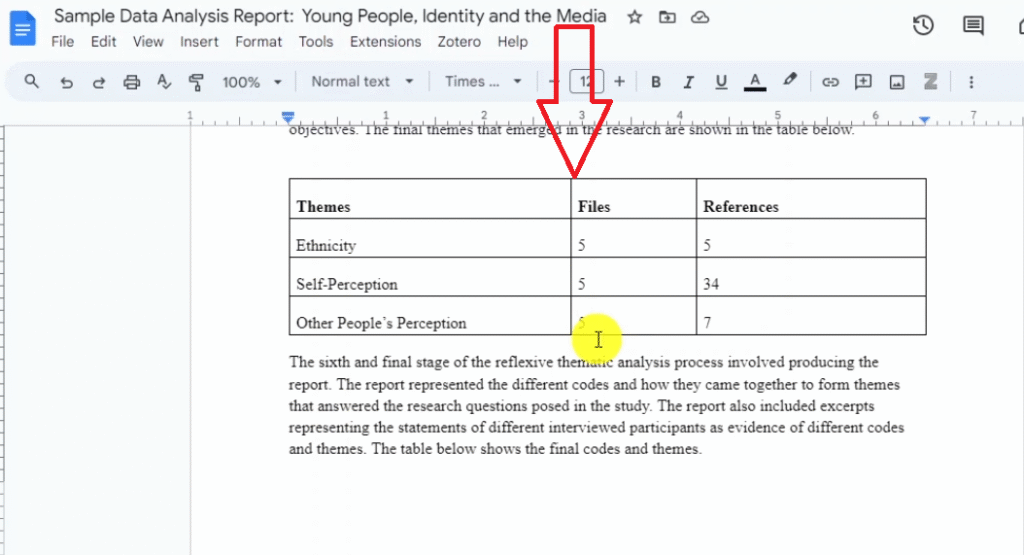
4. Tables and Bar Charts

Tables visualization in NVivo 14 — fourth method for displaying qualitative data analysis results

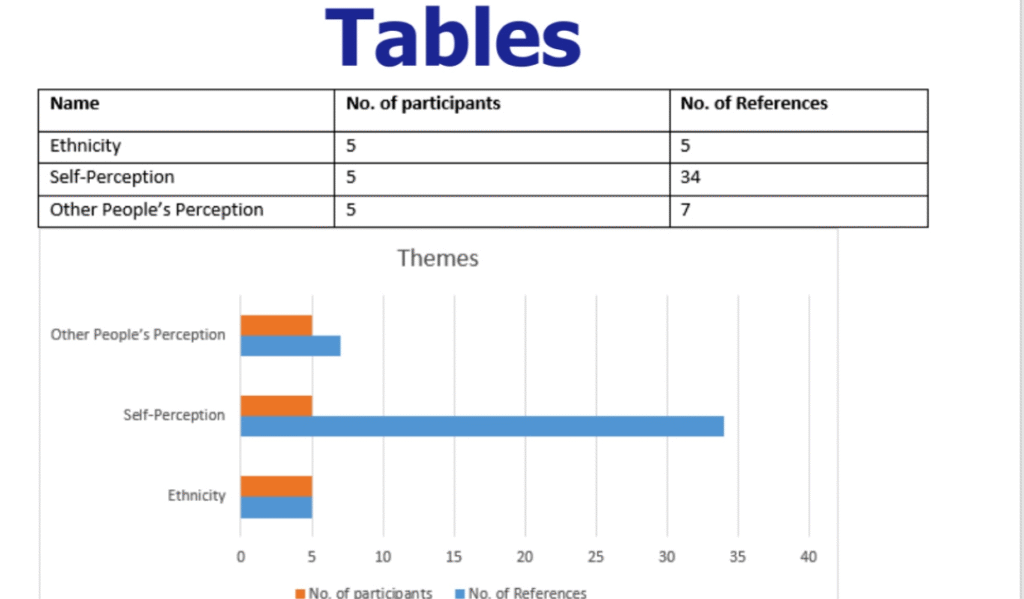
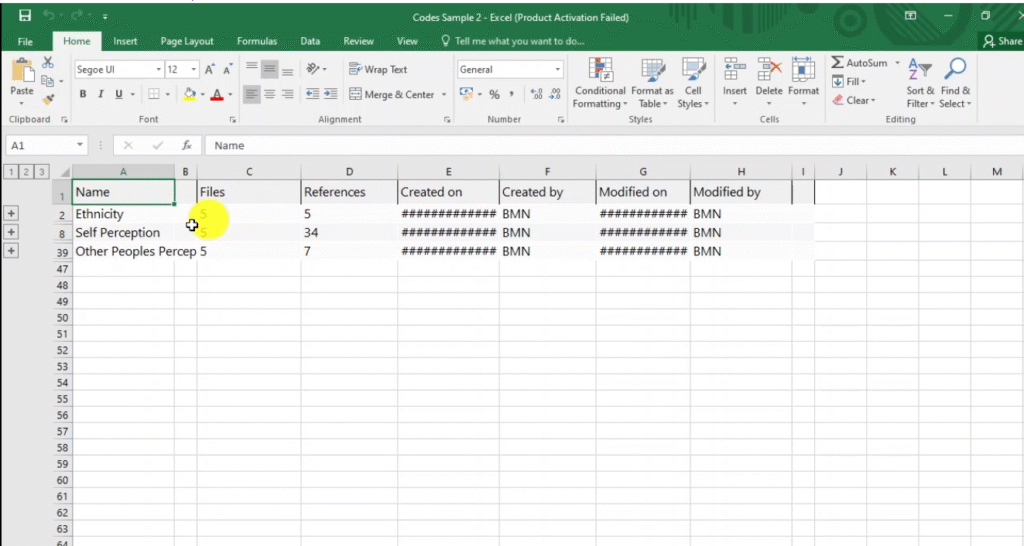
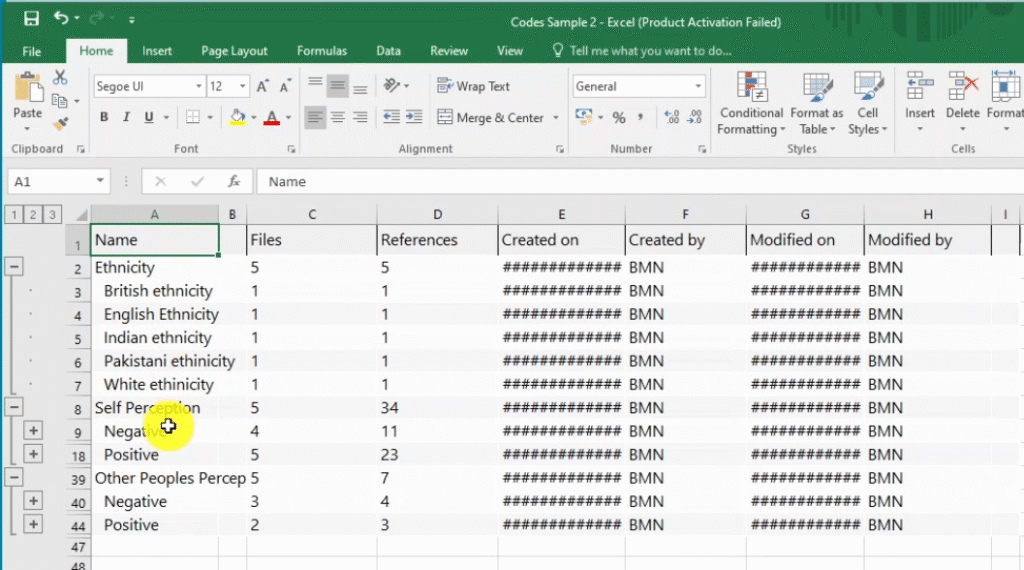
To create a table from your NVivo data, select all themes (Ctrl+A) → right-click → Export → Export List. This gives you an Excel file with your full coding structure, including file counts and reference counts.

The numbers in the Excel export mean: 1 = major themes, 2 = subthemes and codes. The Files column shows how many participants were coded to each theme. The References column shows how many quotes support each theme.

Copy this table into Word for your appendix. To create a bar chart from it, go to Insert → Charts → Bar → OK. An Excel pop-up appears. Paste your theme names into the category column, rename “files” to “number of participants” and “references” to “number of references,” paste your data, and close the Excel window. NVivo’s exported data now drives a professional bar chart in your findings report
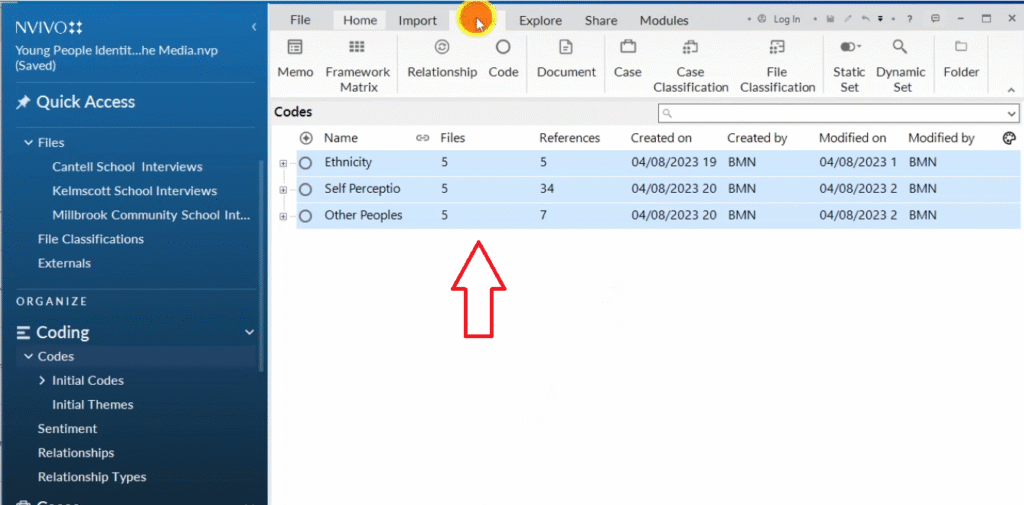
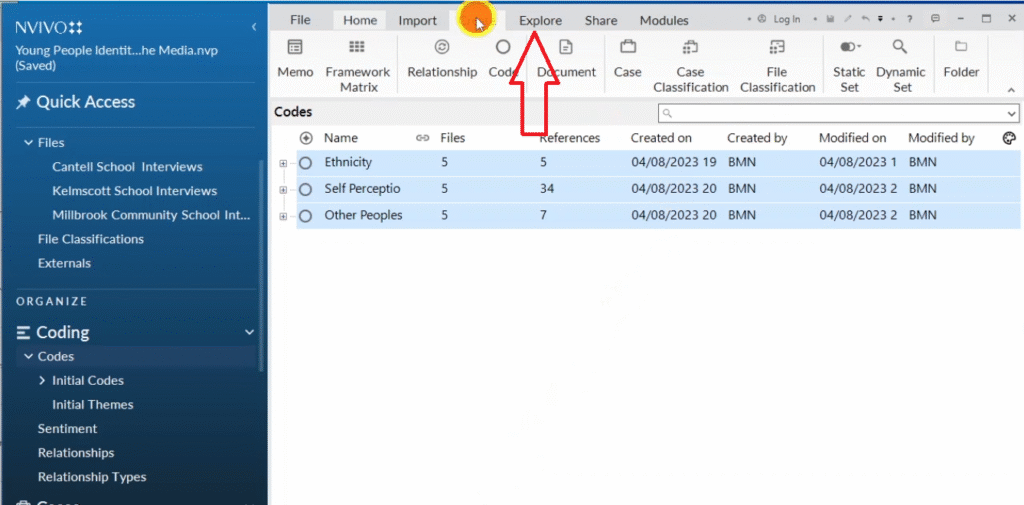
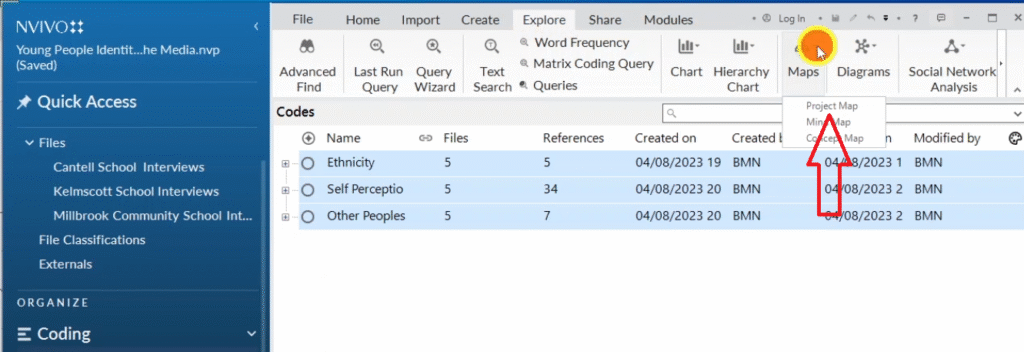
All themes selected in NVivo for export to Excel using export list function
Excel file exported from NVivo containing all codes and themes with reference counts
Numbers in NVivo Excel export: 1 = major themes, 2 = subthemes and codes
Major themes labeled as number 1 in NVivo Excel export table for findings report
Themes subthemes and codes labeled as number 2 in NVivo Excel export
Table in qualitative findings report drawn from NVivo Excel export showing theme and code structure

5. Project Maps

Project maps — fifth method for visualizing qualitative data in NVivo 14

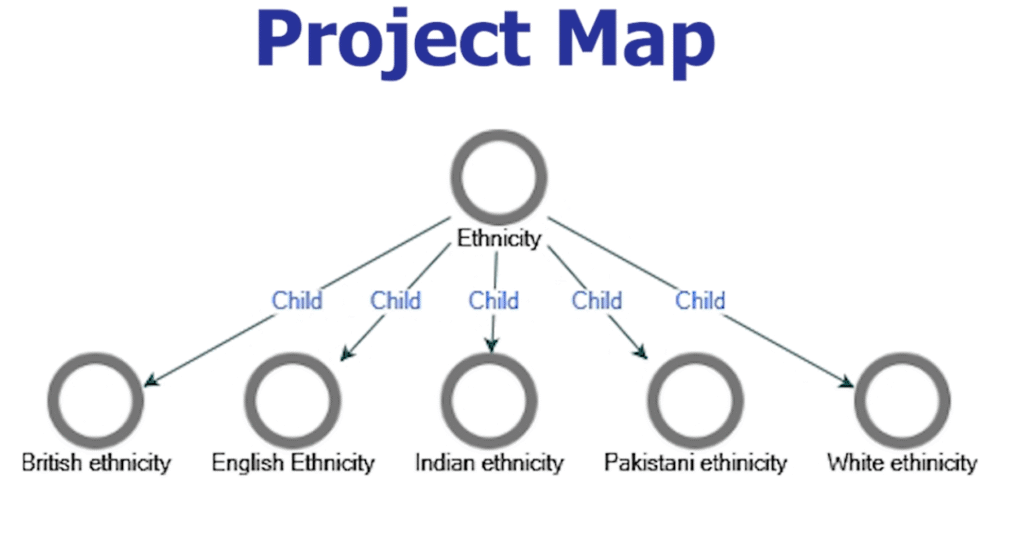
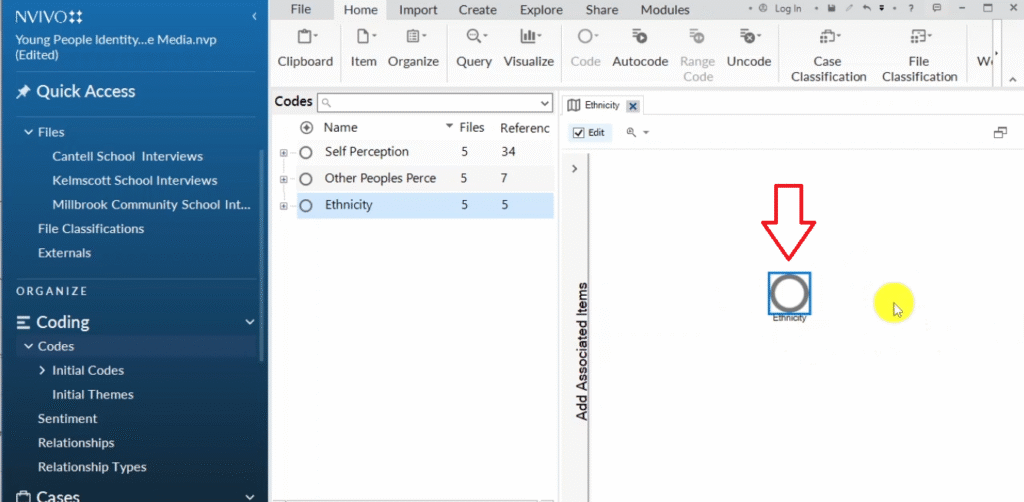
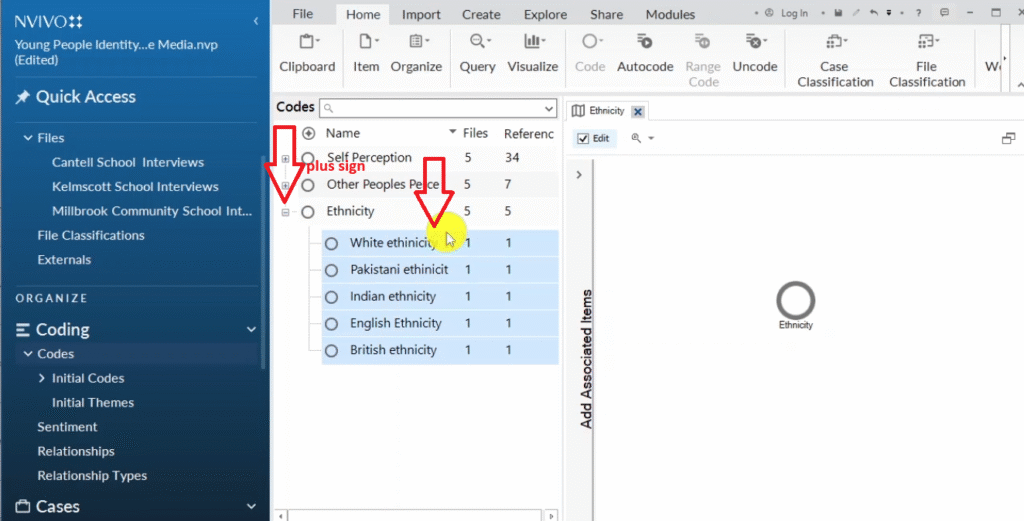
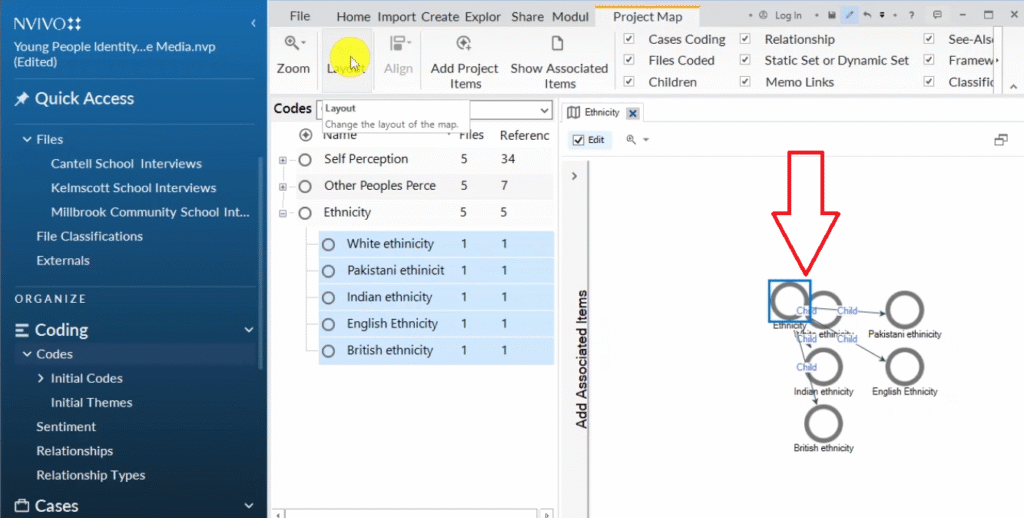
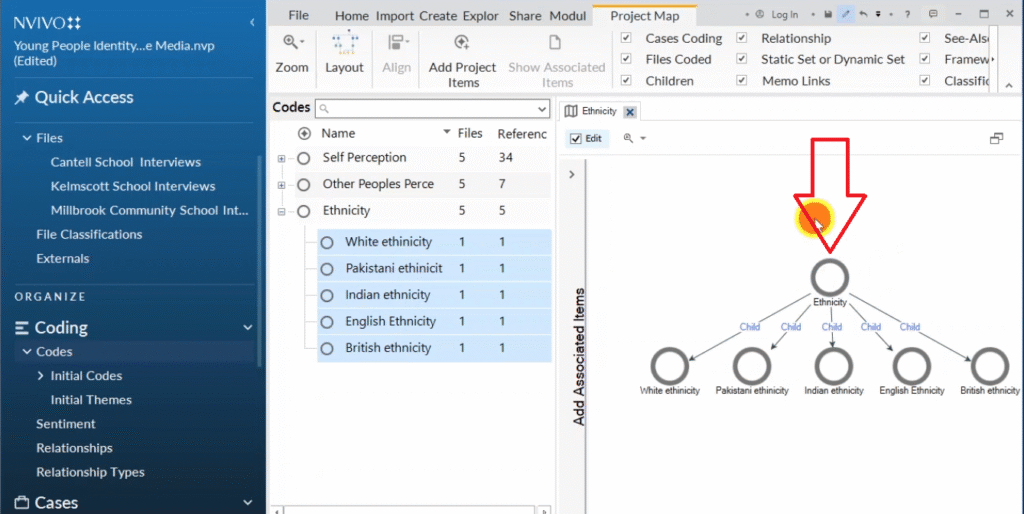
Project maps show your codes and themes as a connected hierarchical diagram. Go to Explore → Map → Project Map. Name it after the theme you want to visualize (e.g. “Project Map Ethnicity”). Drag the theme into the map → click the plus sign → highlight all codes → drag them in. Click the diagram → Layout → Hierarchical for a clean, structured output. Export with Ctrl+Shift+E.
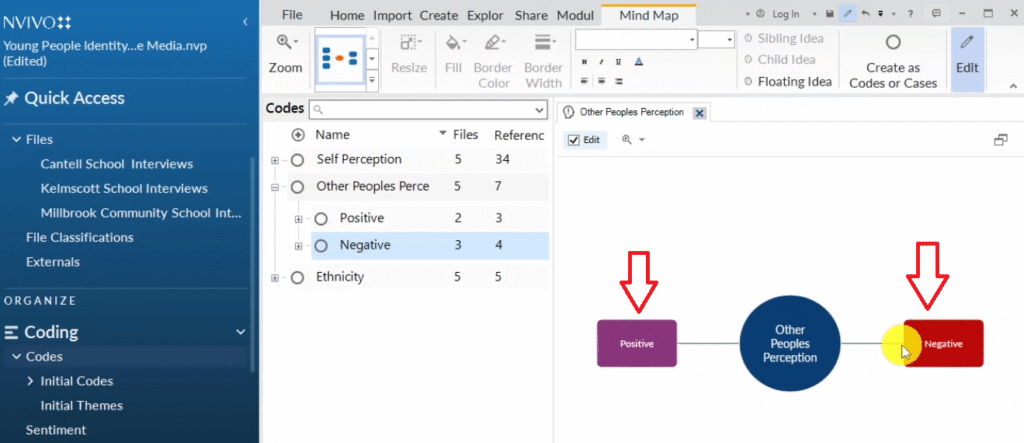
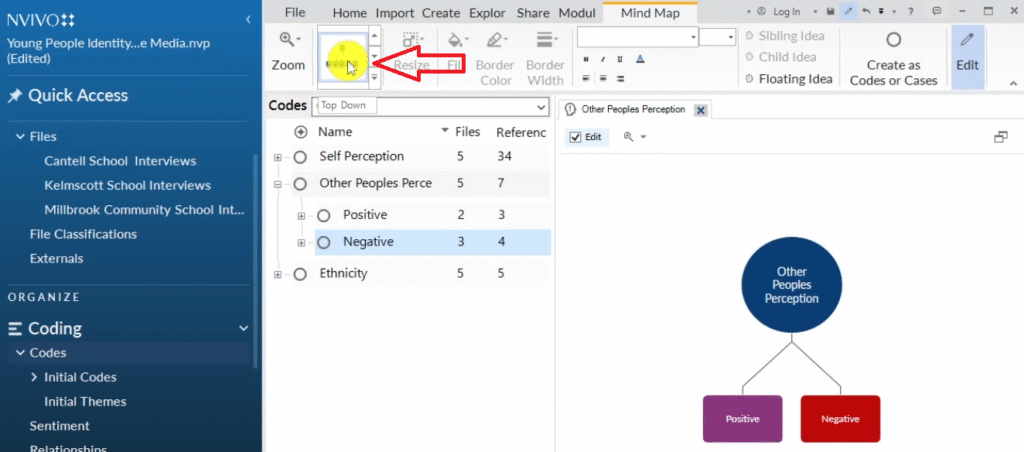
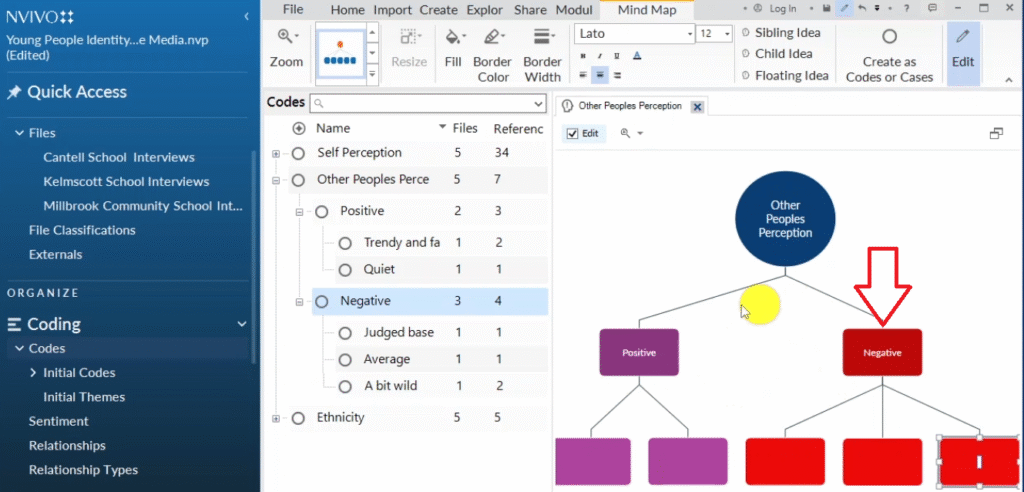
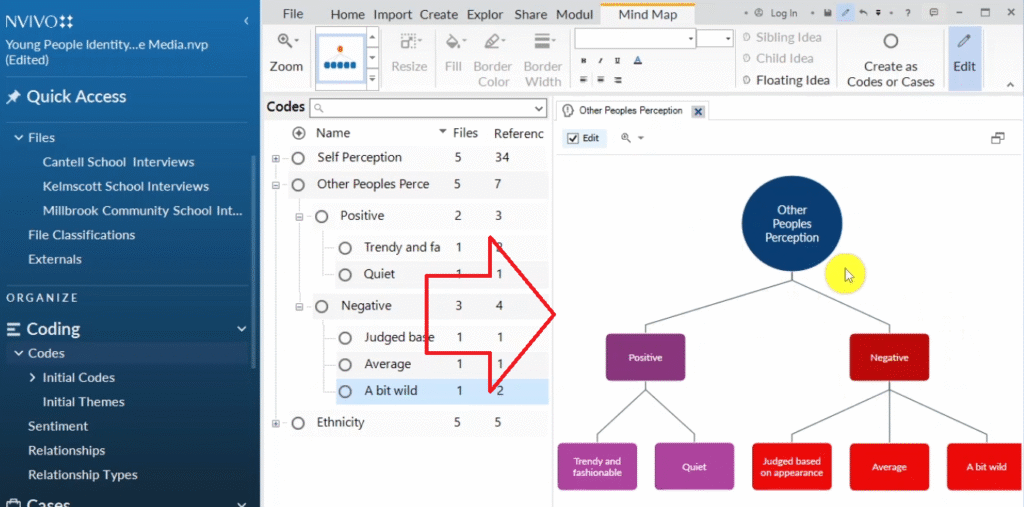
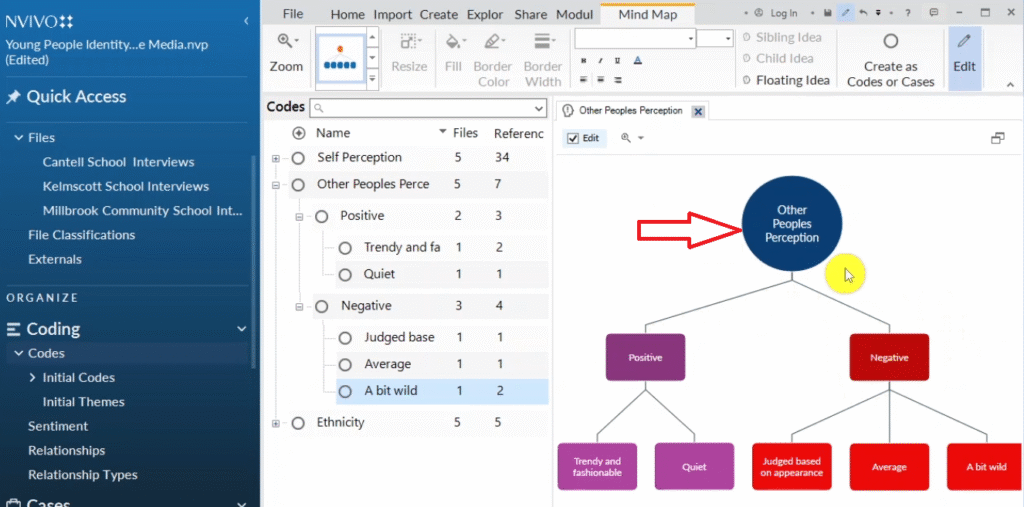
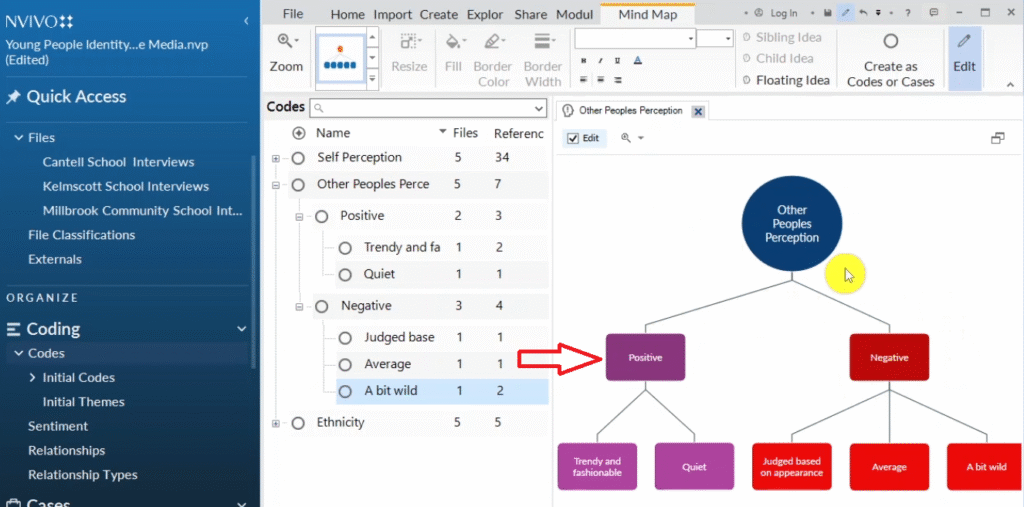
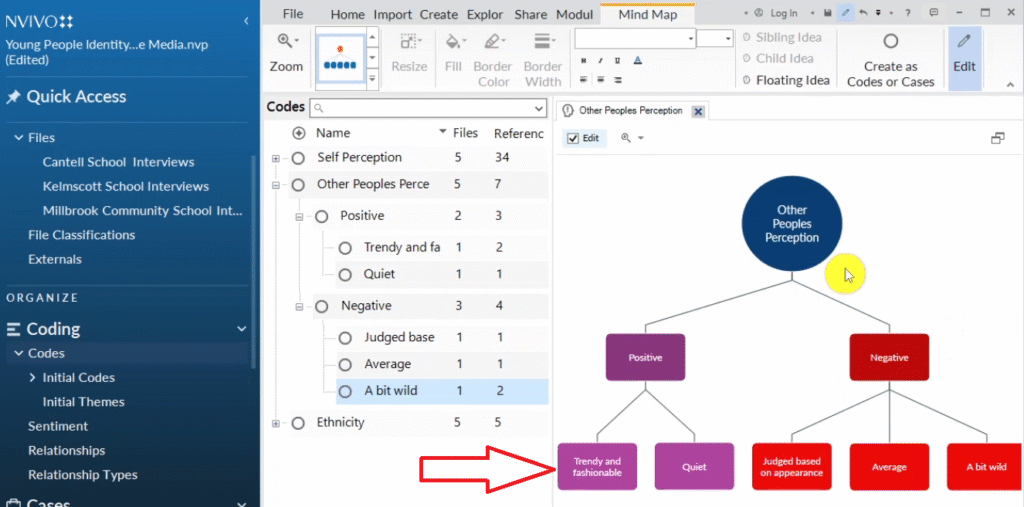
Three major themes in NVivo codes section: ethnicity self-perception other peoples perception
Explore icon in NVivo menu bar for accessing visualization and mapping tools
Map option in NVivo explore menu for creating project maps mind maps and concept maps
Project map option selected in NVivo named Project Map Ethnicity
Ethnicity theme dragged into NVivo project map as a circle for hierarchical visualization
The highlighted section
Codes dragged into NVivo project map showing initial disorganized layout
Hierarchical project map in NVivo showing ethnicity theme with white Pakistani Indian English British codes

6. Mind Maps

Mind maps — sixth method for visualizing qualitative data in NVivo 14

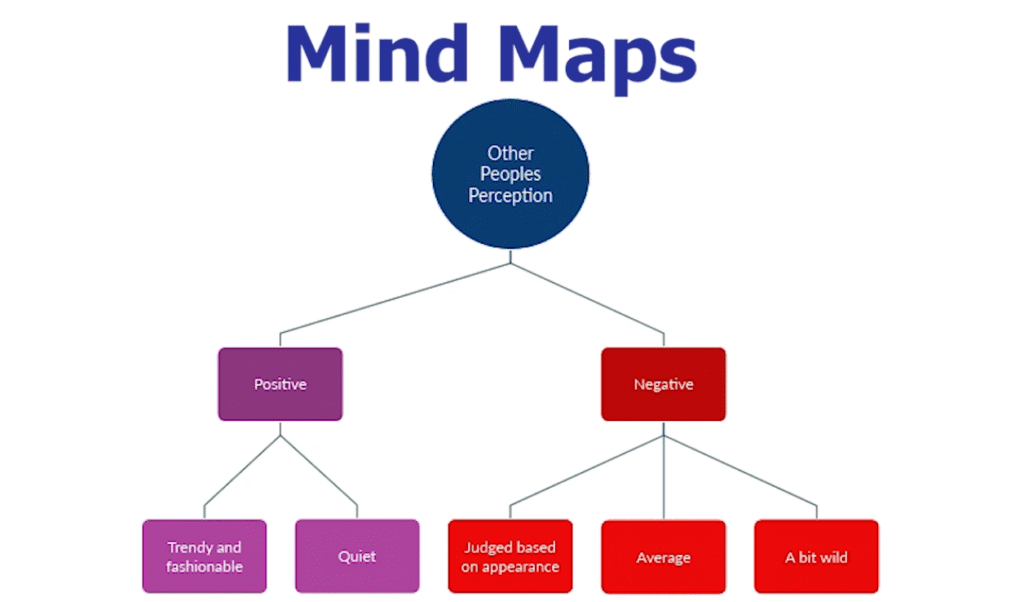
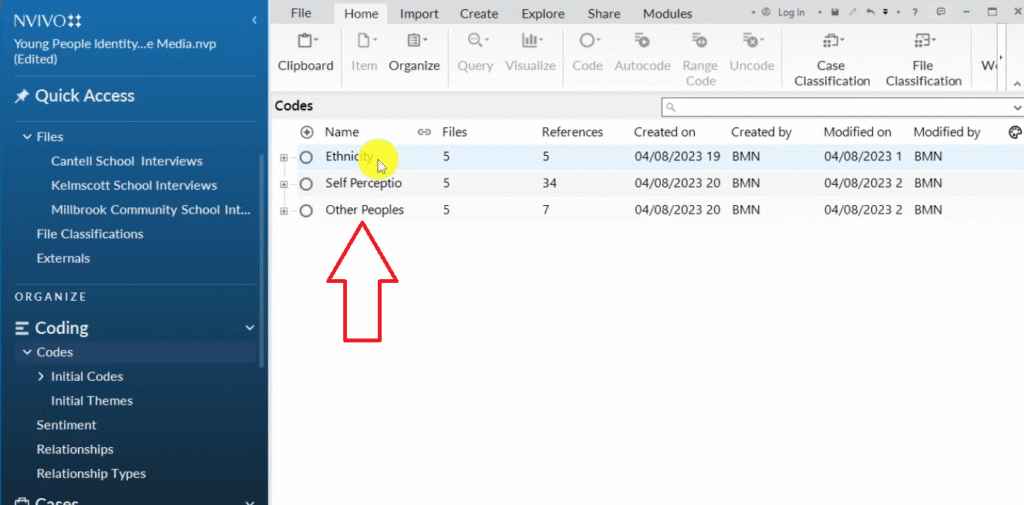
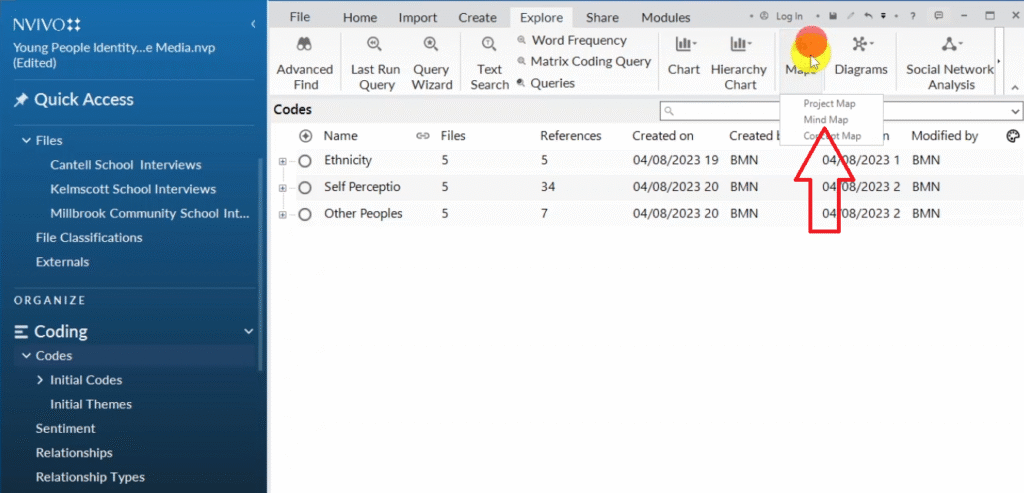
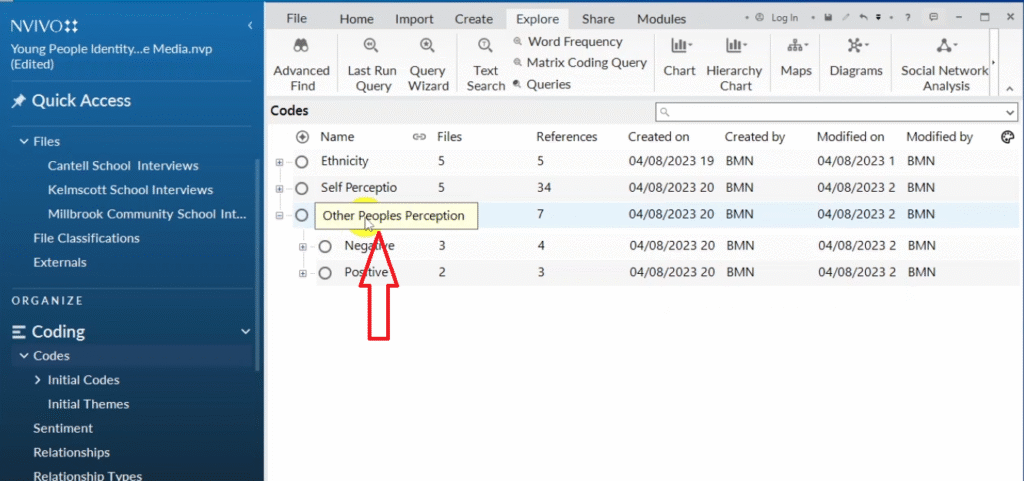
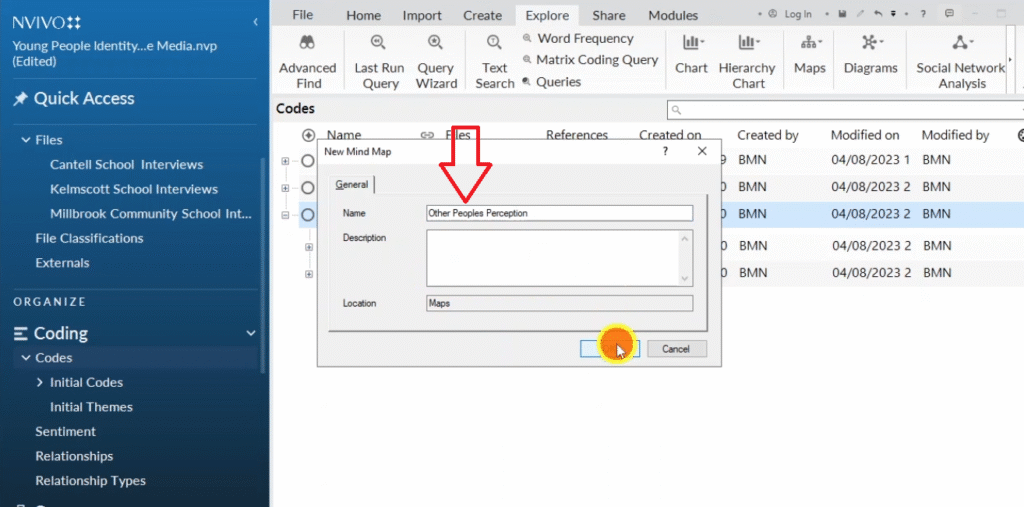
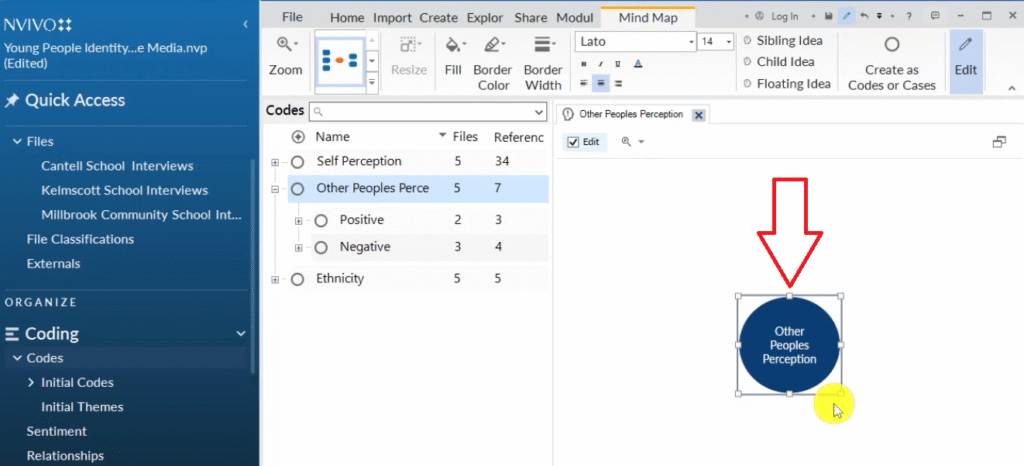
Mind maps show the full hierarchical structure of a theme — from major theme down to subthemes and codes. Go to Explore → Maps → Mind Map. Copy your theme and paste it in as the central node.

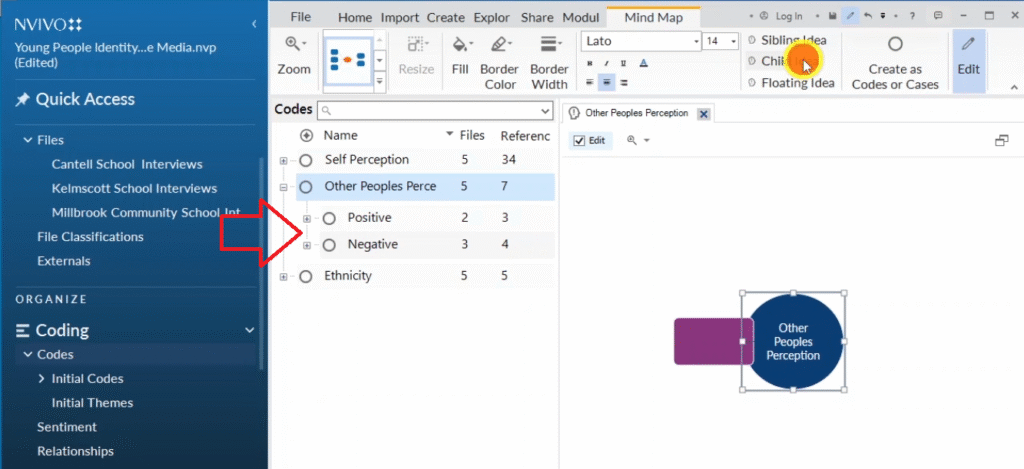
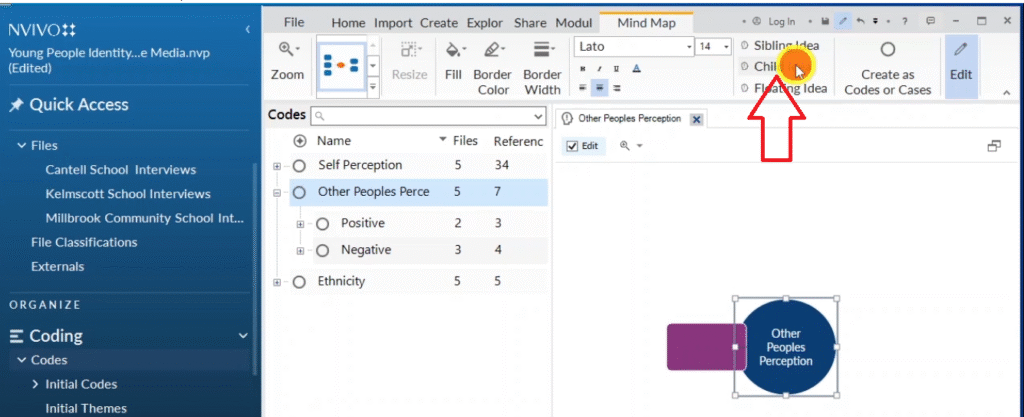
Use Child Idea to add nodes below another idea (e.g. subthemes under the main theme). Use Sibling Idea for nodes at the same level (e.g. multiple subthemes). Apply the Top Down layout from the left formatting panel for a clear reading. Export with Ctrl+Shift+E.
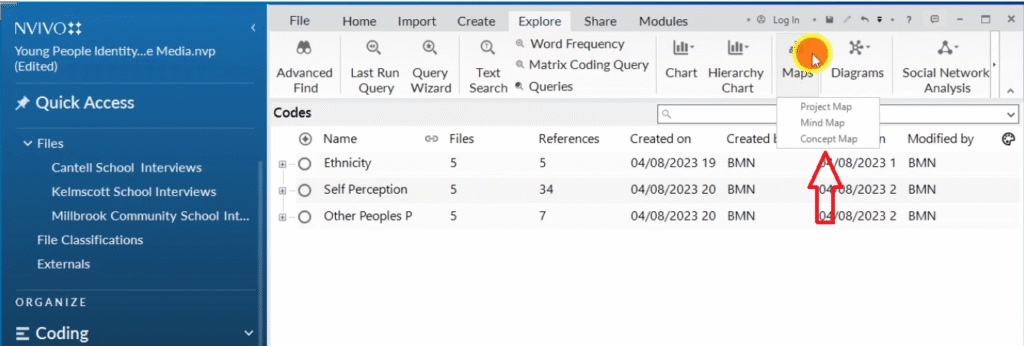
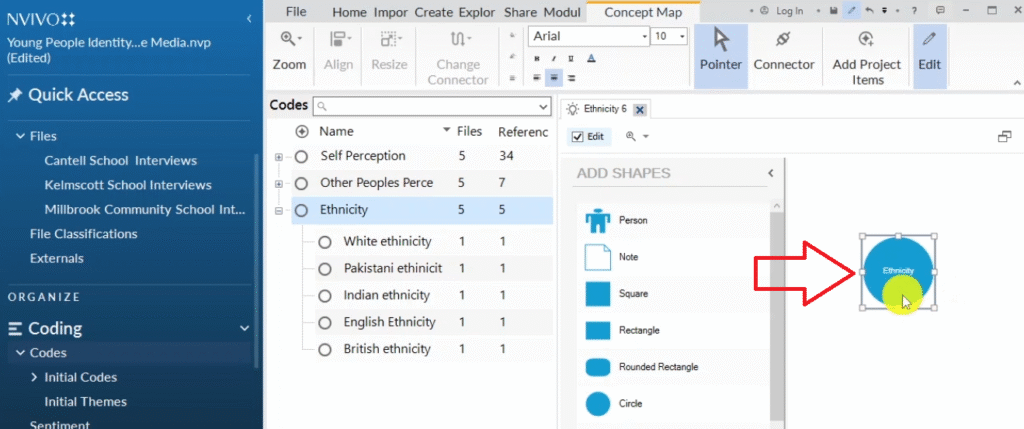
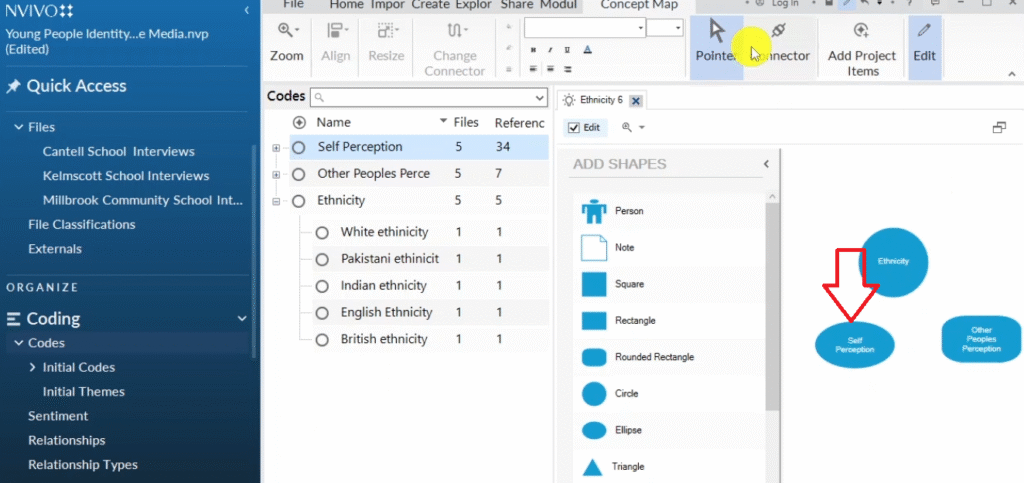
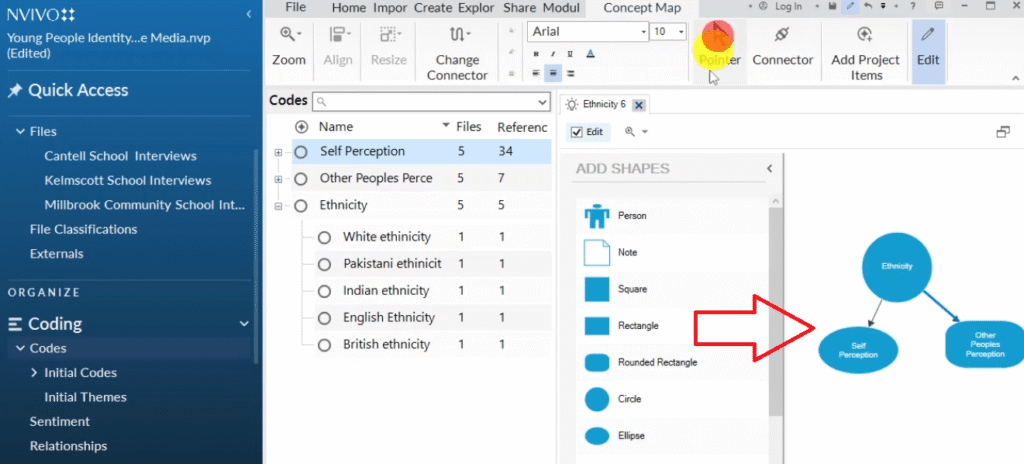
Major themes in NVivo codes panel for mind map: ethnicity self-perception other peoples perception
Mind map icon selected in NVivo explore maps menu for creating theme mind map
Other peoples perception theme selected in NVivo for mind map creation
Other peoples perception theme pasted into NVivo mind map interface
First circle created in NVivo mind map for other peoples perception theme
Positive and negative sub-themes visible under other peoples perception in NVivo mind map
Child idea icon in NVivo mind map for adding sub-themes below a main theme node
Positive and negative sub-themes added as child ideas in NVivo mind map
Top-down layout applied to NVivo mind map showing other peoples perception with positive and negative
Child ideas created under positive sub-theme in NVivo mind map: trendy fashionable quiet codes
All codes pasted into child ideas in NVivo mind map under positive and negative sub-themes
Major theme level labeled in completed NVivo mind map for qualitative data visualization
Sub-theme level labeled in NVivo mind map showing other peoples perception structure
Code level labeled in NVivo mind map — lowest level showing individual qualitative codes

7. Concept Maps

Concept maps — seventh method for visualizing qualitative data in NVivo 14

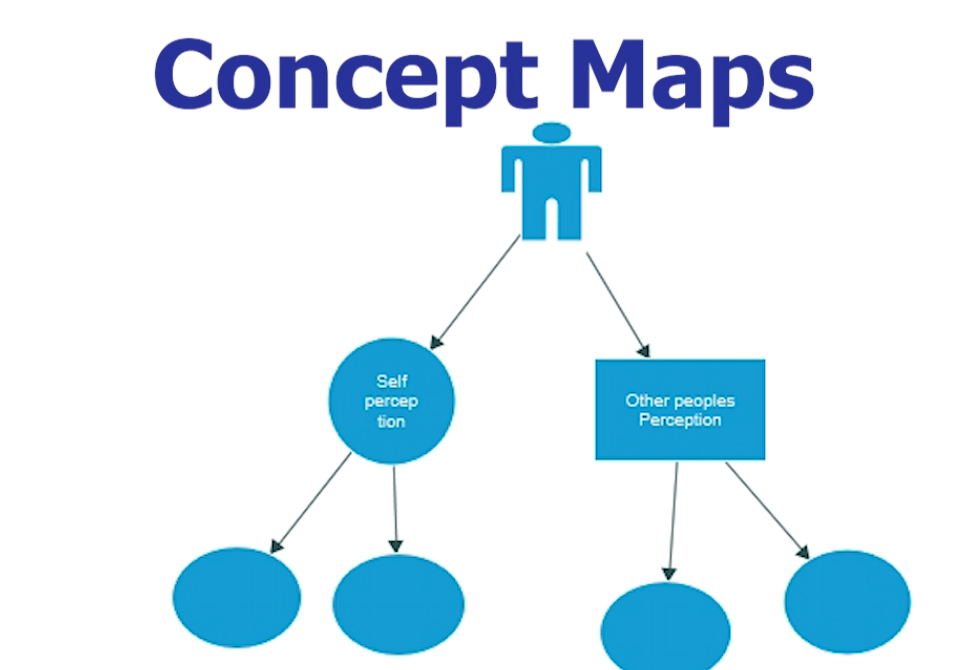
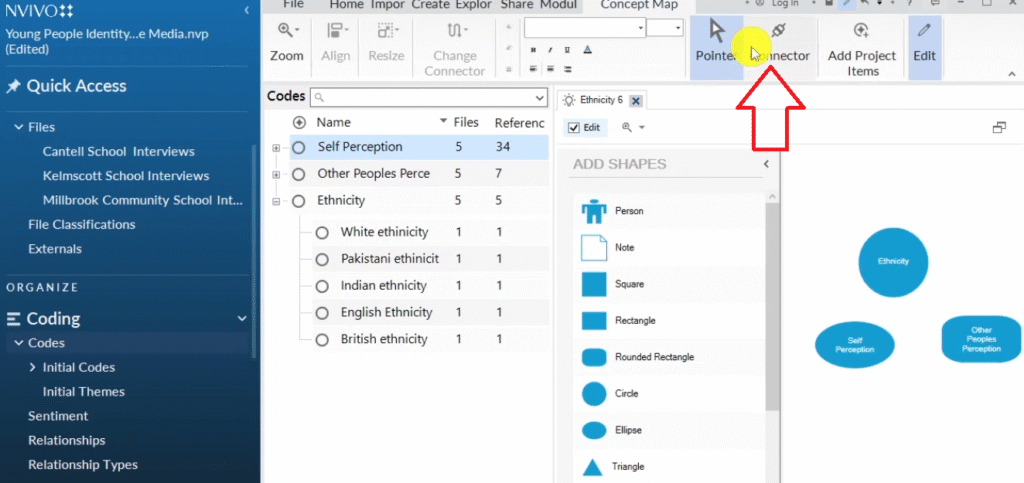
Concept maps show the relationships between different themes — how they connect or influence each other. Go to Explore → Maps → Concept Map. Create a shape for each major theme, then use the Connector tool to draw relationship lines between them. You can label the connectors to explain the nature of each relationship. This type of map works well in a theoretical framework or discussion chapter.

Concept maps — seventh method for visualizing qualitative data in NVivo 14
Concept map icon selected in NVivo explore maps menu for showing relationships between themes
Ethnicity theme added as circle in NVivo concept map
Other peoples perception shape added to NVivo concept map alongside ethnicity theme
Connector tool in NVivo concept map for drawing relationship lines between themes
Three themes connected by arrows in NVivo concept map showing relationships between ethnicity self-perception and other peoples perception


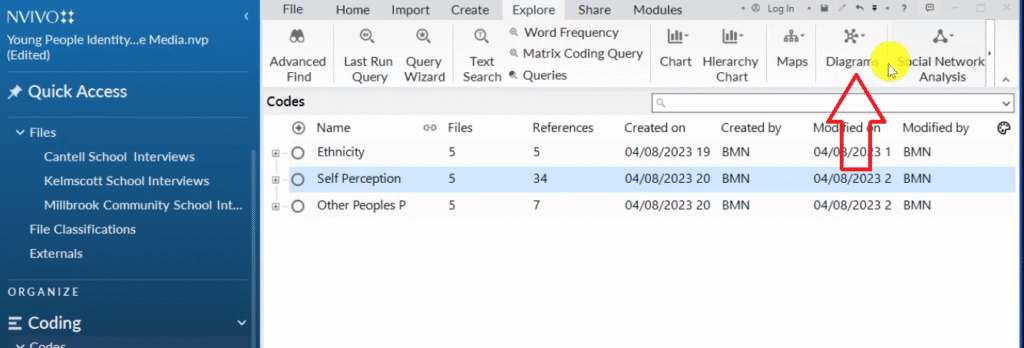
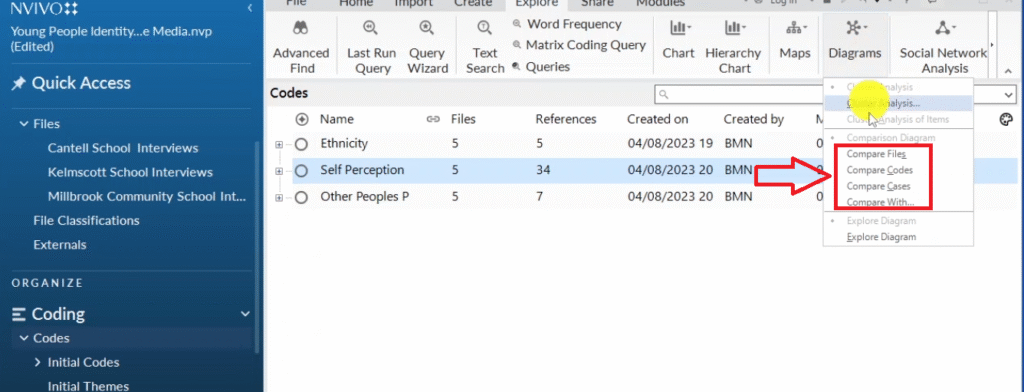
8. Comparison Diagrams

Comparison diagrams — eighth method for visualizing qualitative data in NVivo 14

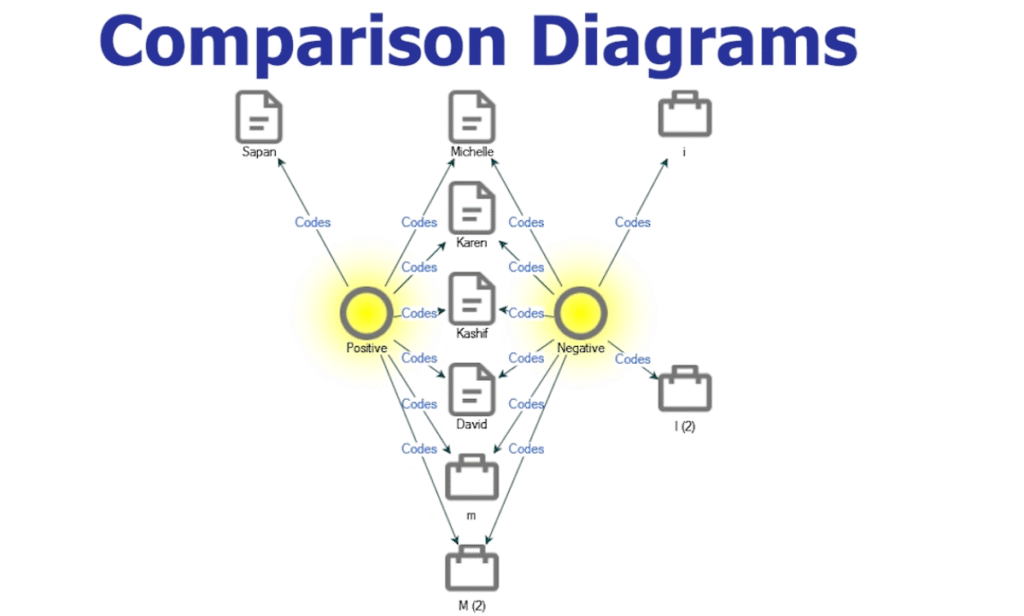
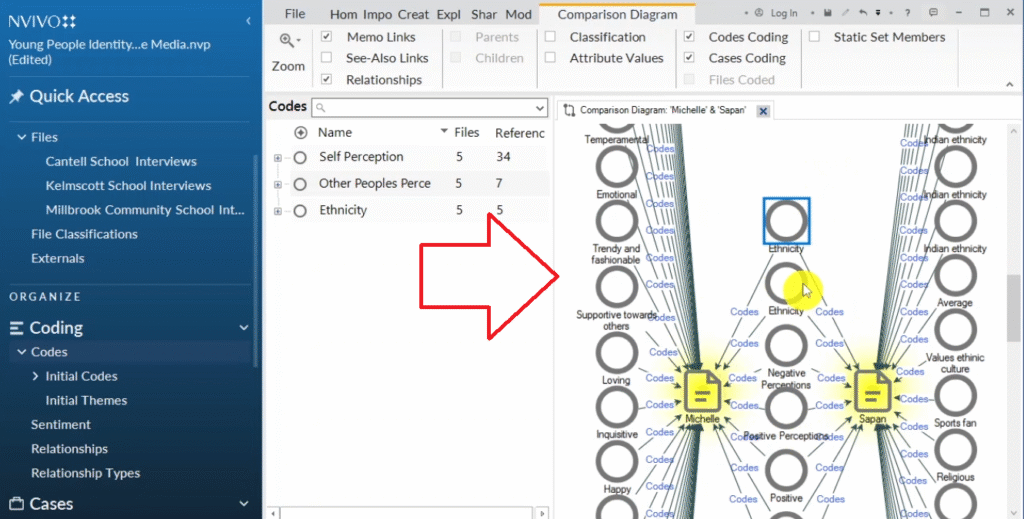
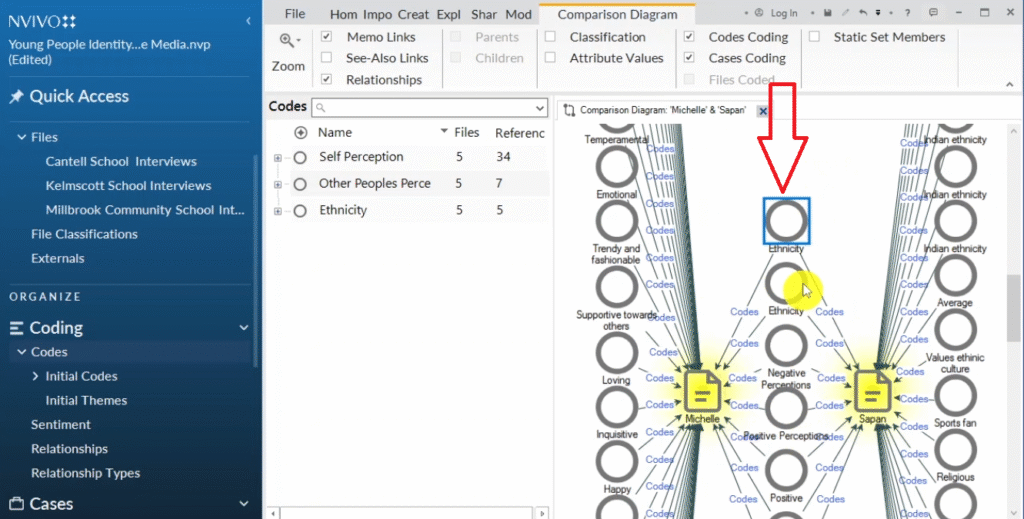
Comparison diagrams compare what two participants (or files) talked about. Go to Explore → Diagrams → Compare Files → select two participants → click OK. NVivo draws a Venn-style diagram showing codes that both participants mentioned in the centre, and codes unique to each participant on their respective sides.

In my example comparing Michelle and Sapan, the diagram shows they both discussed ethnicity, negative perceptions, and positive perceptions — but each also raised unique codes. This is useful for showing convergence and divergence across your participant group.

Diagrams icon in NVivo explore menu for accessing comparison diagrams
Compare files compare code and compare cases options in NVivo diagrams menu
Two participants selected in NVivo compare files for Venn-style comparison diagram
Comparison diagram created in NVivo showing Michelle and Sapan with shared and unique codes
NVivo comparison diagram showing both Michelle and Sapan discussed ethnicity negative and positive perceptions

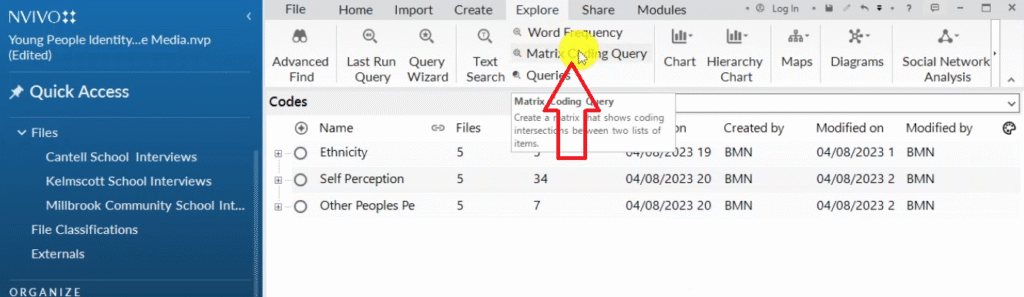
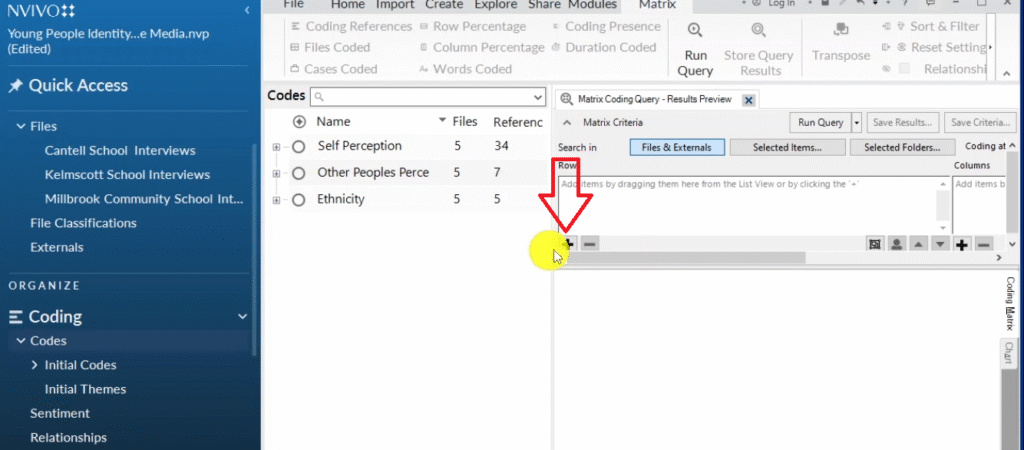
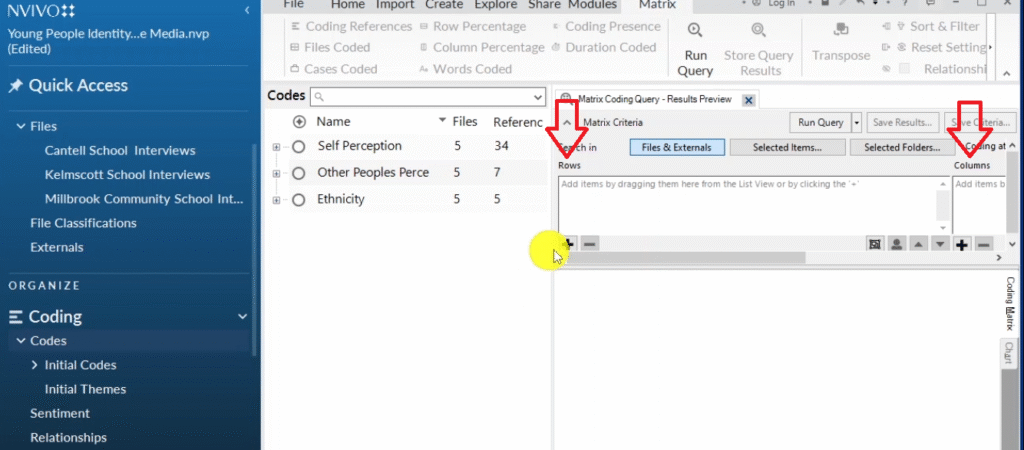
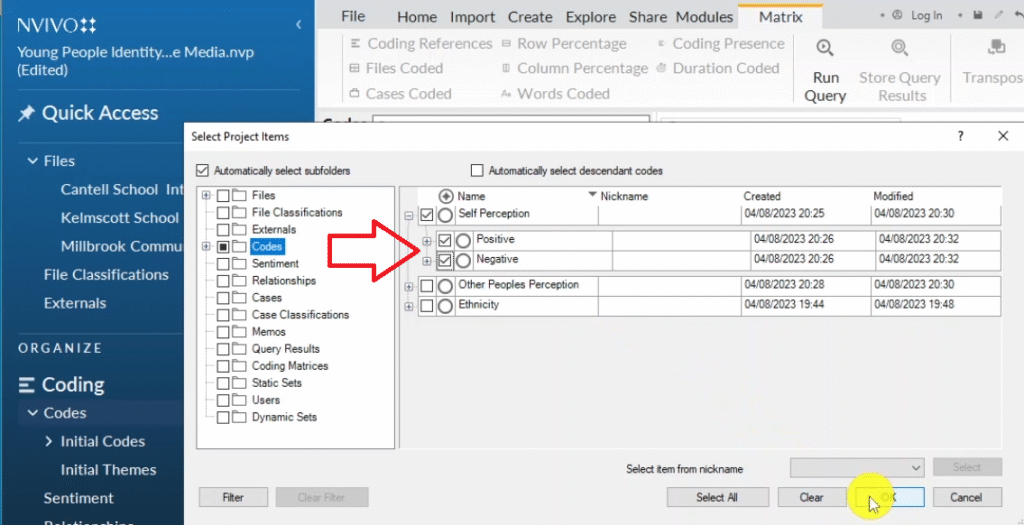
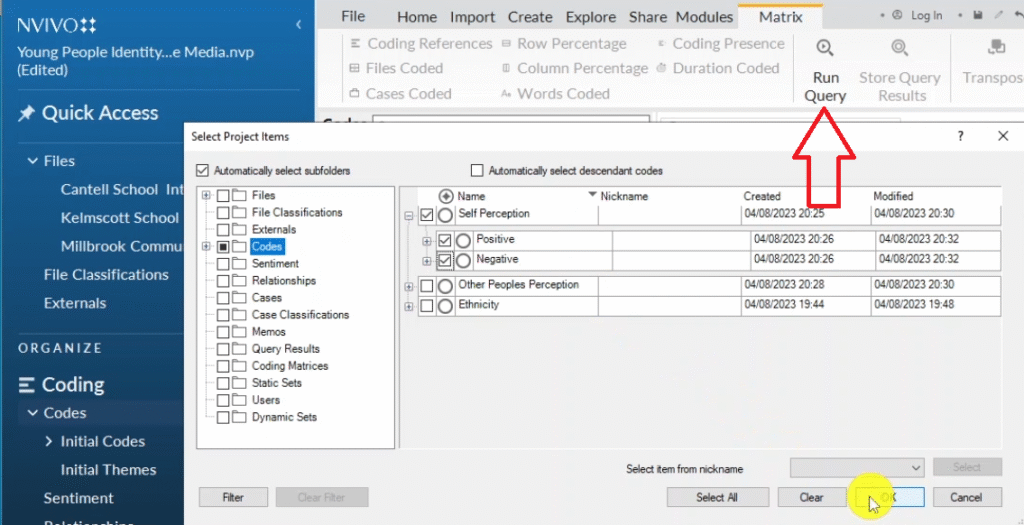
9. Matrix Coding Query Tables

Matrix coding query tables — ninth and final method for visualizing qualitative data in NVivo

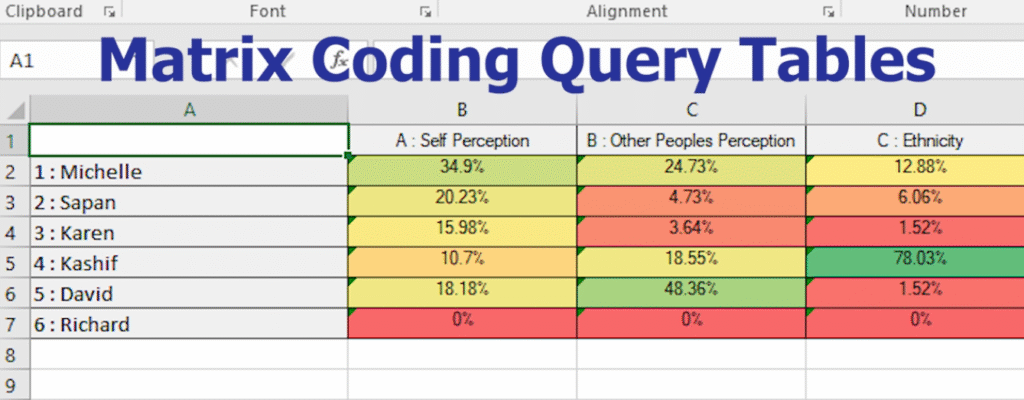
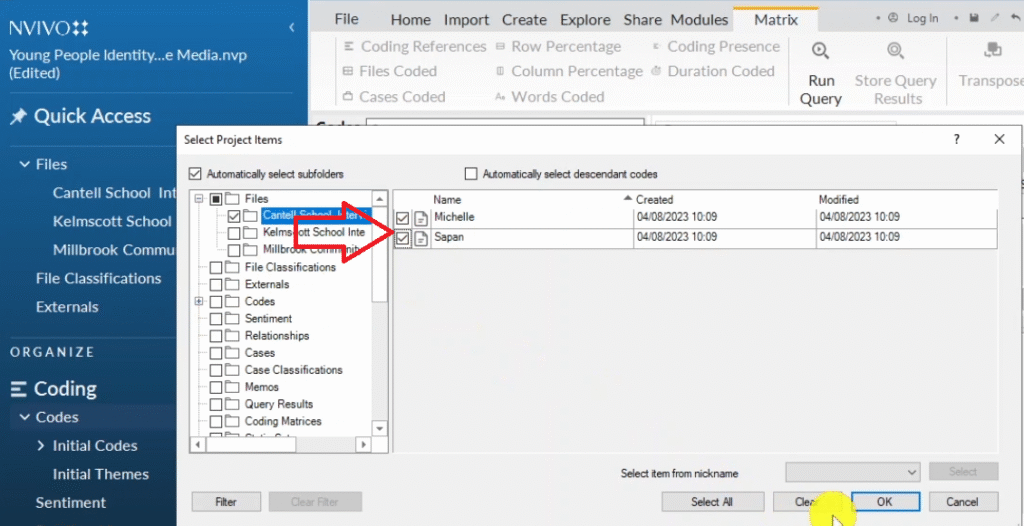
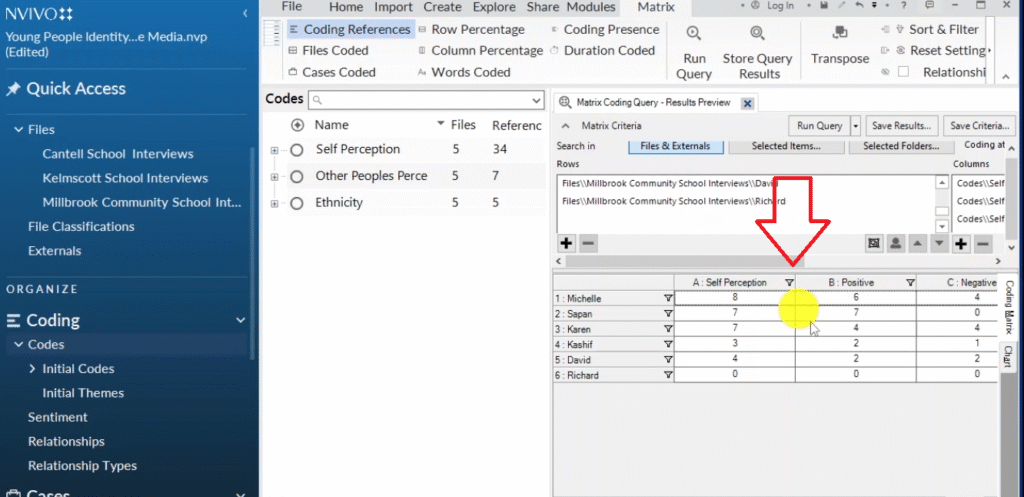
Matrix coding query tables show how much each participant contributed to each theme. Go to Explore → Matrix Coding Query → click the plus sign. Add your participants as rows, and your themes or subthemes as columns. Click Run Query.

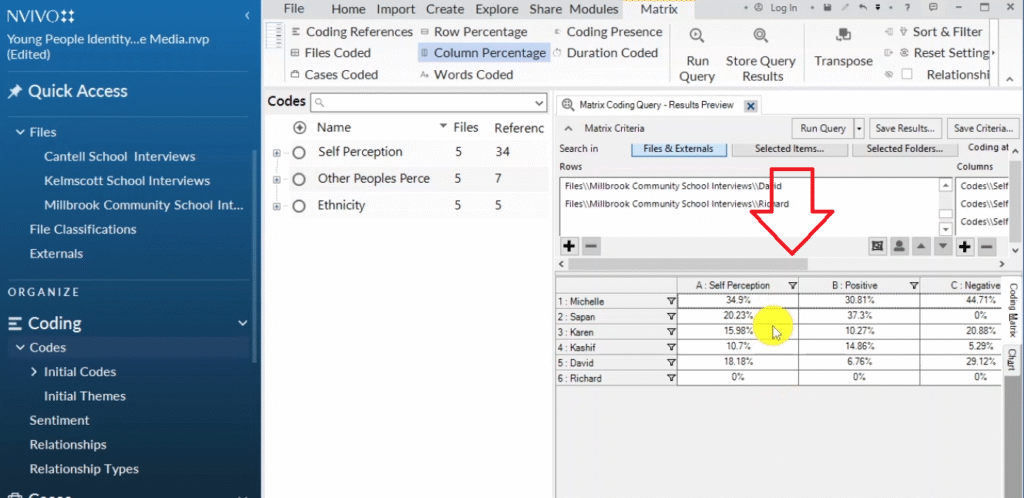
Click the Column Percentage button to see the proportion of references each participant contributed. In my example: Michelle 34.9%, Sapan 20.23%, Karen 15.98%, Kashif 10.7%, David 18.8%. This does not mean some participants are more important than others — in qualitative research we don’t interpret percentages quantitatively. But this table is useful in your appendix to show the distribution of data across participants.

Matrix coding query icon in NVivo explore menu for creating participant-by-theme coding tables
Plus sign icon in NVivo matrix coding query for adding rows and columns to the query
Rows and columns interface in NVivo matrix coding query — participants in rows, themes in columns
Two participants added as rows in NVivo matrix coding query table
An image of the adTwo participants added as rows in NVivo matrix coding query table
Self-perception positive and negative sub-themes selected as columns in NVivo matrix coding query
Run query button in NVivo matrix coding query to generate participant-by-theme coding reference table
NVivo matrix coding query results showing coding references per participant per theme
Column percentages in NVivo matrix coding query: Michelle 34.9%, Sapan 20.23%, Karen 15.98%, Kashif 10.7%, David 18.8%
An image of tColumn percentages in NVivo matrix coding query: Michelle 34.9%, Sapan 20.23%, Karen 15.98%, Kashif 10.7%, David 18.8%

That covers all nine visualization methods in NVivo 14 and 15. For the parallel process using a different tool, see my guide on qualitative analysis with MAXQDA, which covers coding, theming, and reporting in the same way.

Frequently Asked Questions

Can I use NVivo for thematic analysis?

Yes — NVivo is one of the most widely used tools for thematic analysis. It supports both the Braun and Clarke six-step framework and Saldana’s inductive method. The coding, grouping, and theme development process maps directly onto what both frameworks require.

What version of NVivo should I use?

NVivo 15 is the current version as of 2025. The core coding and theming process is the same across NVivo 12, 14, and 15. The visualization features in Part 4 apply to NVivo 14 and 15. Check the Lumivero NVivo page for the latest version details.

How many codes should I generate before moving to themes?

There is no fixed number. For most PhD-level interview studies with 6 to 15 participants, you will typically generate 30 to 80 initial codes before grouping them. Focus on coverage — make sure every significant topic raised by participants has a code — rather than aiming for a specific count.

Should I code all transcripts before developing themes?

Yes. Code every transcript before you start developing themes. Theme development requires seeing the full picture across all your participants. Theming too early leads to themes that do not hold up once all the data is coded.

Can I use NVivo for focus groups as well as interviews?

Yes. The same coding and theming process applies to focus group transcripts. The main difference is that you code by group rather than by individual participant. For a comparison of how ATLAS.ti handles the same process, see my guide on qualitative analysis of interviews with ATLAS.ti. For more on qualitative research methodology, Scribbr’s guide to thematic analysis is a reliable external reference.

Key Takeaways

Code all transcripts first, then develop themes — never the other way around

Coding = tagging and interpreting important quotes from your transcripts. You are not summarizing — you are labeling meaning in relation to your research questions

Use color codes in NVivo to organize codes by interview question — this makes theme development visual and fast

A theme is a pattern of shared meaning across multiple codes. Every theme needs a written description explaining what it represents

Your findings report has two parts: the data analysis process (how you analyzed) and the findings discussion (what you found), supported by participant quotes

NVivo can export theme lists, codebooks, and participant quotes directly — these become the raw material for your report and appendix

Use at least two or three visualizations in your findings chapter. Hierarchy charts and mind maps are the most academically appropriate for a thesis or dissertation

Struggling with your ATLAS.ti thematic analysis? If you’re working through your qualitative data in ATLAS.ti and feeling stuck — on the coding, the categories, the themes, or writing it all up — I can take it off your plate completely. I offer a done-for-you qualitative analysis service for PhD students. You share your transcripts and research questions, and I handle the full ATLAS.ti analysis: coding, categorizing, theme development, analytic memos, and a written summary of your findings. I’ve helped more than 300 PhD students get their qualitative analysis done — on time, to examiner standard, and without the stress. Get in touch here to discuss your ATLAS.ti project.

Leave a Comment

Your email address will not be published. Required fields are marked *

Scroll to Top