In my last article, we went from raw transcripts.
Coded our data.
And developed themes
In this article we are going to see how we can get information out of N-Vivo15 into a written Word document.
The written word document will be our findings report which is normally the fourth chapter of a thesis or dissertation.
In this article, we are therefore going to look at the following.
How do we develop a narrative after conducting thematic analysis using N Vivo 15?

And how do we supplement our narrative with interesting visuals?
My name is Bernard Mugo. I like to refer to myself simply as an academic.

In the past three years, I’ve helped more than 200 PhD students analyze qualitative data and finally complete their thesis or dissertations.
In the course of helping such a large number of students, I’ve gained invaluable experience in the best practices that you can use to perform qualitative analysis of your interviews and be able to retrieve quality findings.
Final coding structure
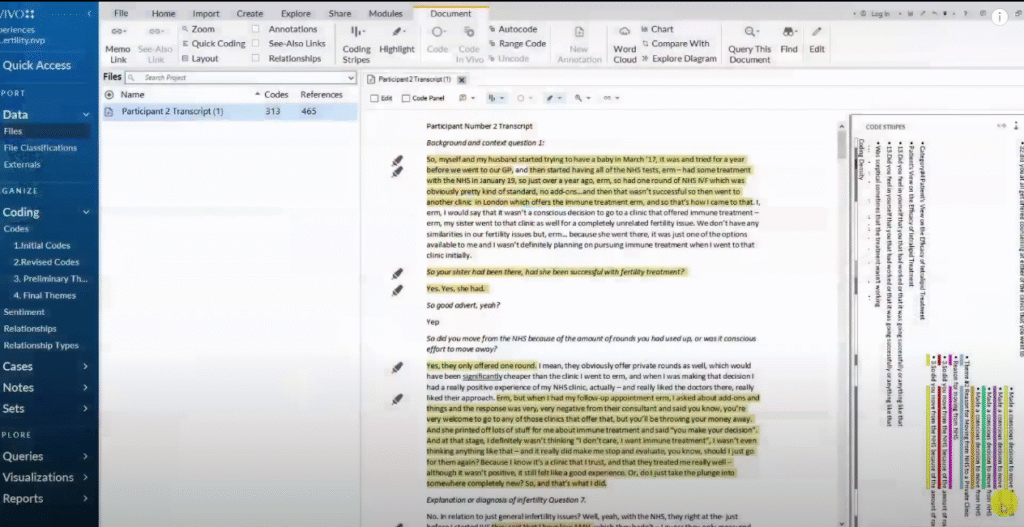
Let’s begin with the N-Vivo project.
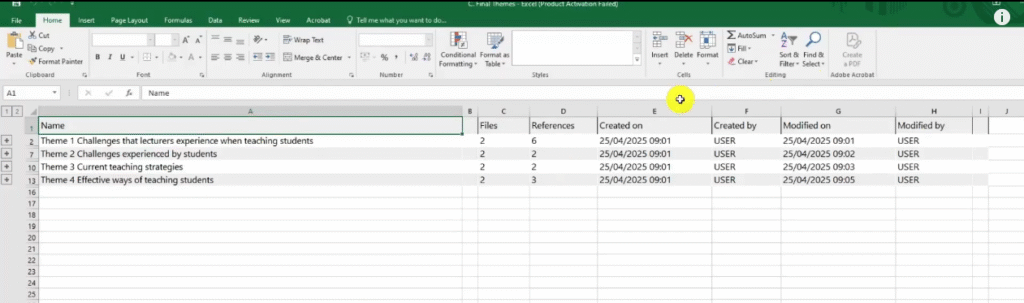
If you read my previous article, this is the analysis that I did to go from having these two files.
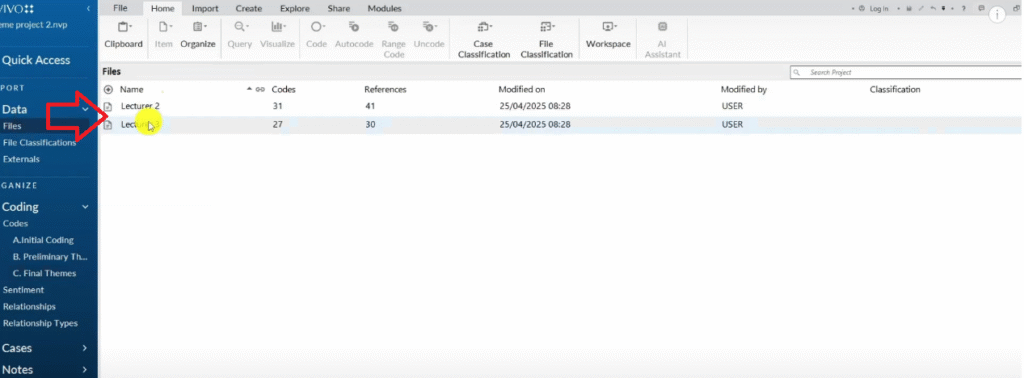
Then we coded them.
Then we got preliminary themes.
And then we had final themes.
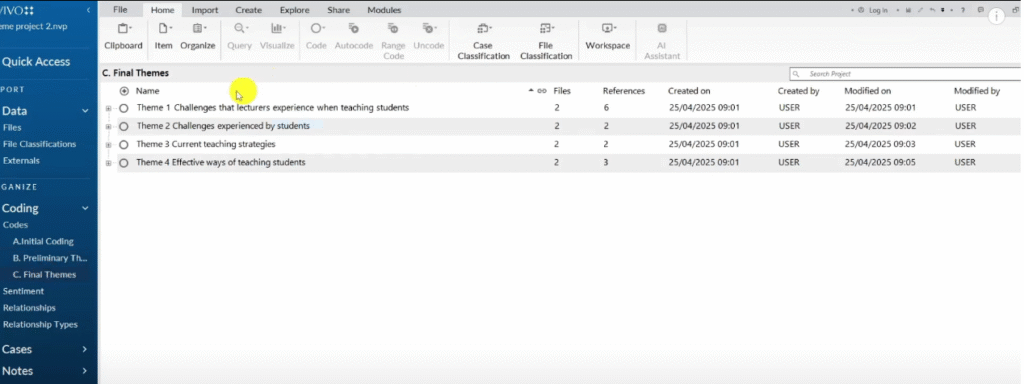
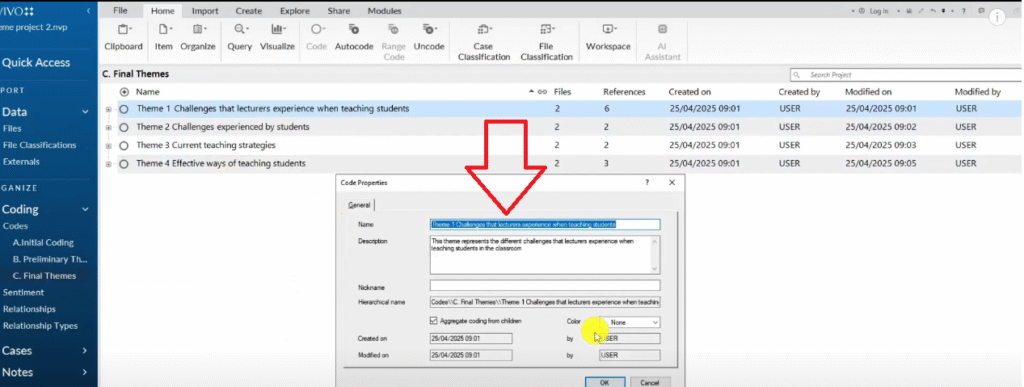
Remember that each theme has a description.
Exporting code book and code list in N-Vivo 15
Now we want to move from this N-Vivo file where we have done our thematic analysis.
Most likely the approach I used was the Braun and Clarke six-step framework which is an inductive approach to thematic analysis.

And now we want to move from the final themes to having a findings report.
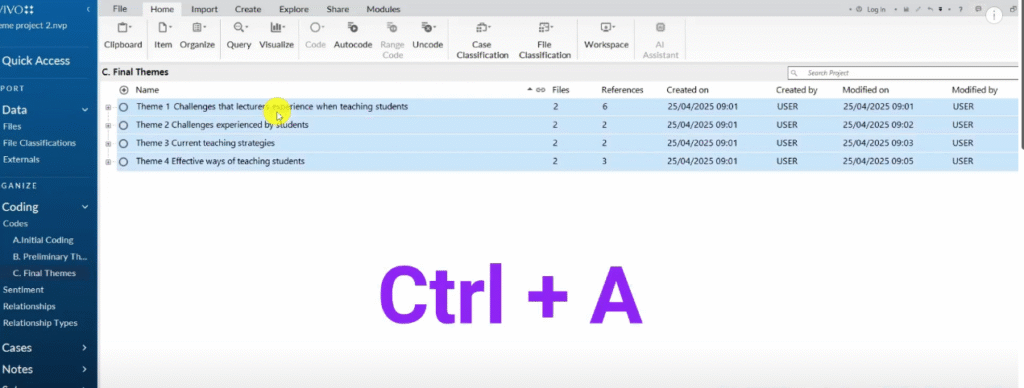
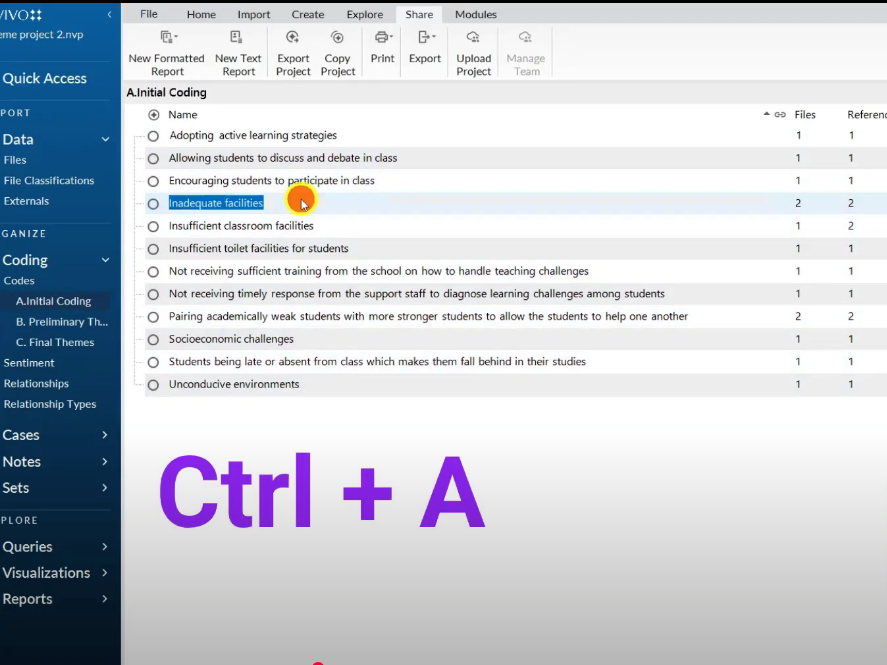
The first thing that we can do is to press Control A in N-Vivo just to highlight everything.
Go to export
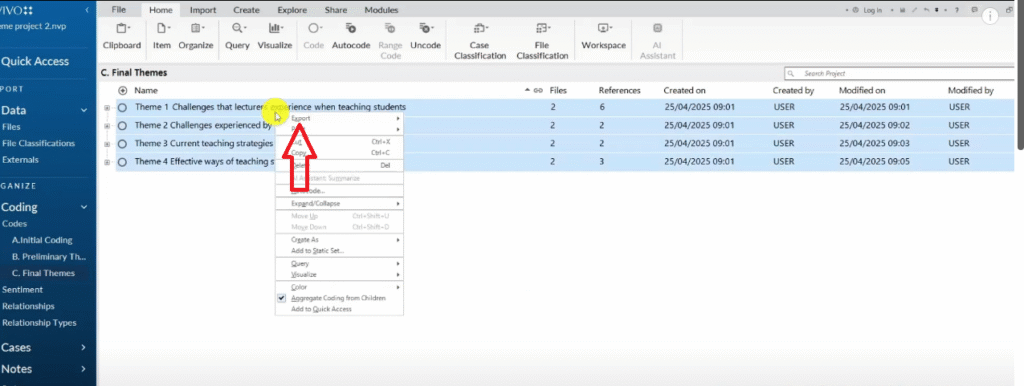
And export list.
I want to export a code list which is an Excel file.
That we can use to draw tables in our report.
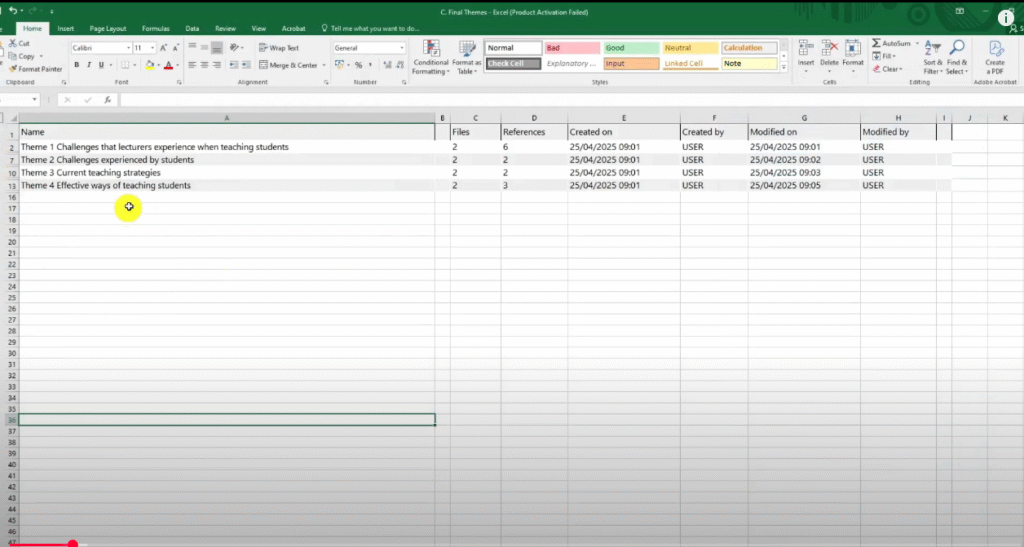
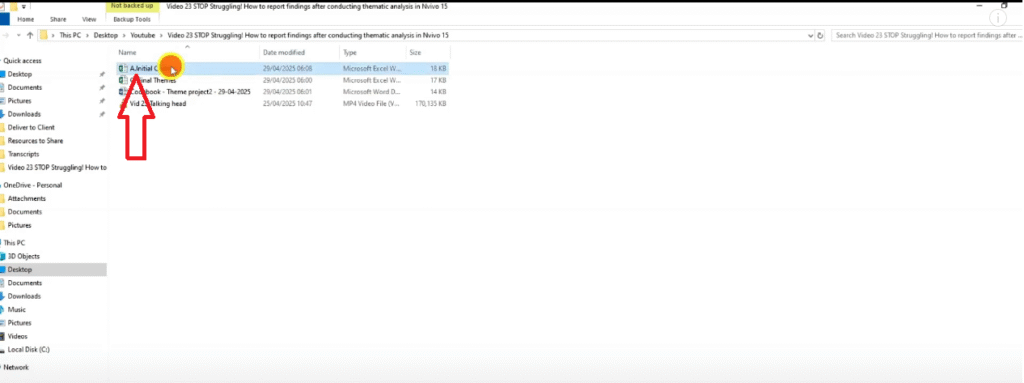
If I go to the folder.
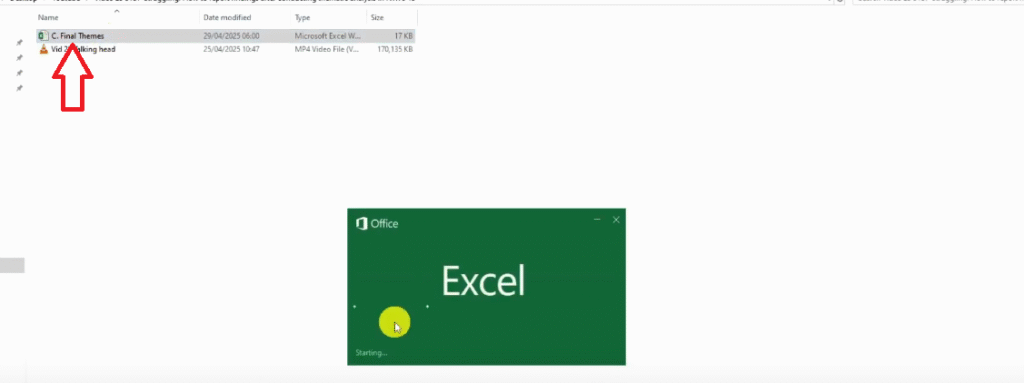
This is the file I just exported.
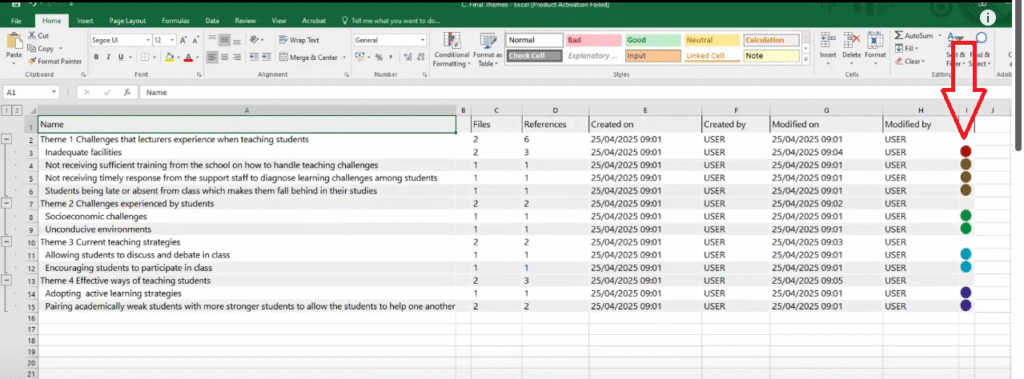
You can see that it shows the coding structure.
There are numbers here one and two.
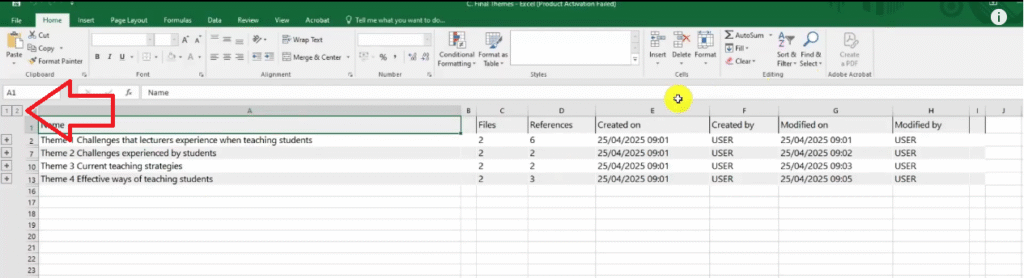
Themes and the codes.
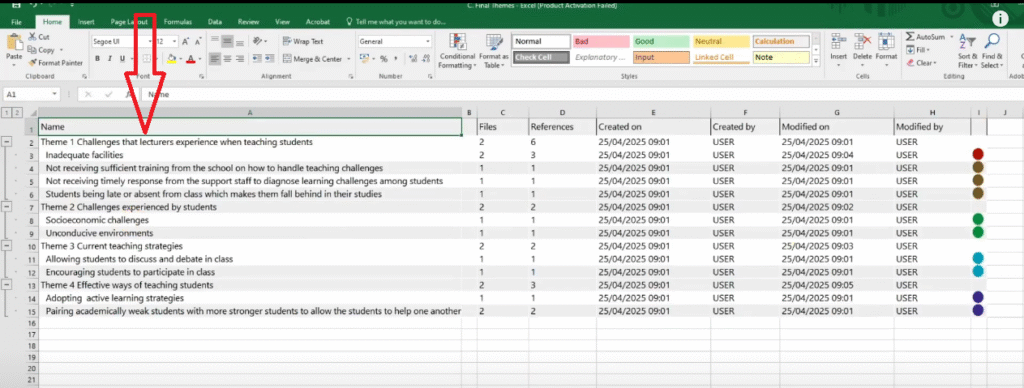
You can see even the color codes.
So for this we use it to draw different kind of tables in our findings report.
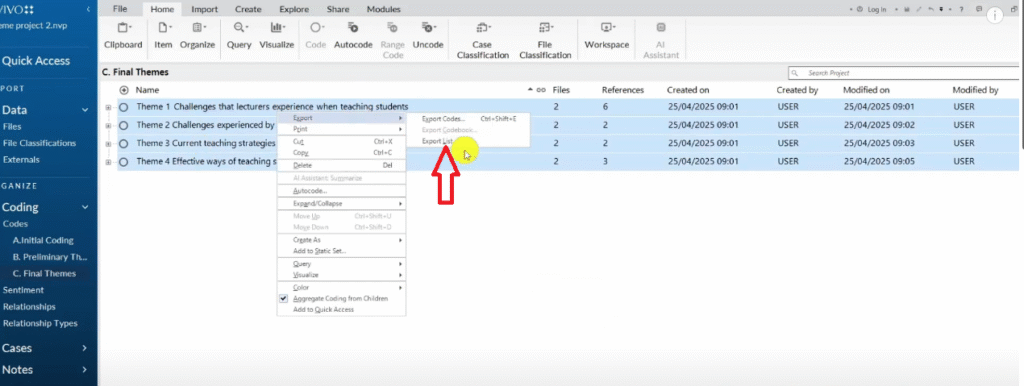
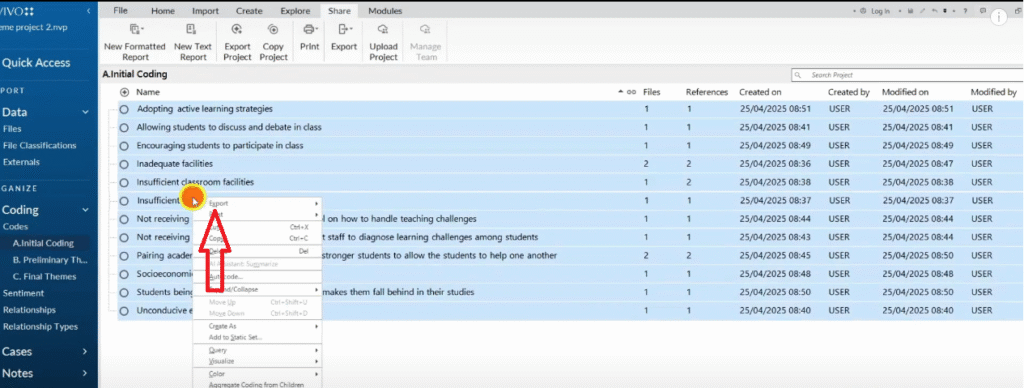
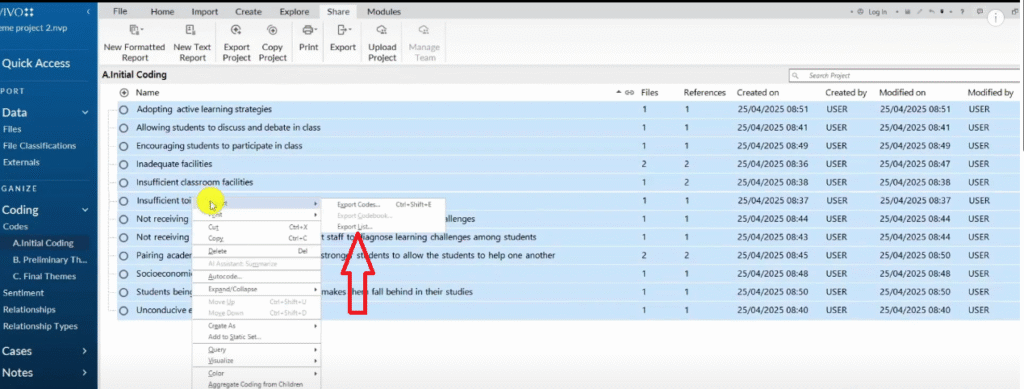
Another thing I can export from N-Vivo is the code book.
So I click on the share button.
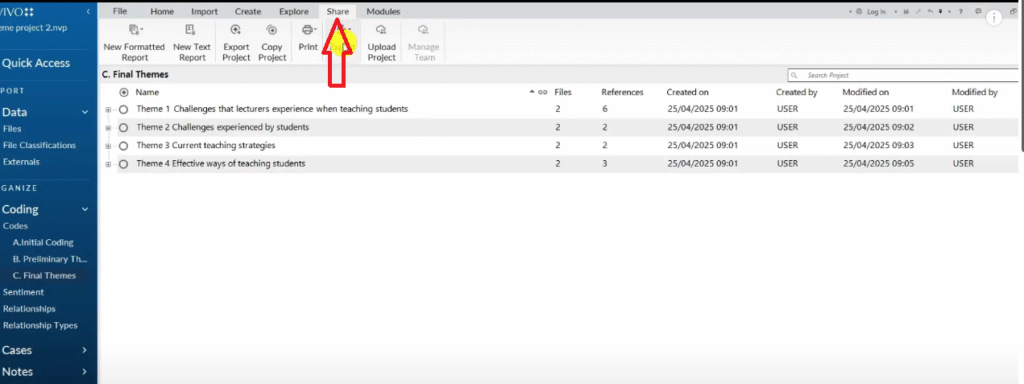
I go to export.
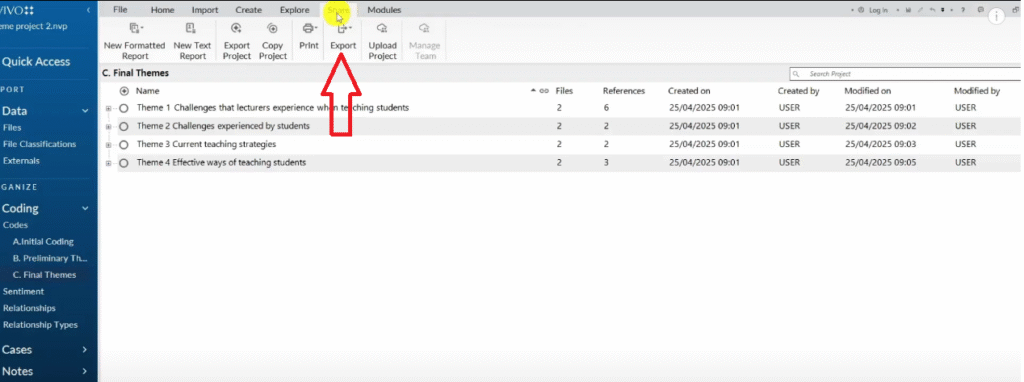
Export code book.
I click on the final theme folder.
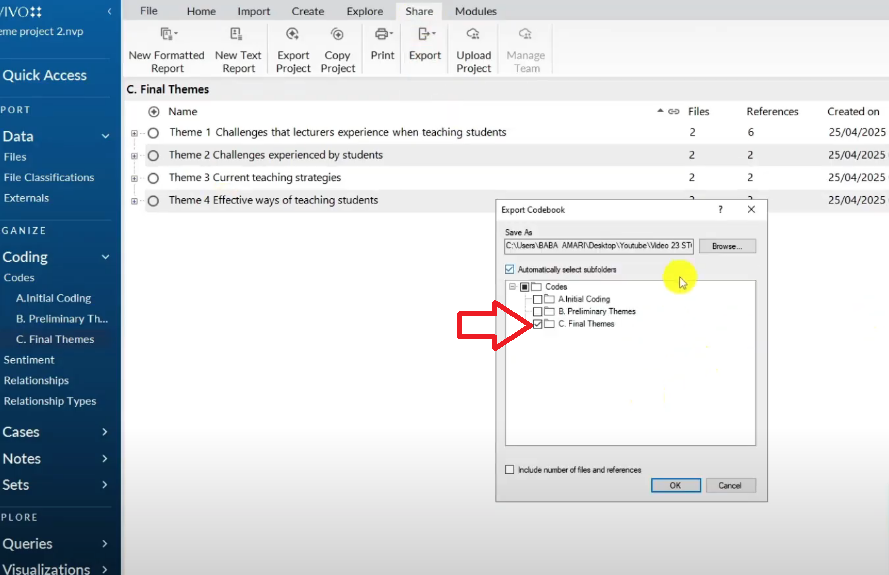
And you can see this is the code book that we have exported.
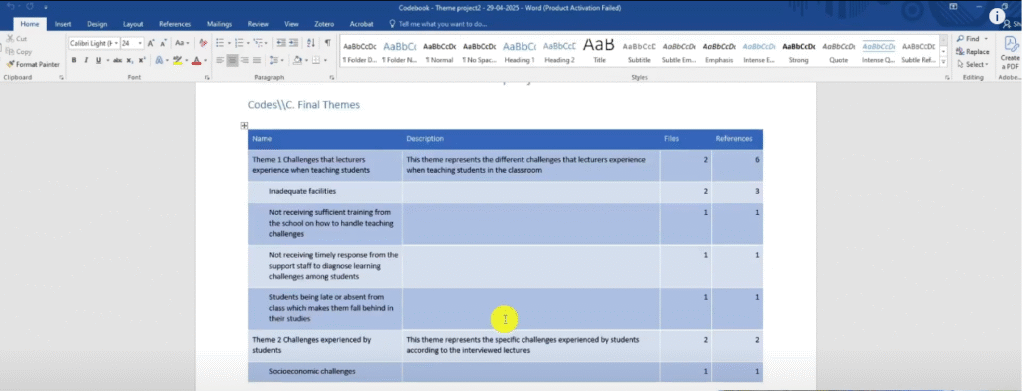
we will drew a code book because we need to explain everything.
Data analysis process
So the first thing that I will do will be to explain the data analysis process in my findings report.
And then report the findings.
Let’s do exactly that, let me open a blank word document and let’s start.
Data analysis process.
So this is the first section of the findings report.
Here we are going to explain the steps we used to analyze our data.
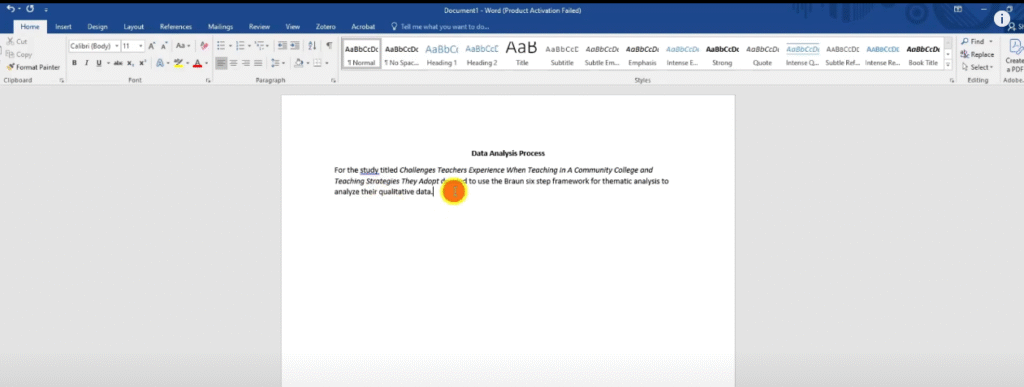
For instance for this study which is titled Challenges Teachers Experience when Teaching in a Community College and Teaching Strategies they adopt.
We used the inductive thematic analysis.
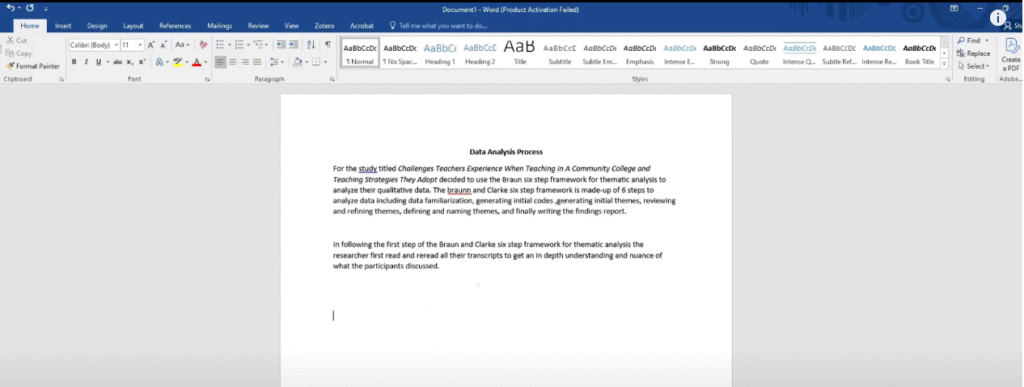
So let’s write about our data analysis process:
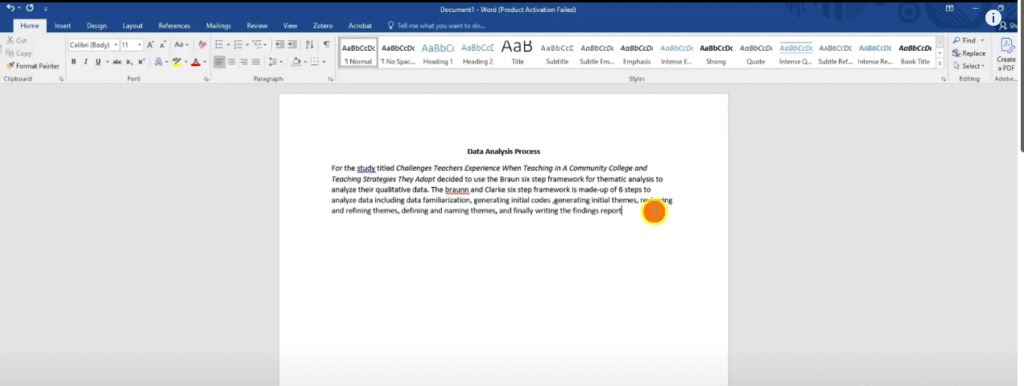
For the study titled challenges Teachers Experience when teaching in a Community College and Teaching Strategies they adopt, the researcher decided to use the Braun and Clarke six-step framework for thematic analysis to analyze the qualitative data.
The Braun and Clarke six-step framework is made up of six steps to analyze data including data familiarization, generating initial codes, generating initial themes, reviewing and refining themes, defining and naming themes and finally writing the findings report.
So here what I’m trying to do is to just explain the approach I used step by step and provide evidence.
Data familiarization, generating initial codes, generating initial themes, reviewing and refining themes, defining and naming themes and finally writing the findings report.
So I’m explaining what I did
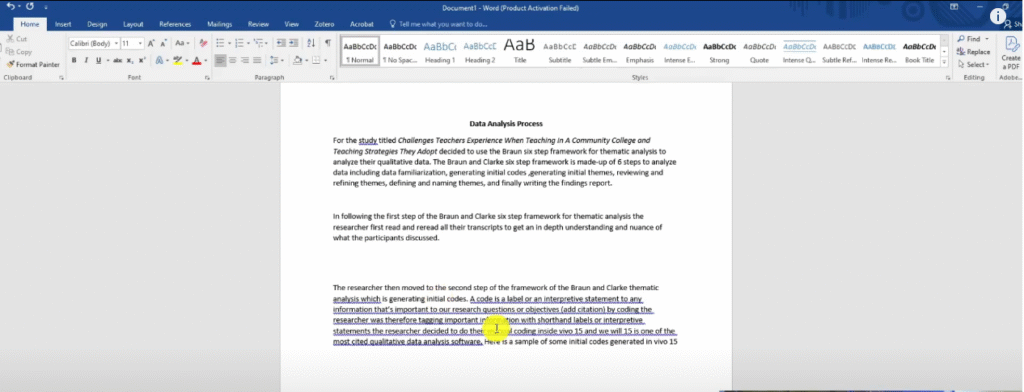
In following the first step of the Braun and Clarke six-step framework for thematic analysis the researcher first read and re-read all their transcripts to get an in-depth understanding and nuance of what the participants discussed.
So that’s the first step.
Let’s write about the second step.
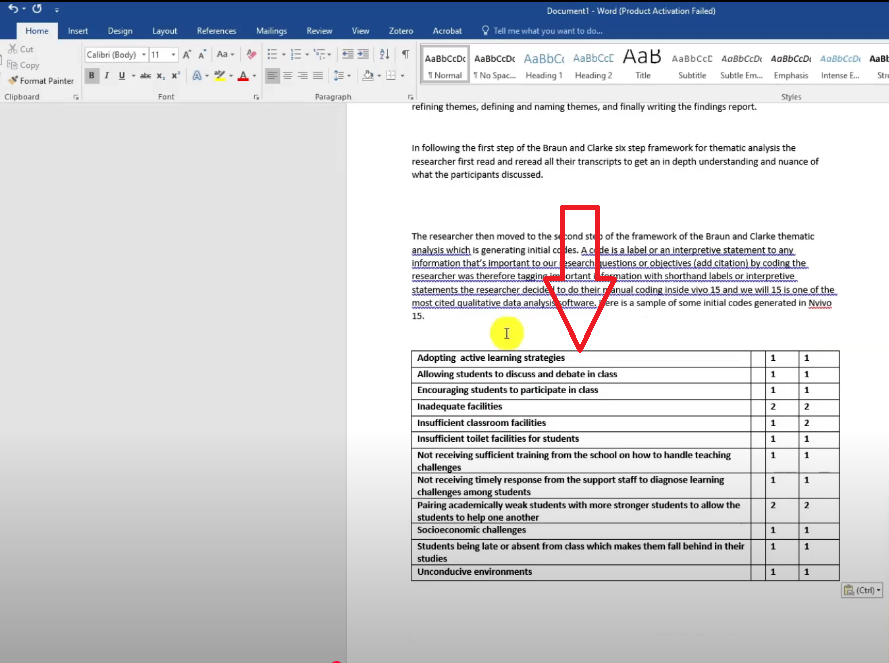
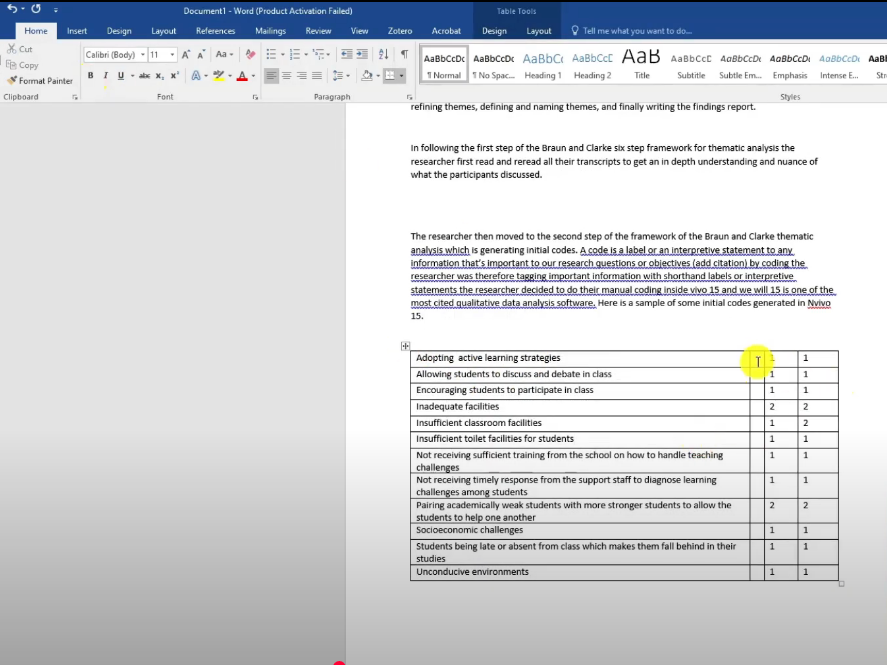
The researcher then moved to the second step of the Braun and Clarke six step framework for thematic analysis, which is generating initial codes.
A code is a label or an interpretive statement to any information that’s important to a research questions or objectives.
By coding the researcher was therefore tagging important information with shorthand labels or interpretive statements in the coding process.
The researcher decided to do their manual coding inside N-Vivo 15.
N-Vivo 15 is one of the most cited qualitative data analysis software.
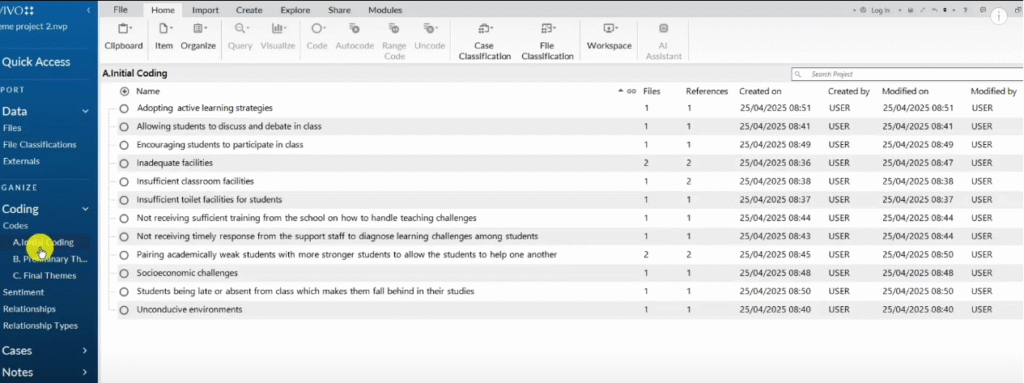
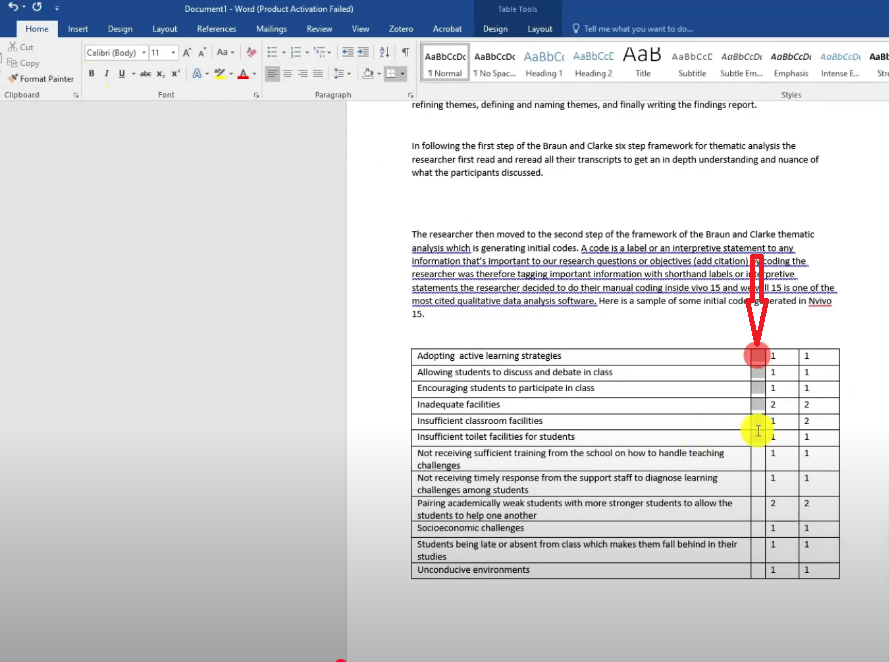
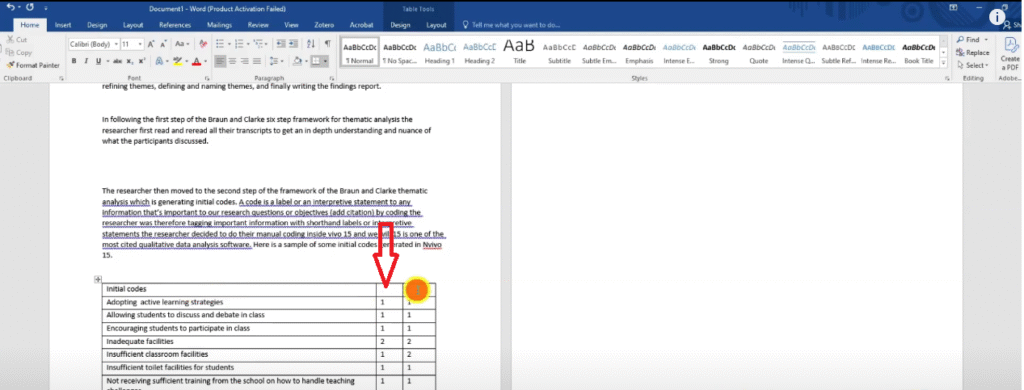
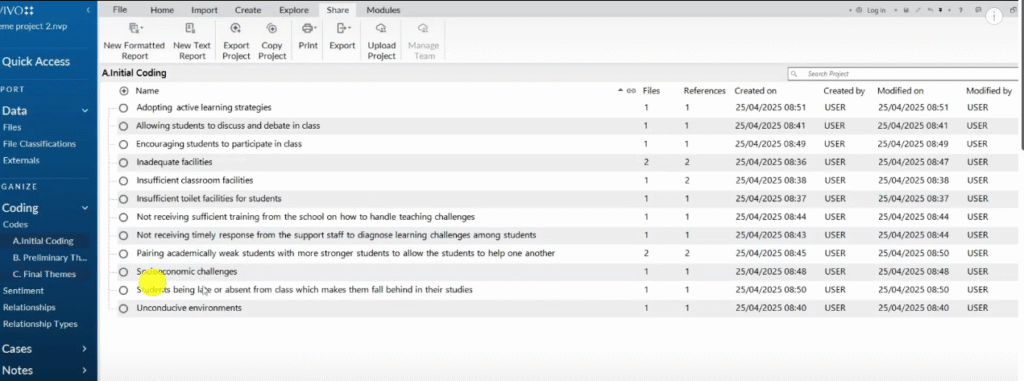
Here is a sample of some initial codes generated in N-Vivo 15.
Here I’m writing the second step that i used.
I’ll just stop there ’cause we can’t do the whole transcript like this.
I’ll go and do the whole report then I will attach it.
So what I would be doing here is explain every step that I used in the Braun and Clarke six-step framework to come up with my themes and provide evidence.
So here is a sample of some initial codes generated in N-Vivo 15.
When I say here is a sample of some initial codes I have to go and find the codes.
How to export tables from N-Vivo 15
Let me show you how you get the codes.
If you go back to the N-Vivo.
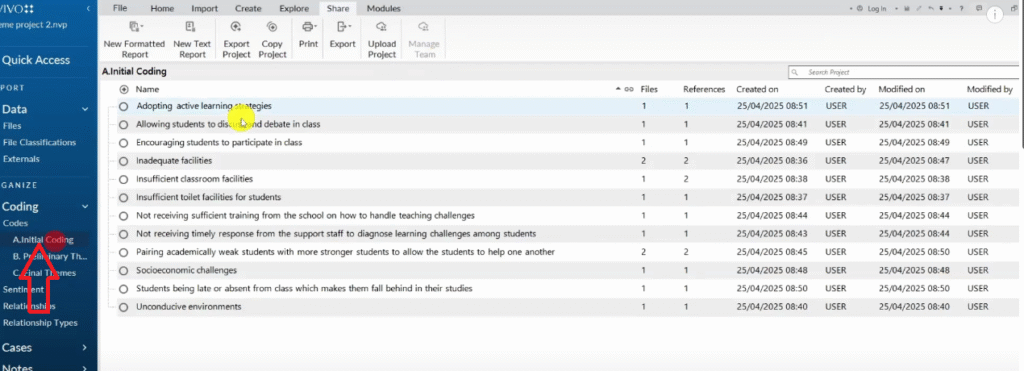
Go to the initial coding section.
Command A or control A.
Go to export.
Then export list.
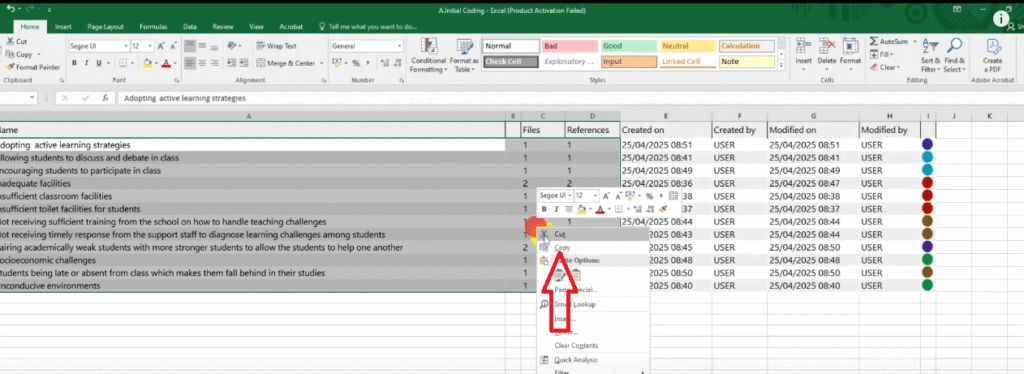
This is how we export the initial code.
I go back to my folder and open this.
You can see I have some initial codes.
I can highlight that including the files and references then copy it and use this table to show some initial codes.
So I paste this like that.
Of course it’s in bold I don’t like it in bold.
So let’s just remove the bold.
Then I highlight this.
I delete this column.
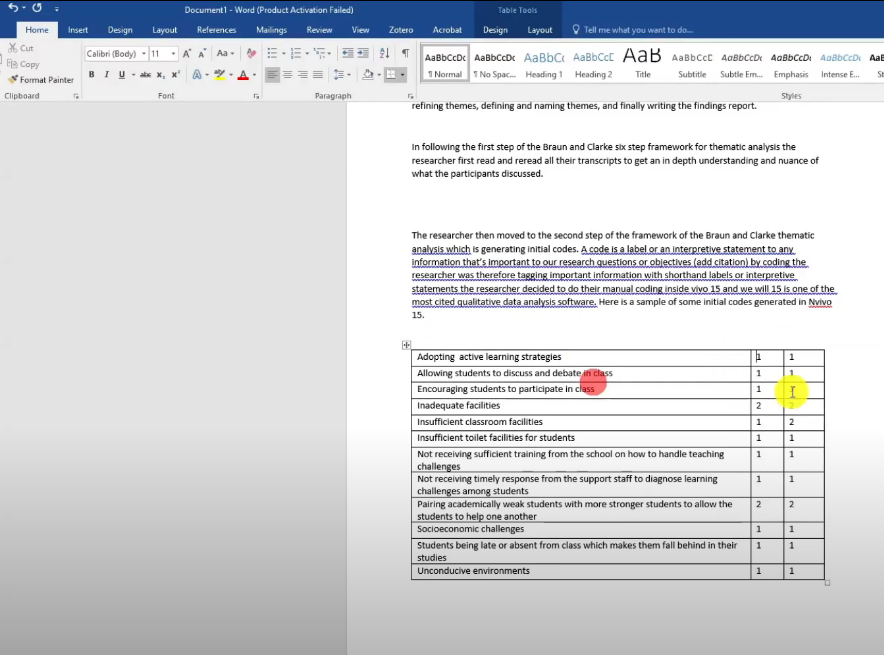
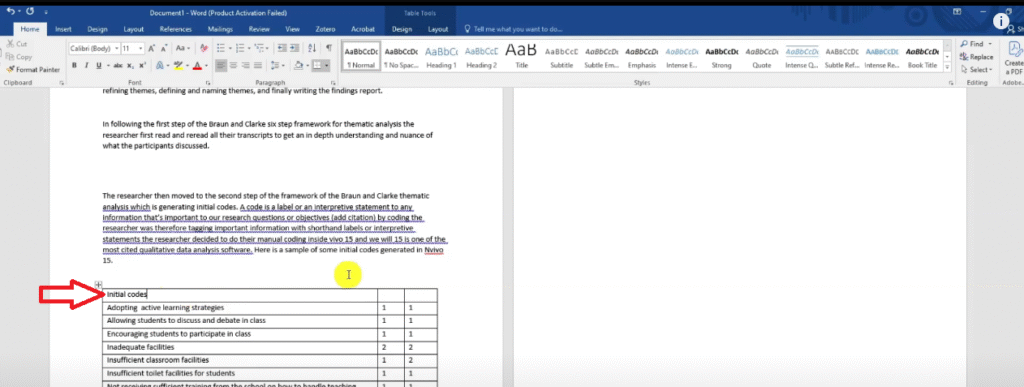
Then I insert another row above
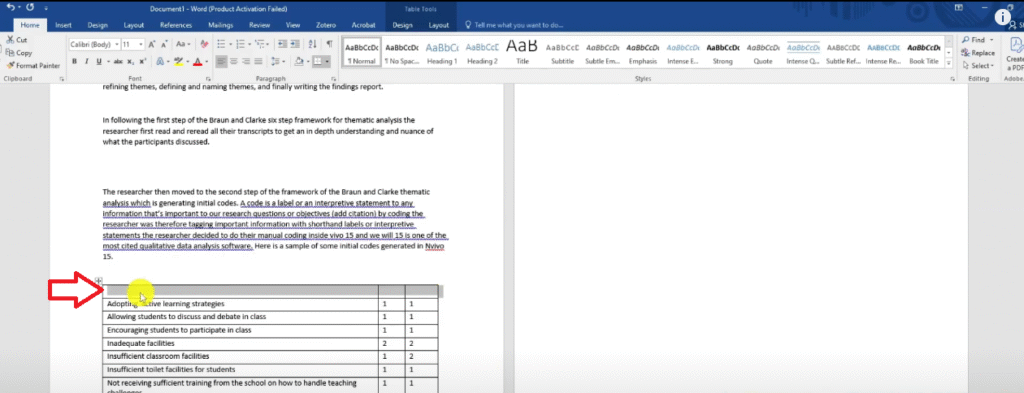
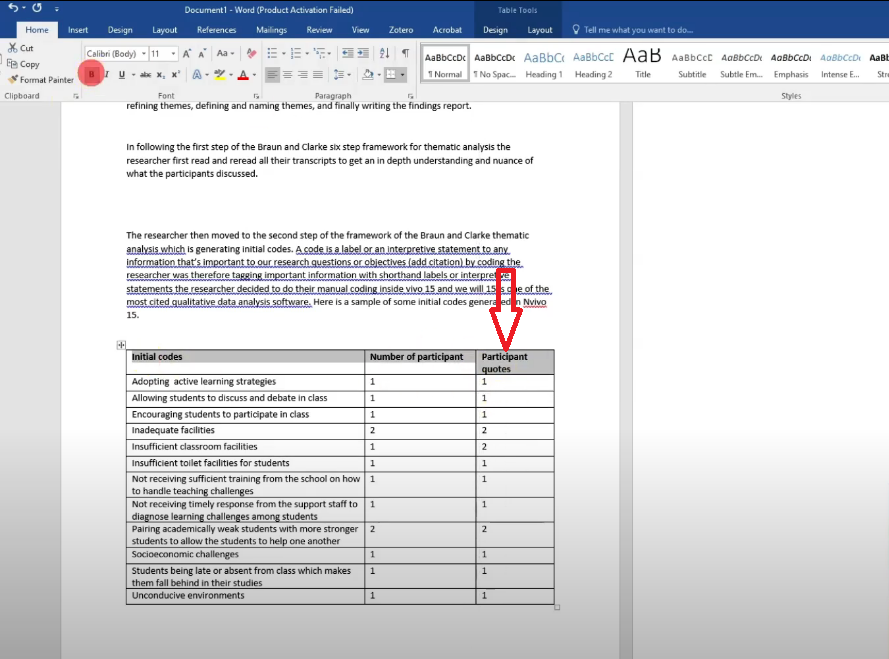
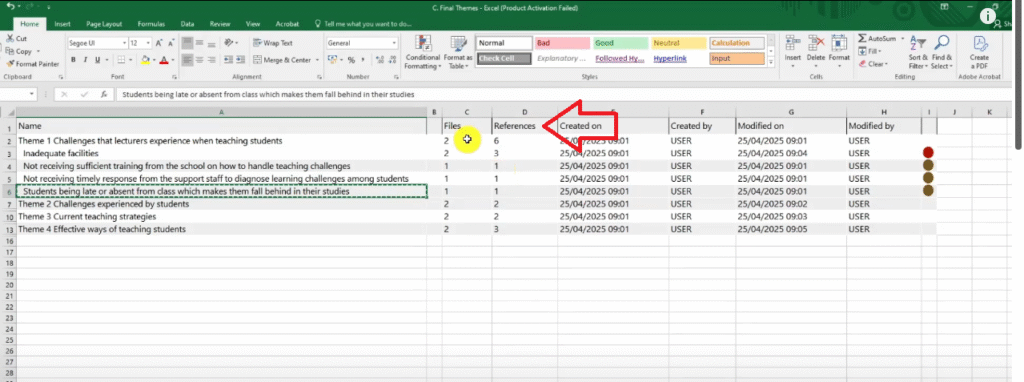
I call these initial codes
Remember this one was labeled files
And this one was labeled references.
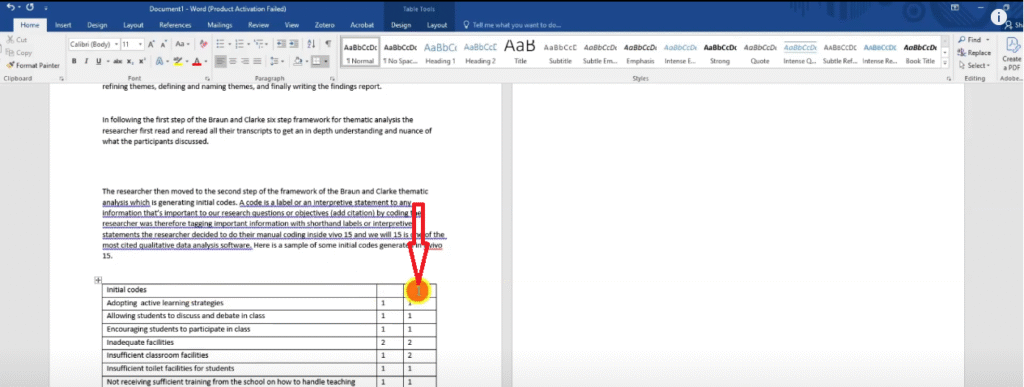
The references are the number of quotes so I don’t like calling them files.
I call this column number of participants.
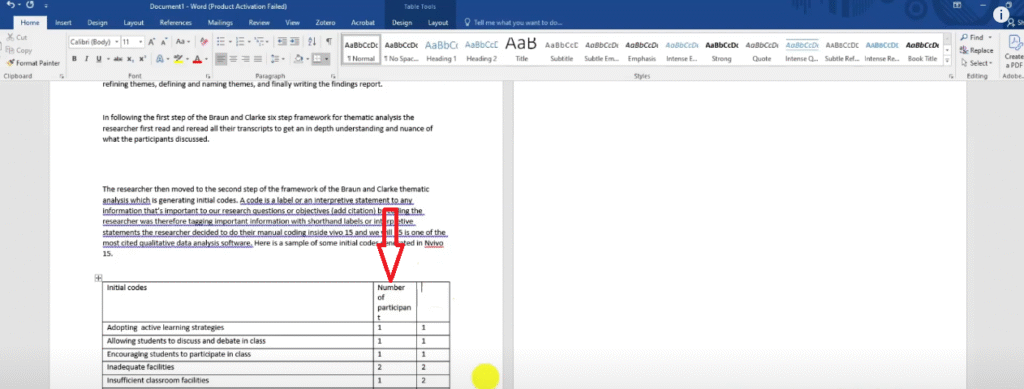
And I call the other column participant quotes.
So basically that’s how I write.
Then I’ll come back and proofread this and add citation.
Then I’ll go and highlight all the six steps and provide evidence.
Now let’s go to the third step.
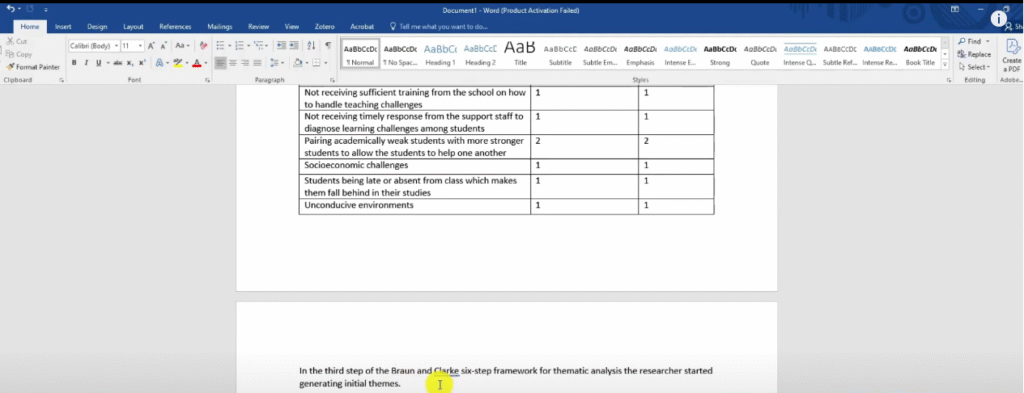
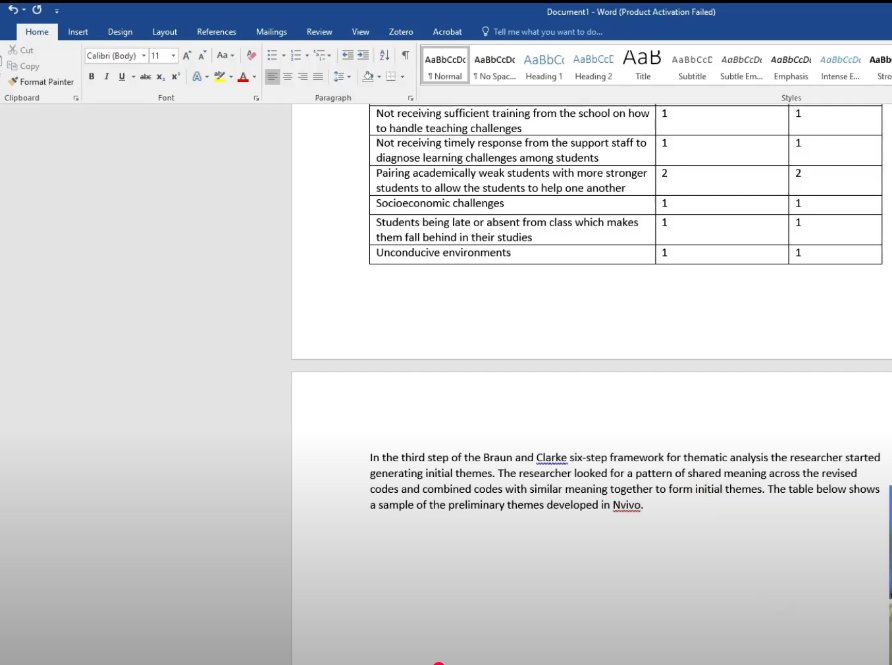
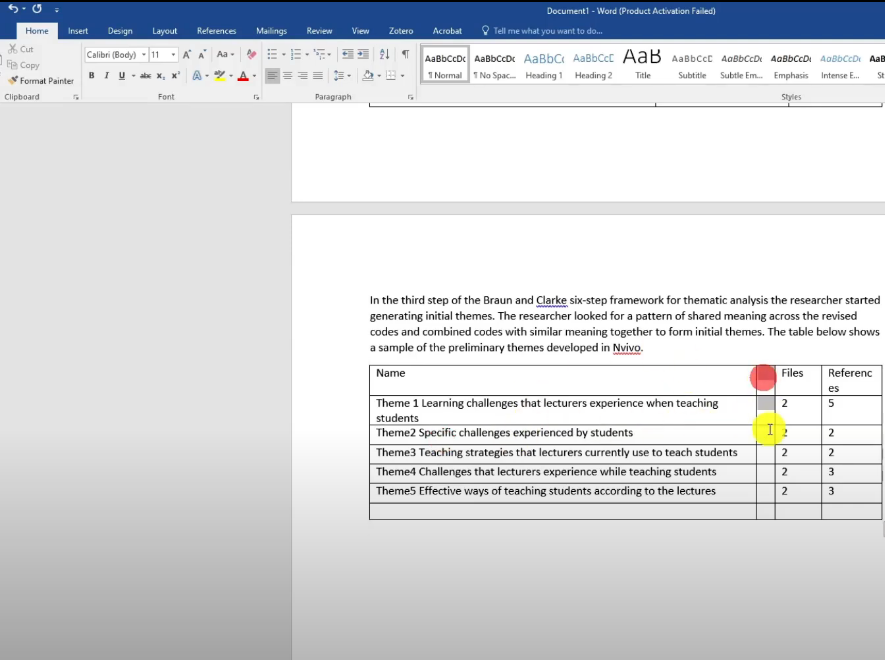
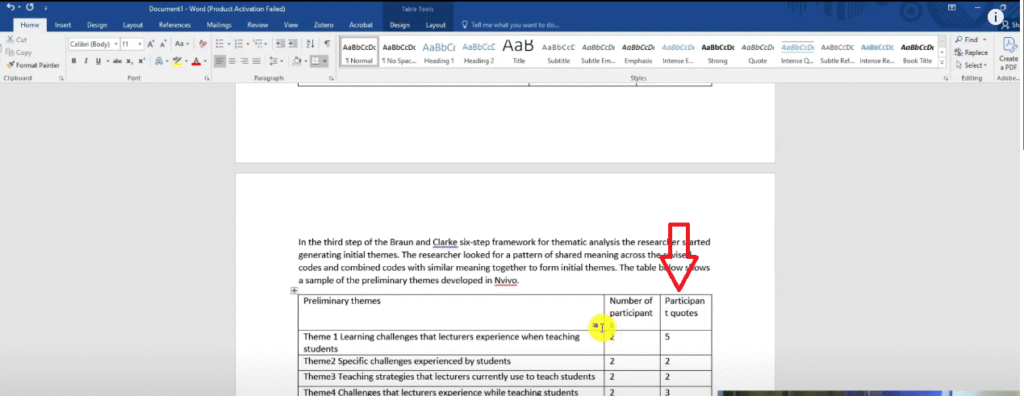
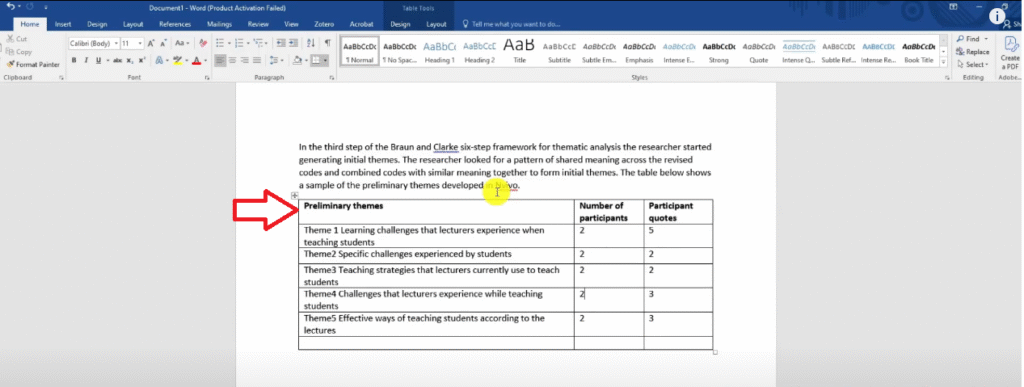
In the third step of the Braun and Clarke six-step framework for thematic analysis, the researcher started generating initial themes.
Let’s explain how we got themes.
The researcher looked for a pattern of shared meaning across the revised codes and combined codes with similar meaning together to form initial themes.
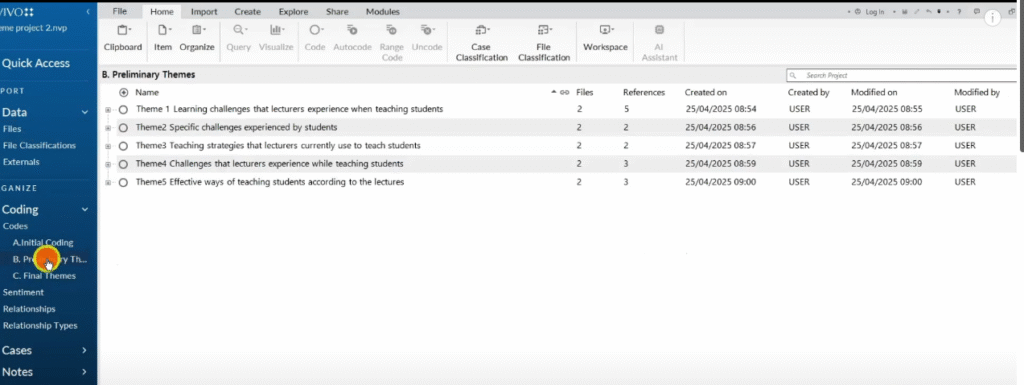
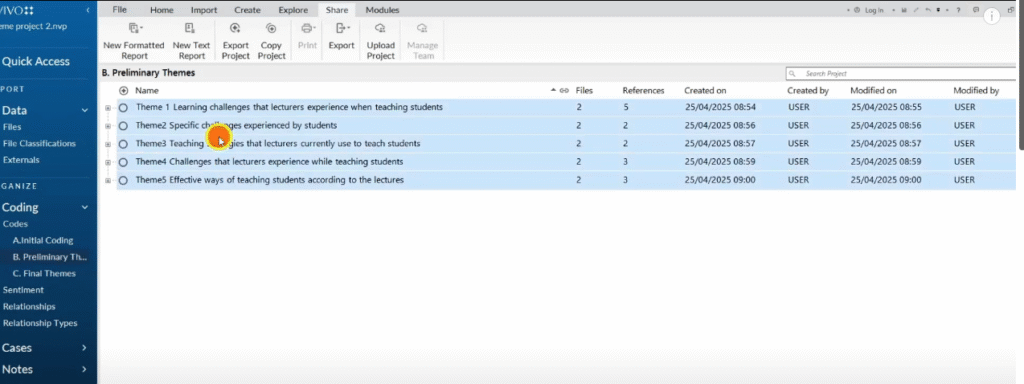
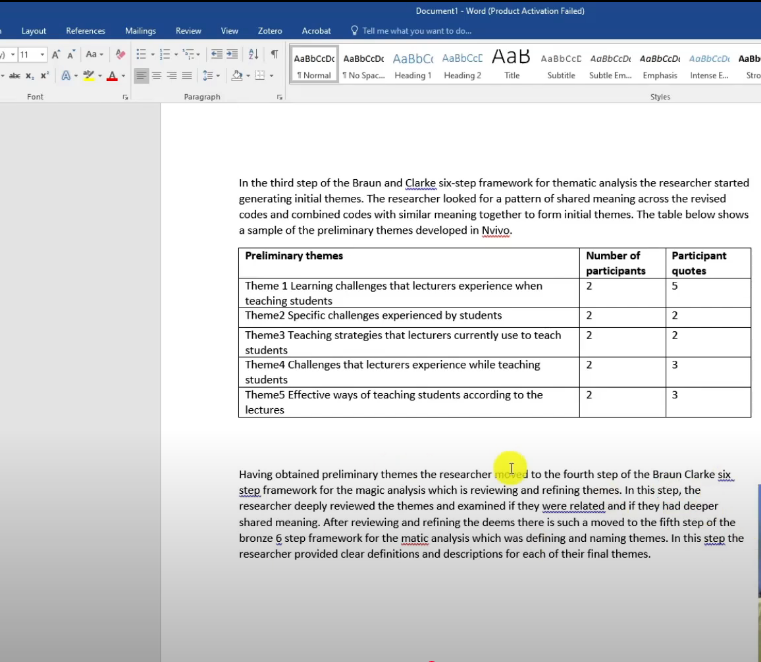
The table below shows a sample of the preliminary themes developed in N-Vivo.
So I’m going again to go to N-Vivo.
So I’m just showing you how to export all these things that we had before.
Go to preliminary themes.
Command a right click.
Highlight this and copy.
Then come and paste that.
Delete entire column.
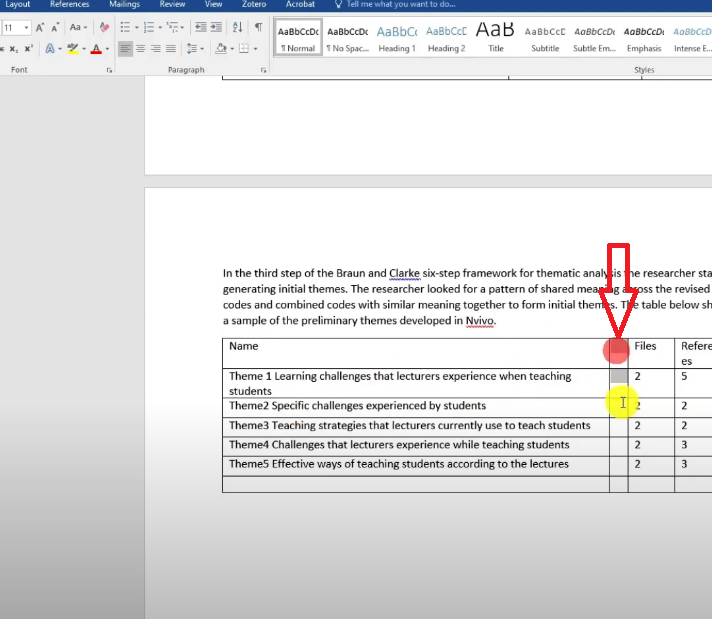
Then rename these to preliminary themes.
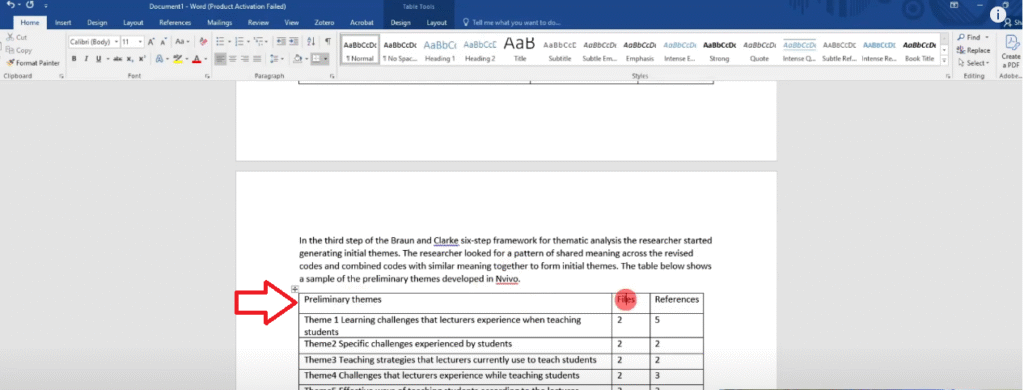
Again we want to rename files to number of participants because these are the number of participants.
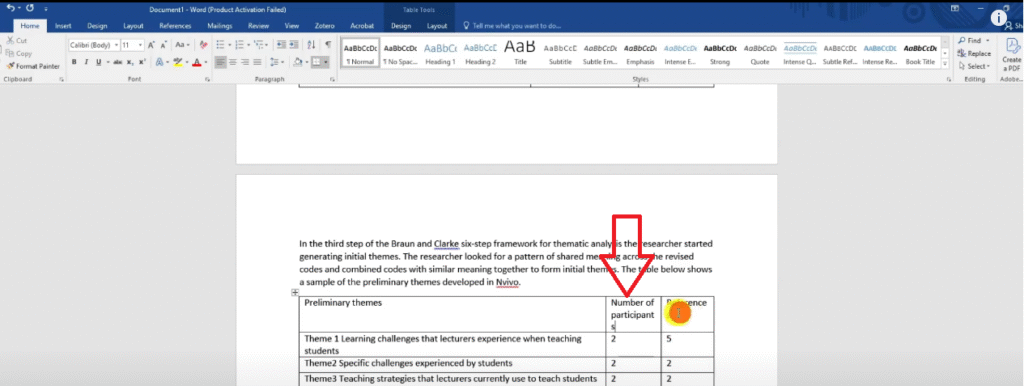
Then rename references to Participant quotes.
So that’s another table.
Let’s format it well let’s put the top section in bold.
You can see what I’m doing, I’m providing evidence of following the Braun and Clarke six-step framework.
Which is the first part of the findings report in the data analysis process.
Some people will move this to the methodology section which is okay but it depends with the guidelines that you’re following.
Then if there’s an extra row like this I just delete that.
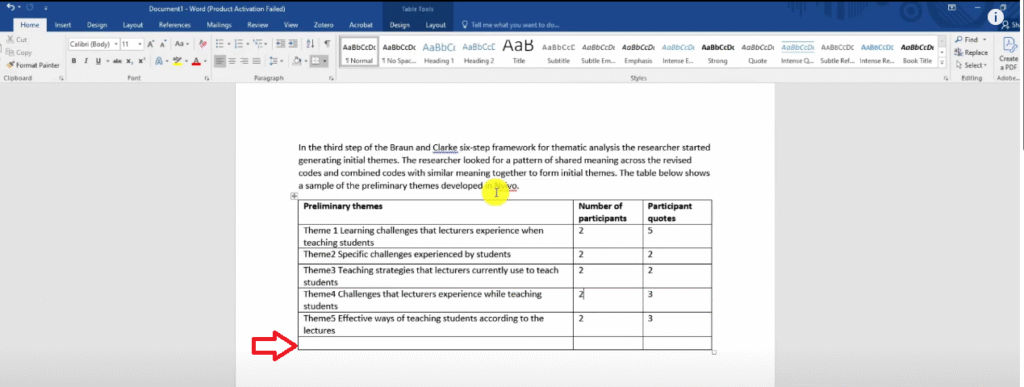
So those are preliminary themes.
Let’s keep going.
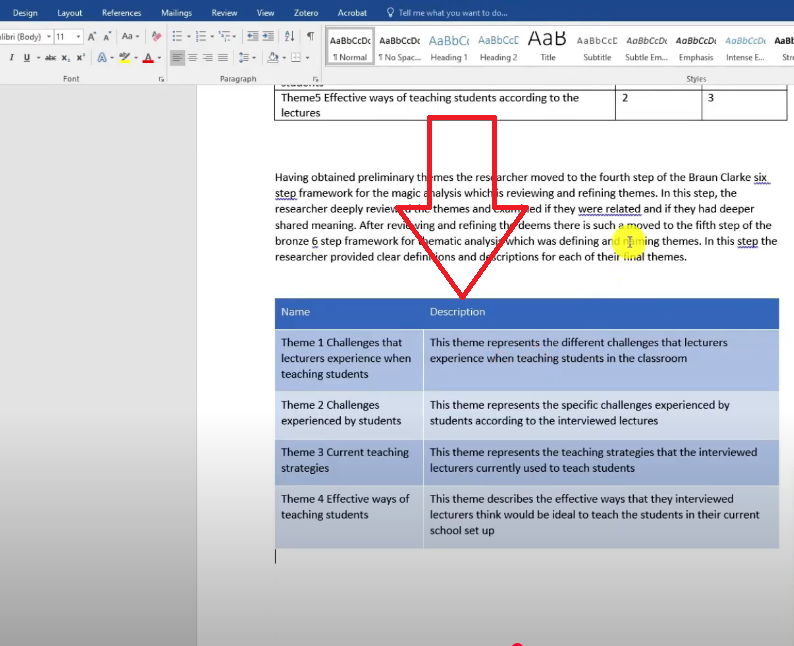
Having obtained preliminary themes, the researcher moved to the fourth step of the Braun and Clarke six-step framework for thematic analysis which is reviewing and refining themes.
In this step the researcher deeply reviewed the themes.
And examined if they were related and if they had deeper shared meaning.
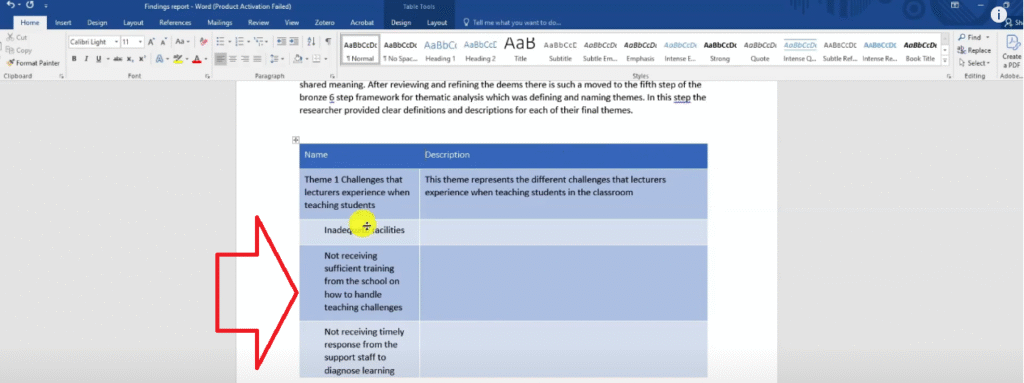
After reviewing and refining themes, the researcher moved to the fifth step of the Braun and Clarke six-step framework for thematic analysis which was defining and naming themes.
In this step the researcher provided clear definitions and descriptions for each of their final.
I’ll go and edit and I’ll provide the full findings report as an attached resource so that you can go and look at it and try to imitate it.
I will go and write the whole report and proofread it.
So ensure that there are no mistakes and everything.
Provide the right citations for these steps ’cause we need to cite
For example when you talk about the sixth step of the Braun and Clarke, we need to go and cite Braun and Clarke.
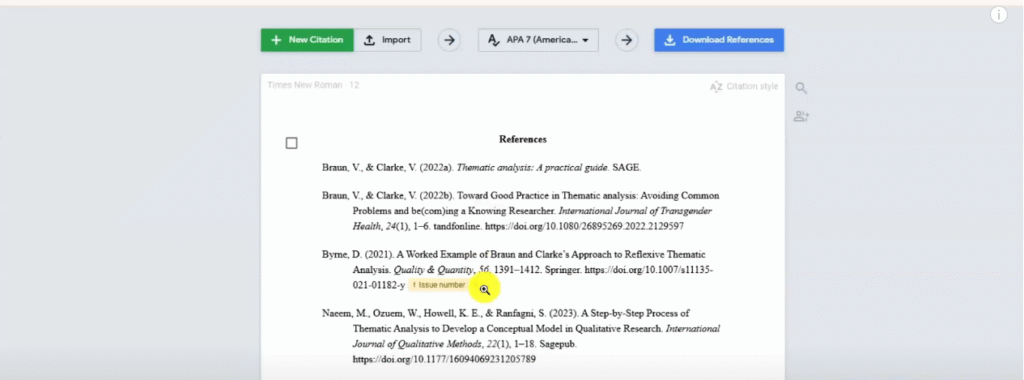
This is the citations list.
So I’ll go and cite Braun and Clarke because these are the citations where I got the approach.
So I have to cite well in my introductory section.
I want to provide the tables.
We said we provided clear descriptions.
So let’s do that.
So where do we get them?
Remember I exported a code book here.
I can go and copy the whole of it paste it in my findings report.
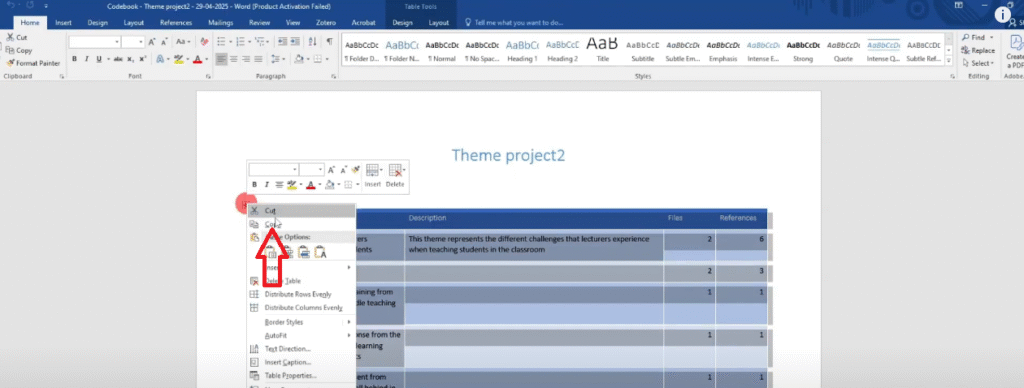
And then I can delete sections I don’t like.
For instance, I don’t want to present the columns here.
I want to delete those two columns.
Then I want to delete all the codes and be left with only the themes and their description because that’s what I want to show.
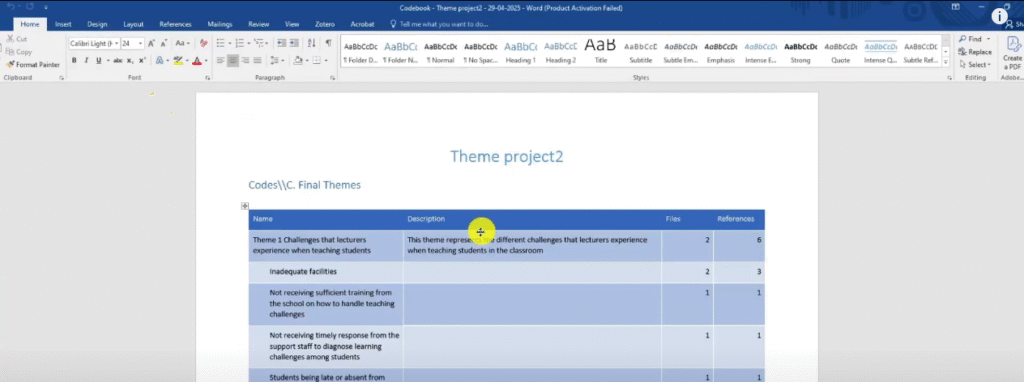
So I remove all rows and I’m left with only the themes and their descriptions.
This is basically their themes and their descriptions.
So after I’ve explained that, I provide the descriptions.
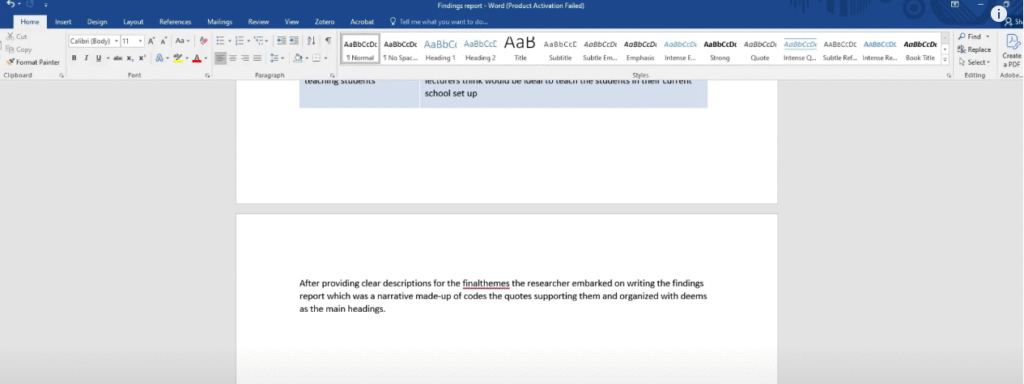
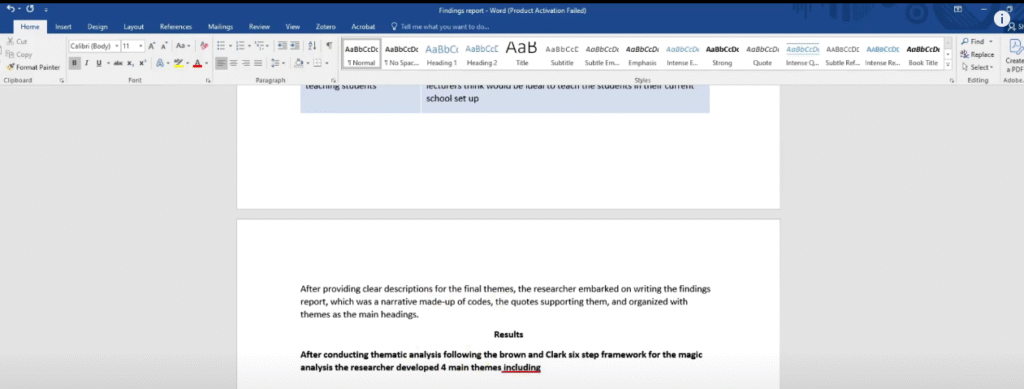
Then I’ll go to the final step which is writing the findings report.
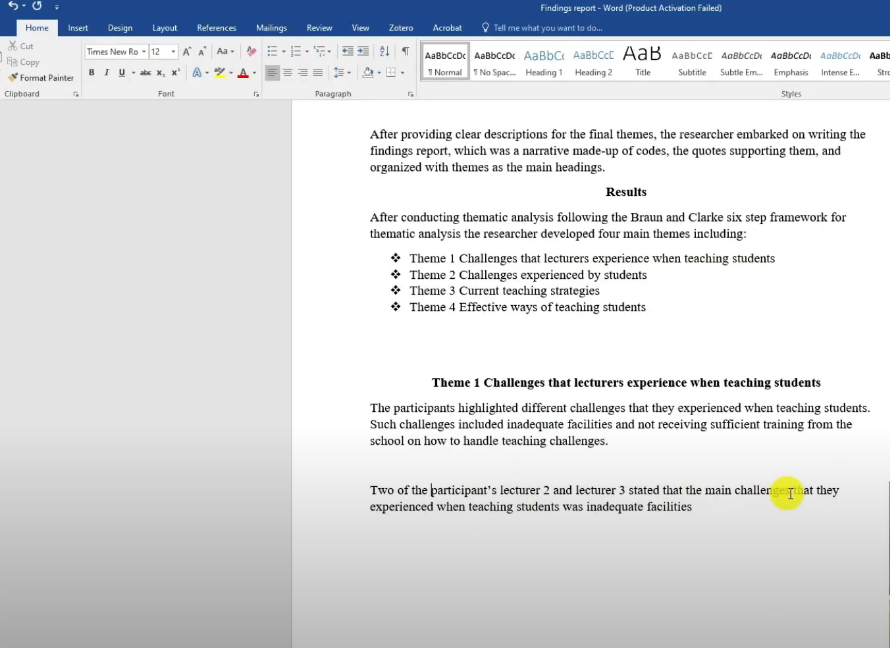
After providing clear descriptions for the final themes, the researcher embarked on writing the findings report a narrative was made up of codes the quotes supporting them and organized with themes as the main headings.
Now I start presenting the results so I’ll have another section called results
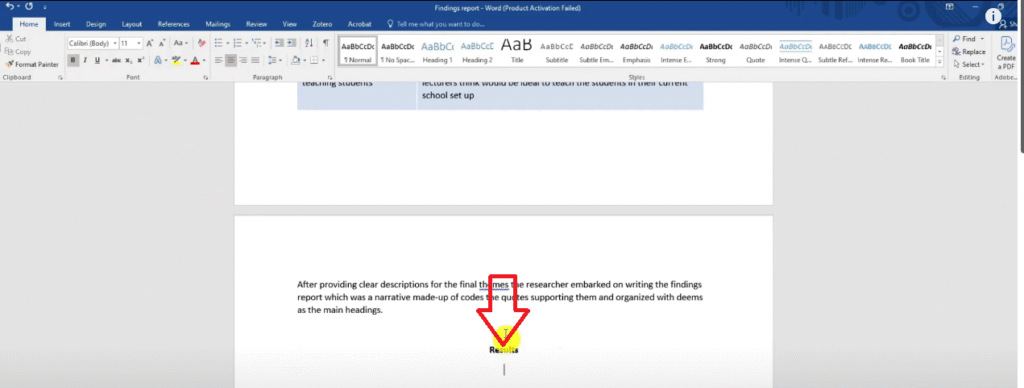
After conducting thematic analysis, we have to present the results.
And the results are the themes.
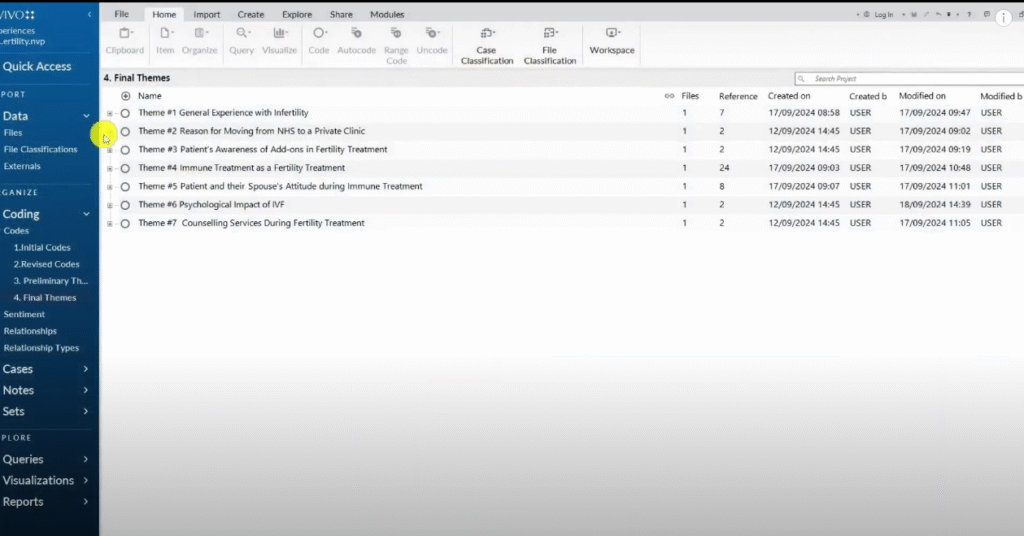
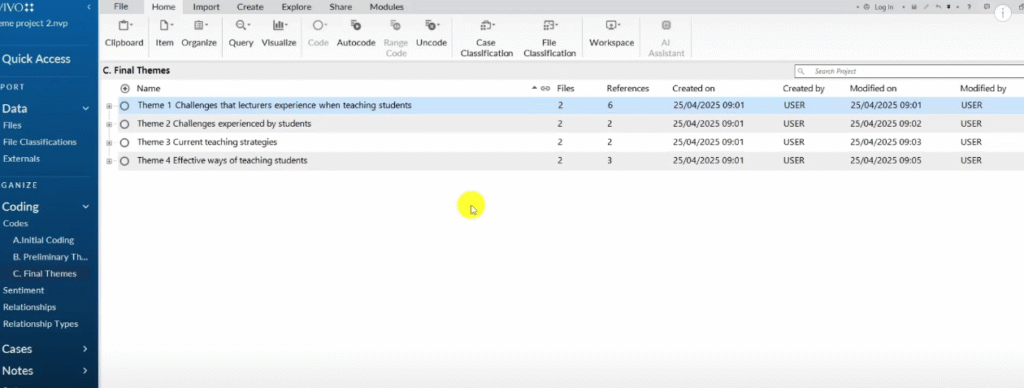
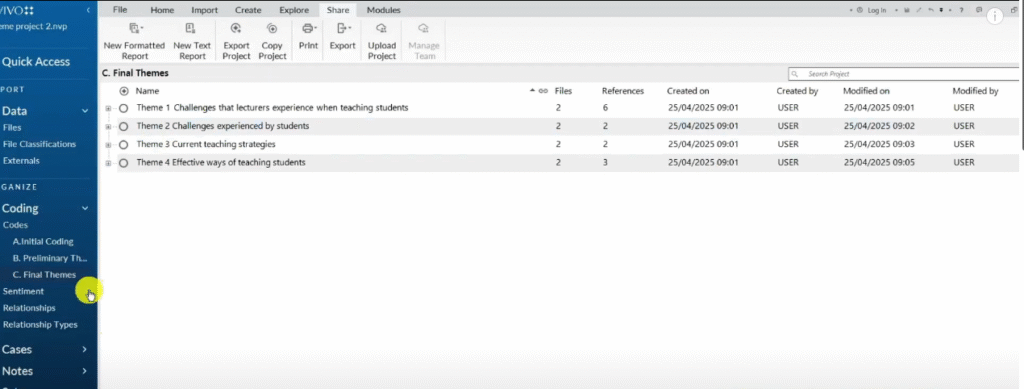
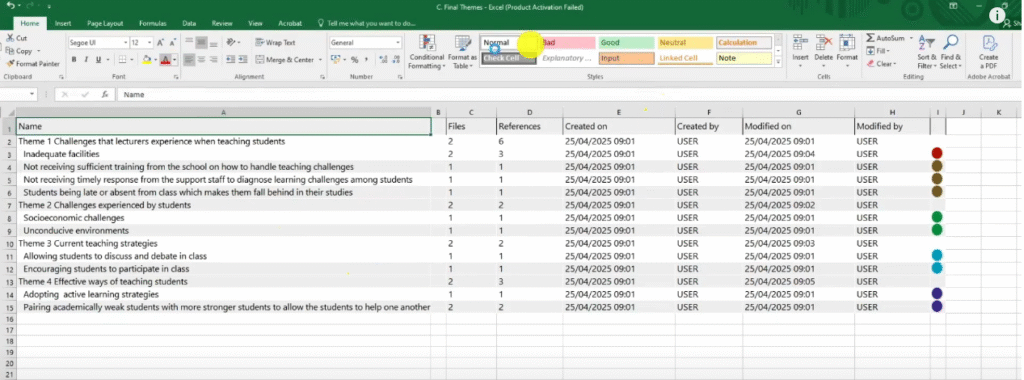
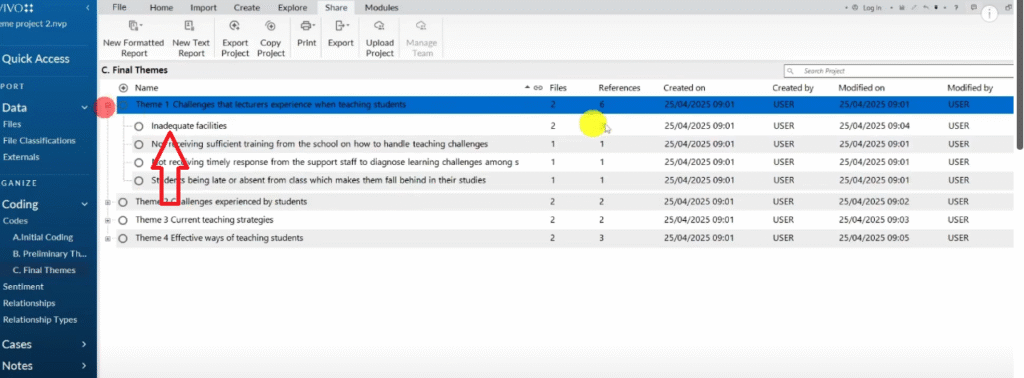
Look at the themes these are the final themes.
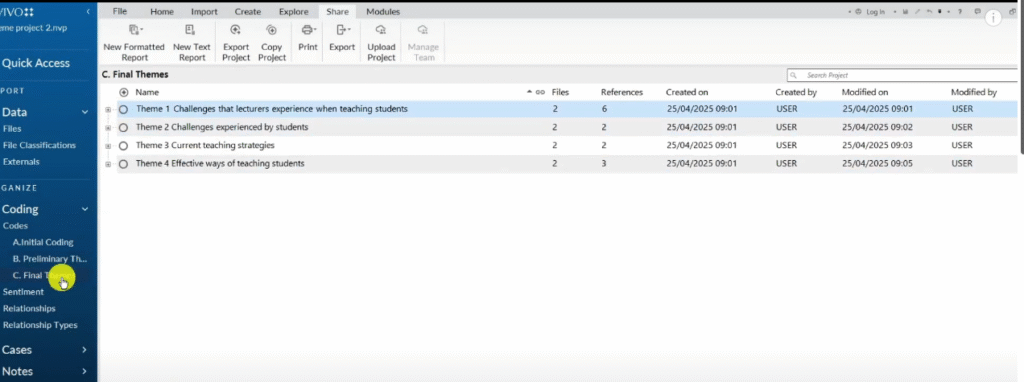
Remember, we click on the final themes section.
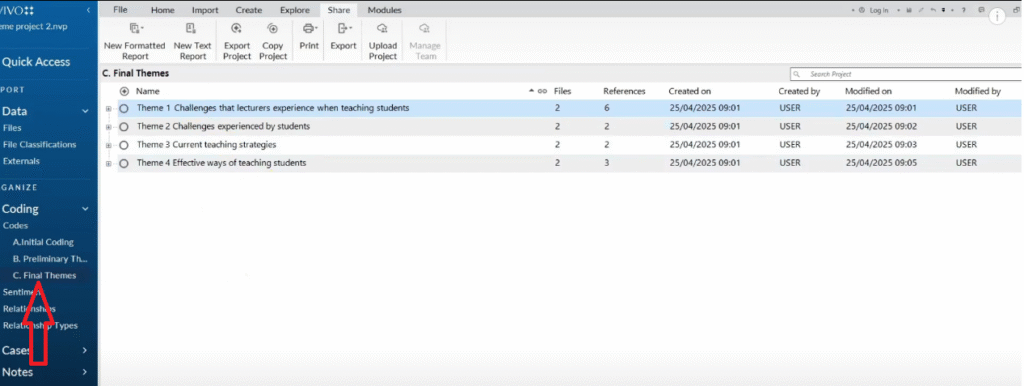
We have four themes now let me explain.
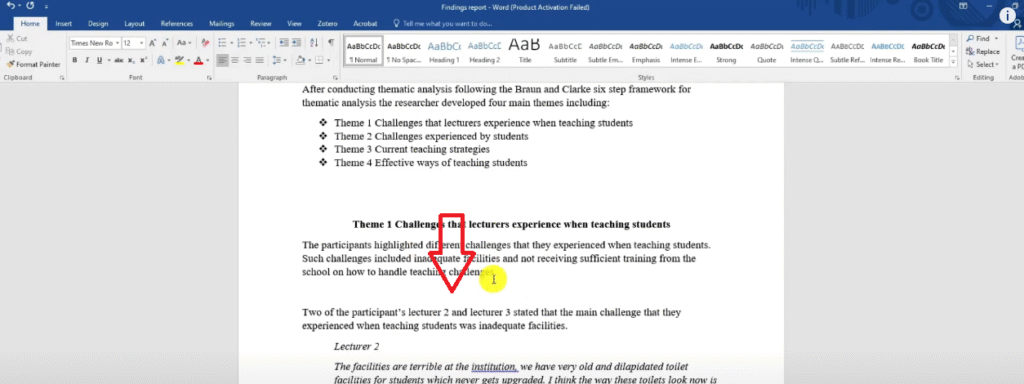
After conducting thematic analysis following the Braun and Clark six step framework for thematic analysis, the researcher developed four themes including:
Now we are going to get our four themes.
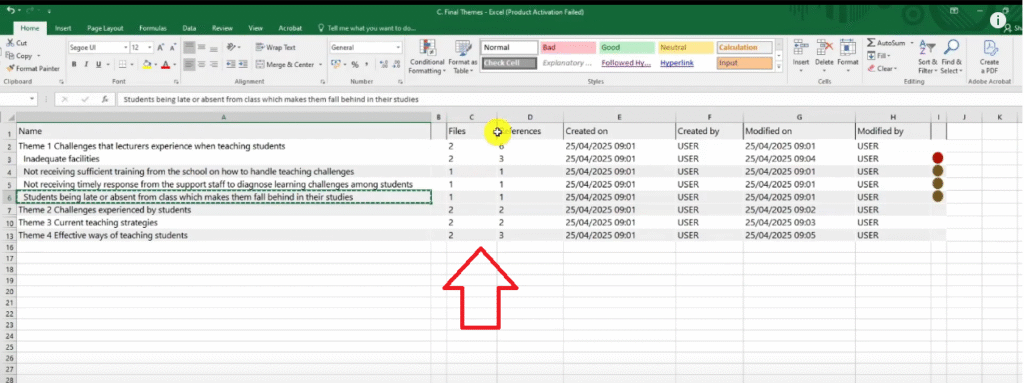
You remember we exported the final themes here as an Excel list.
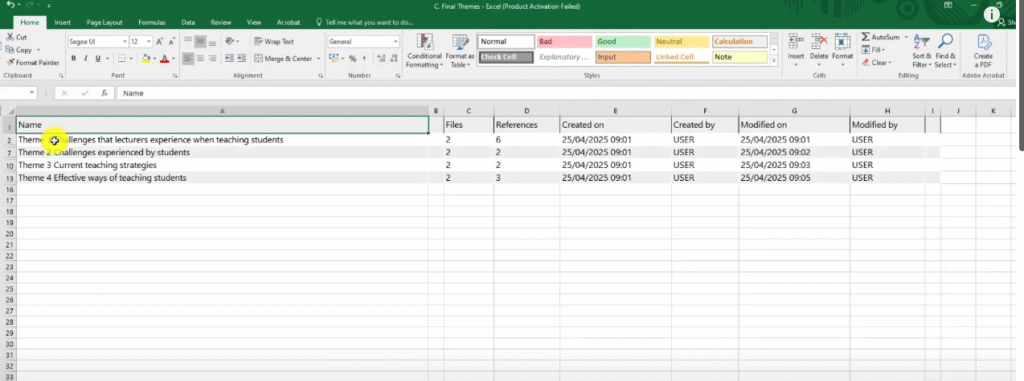
So I’m just going to copy this and paste it in my findings report.
I can paste this stuff without a table.
Just text then of course we don’t want them in bold.
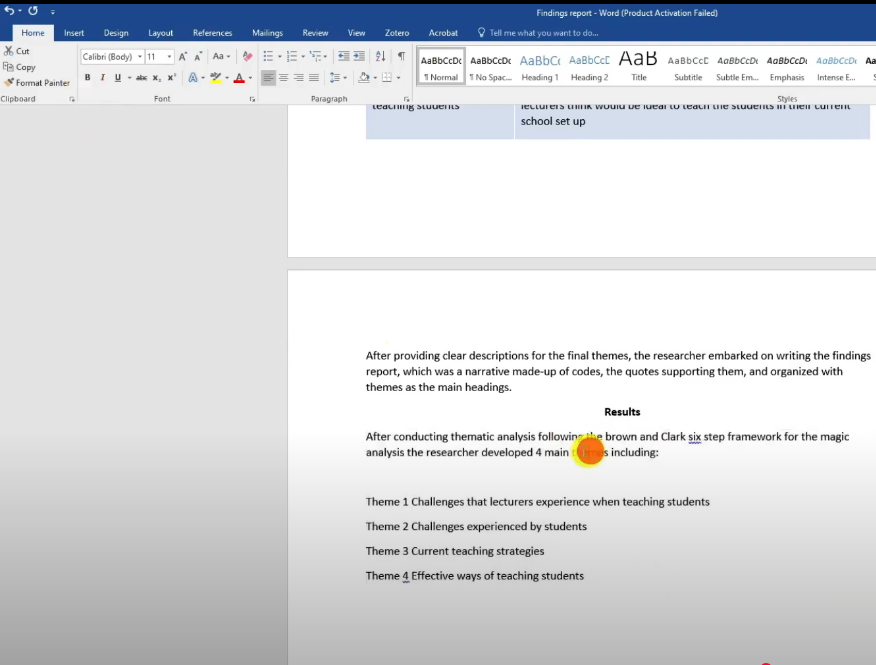
So this is how I put the themes after formatting.
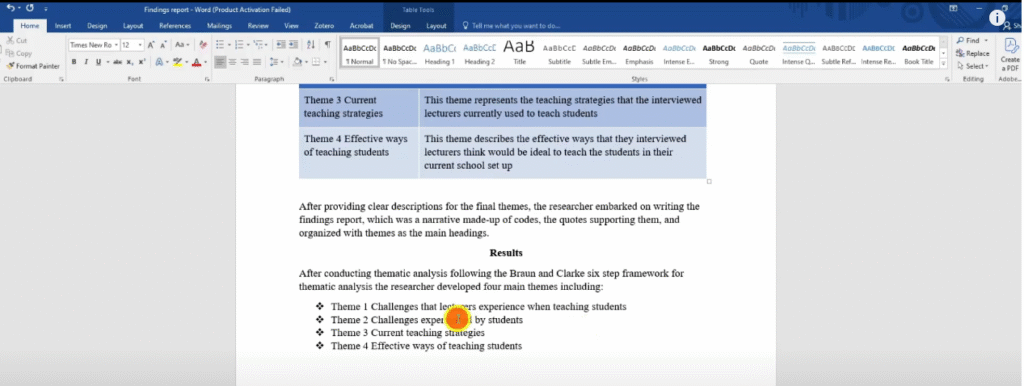
An image of how we represent our themes
Then I start introducing the themes.
The themes are the main headings.
Let’s copy theme 1.
Let’s put it in bold and then center align it.
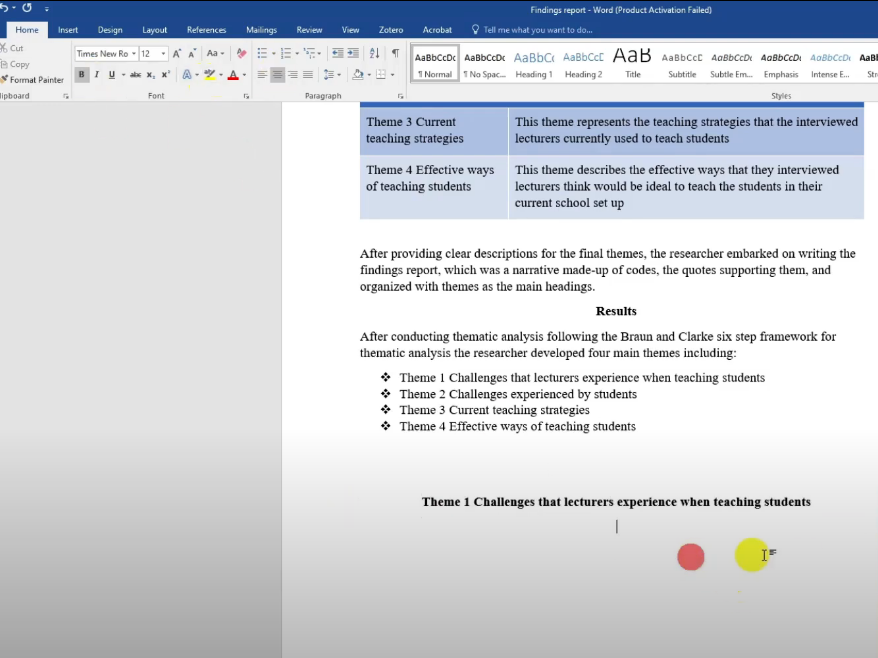
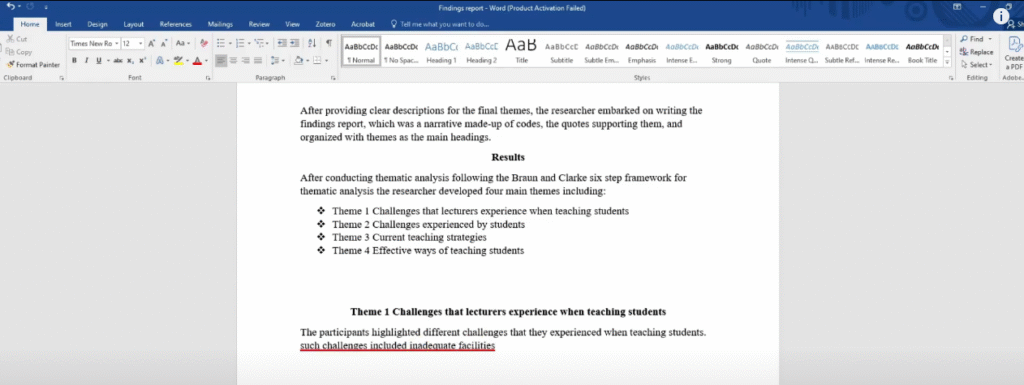
Now let’s write about theme 1.
How do we write about this?
We know the description so we use the description.
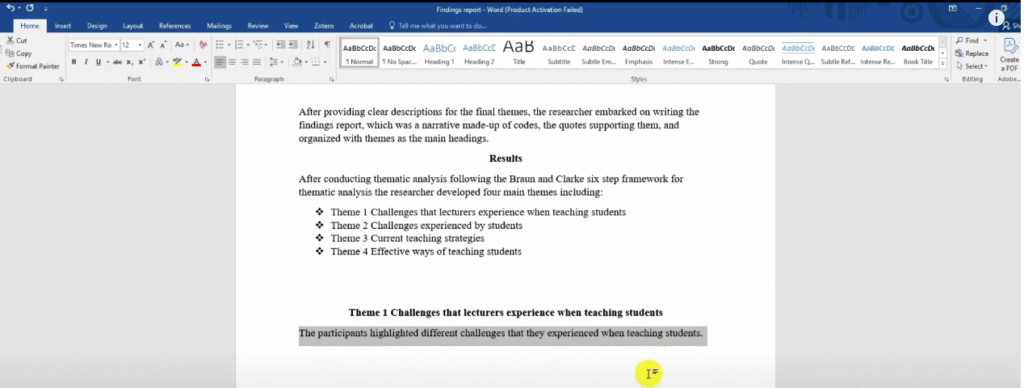
This theme represent the different challenges that lecturers experience when teaching students in the classroom,
But the report must be in past tense.
So let’s say this theme represented the different challenges.
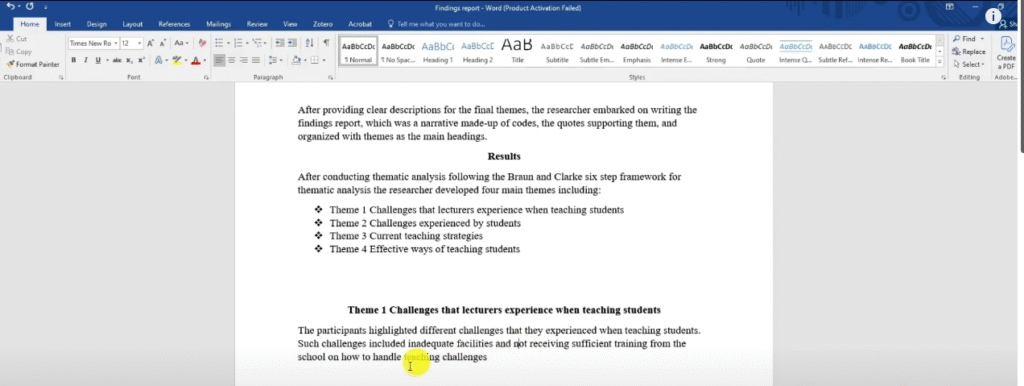
The participants, highlighted different challenges that they experienced when teaching students.
Then I say such challenges included inadequate facilities,
So let me explain further.
Such challenges included inadequate facilities.
I’m just highlighting two codes
And not receiving sufficient training from the school on how to handle teaching challenges.
That’s just an overall overview.
Now i want to go in there and explain the codes one by one.
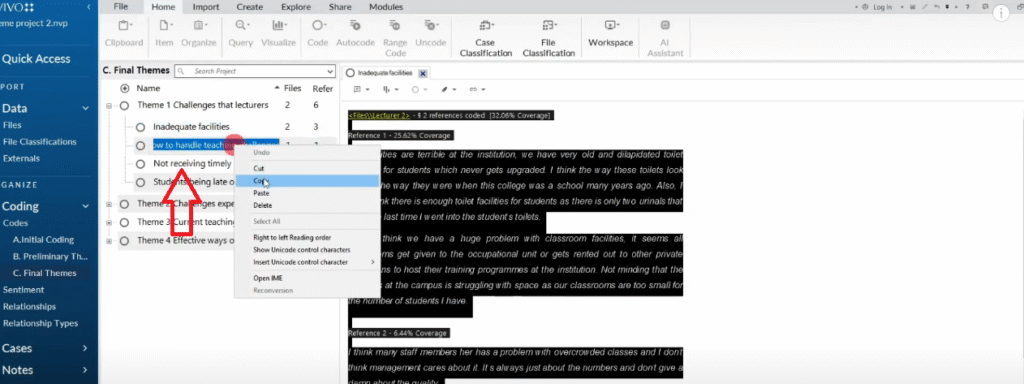
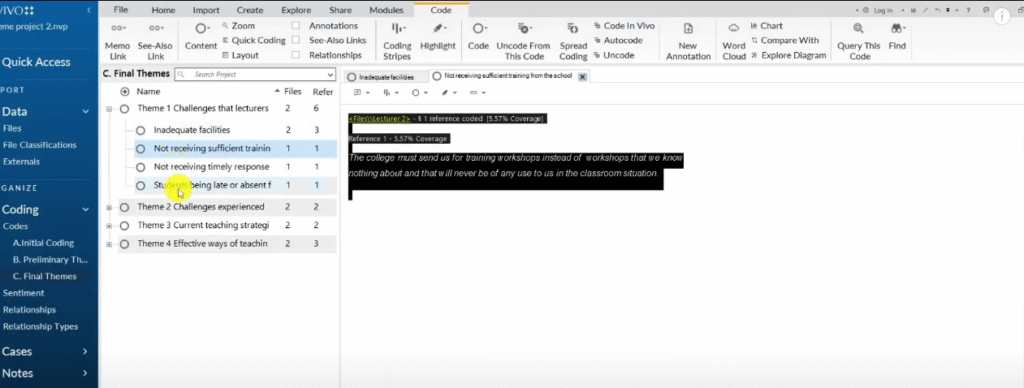
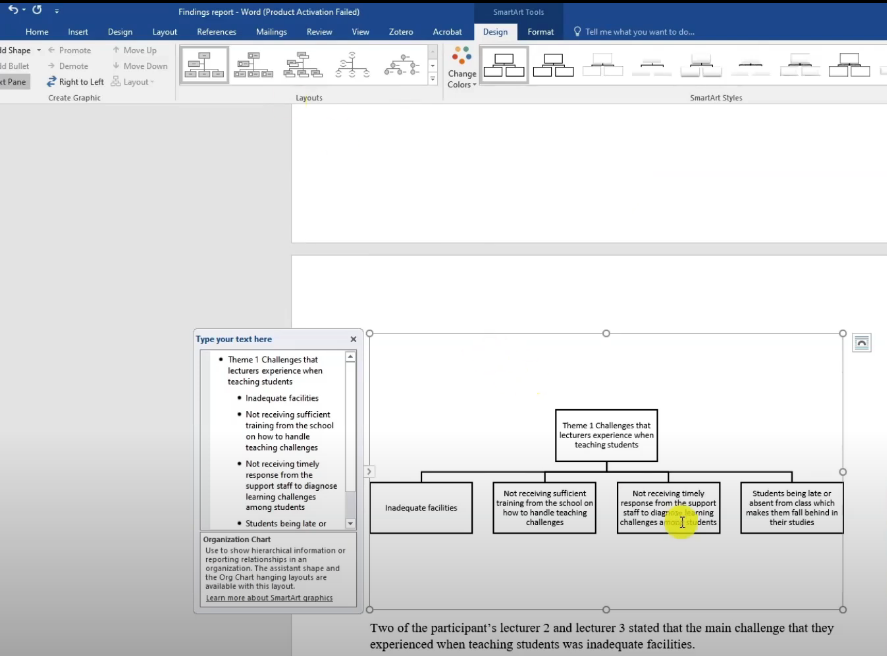
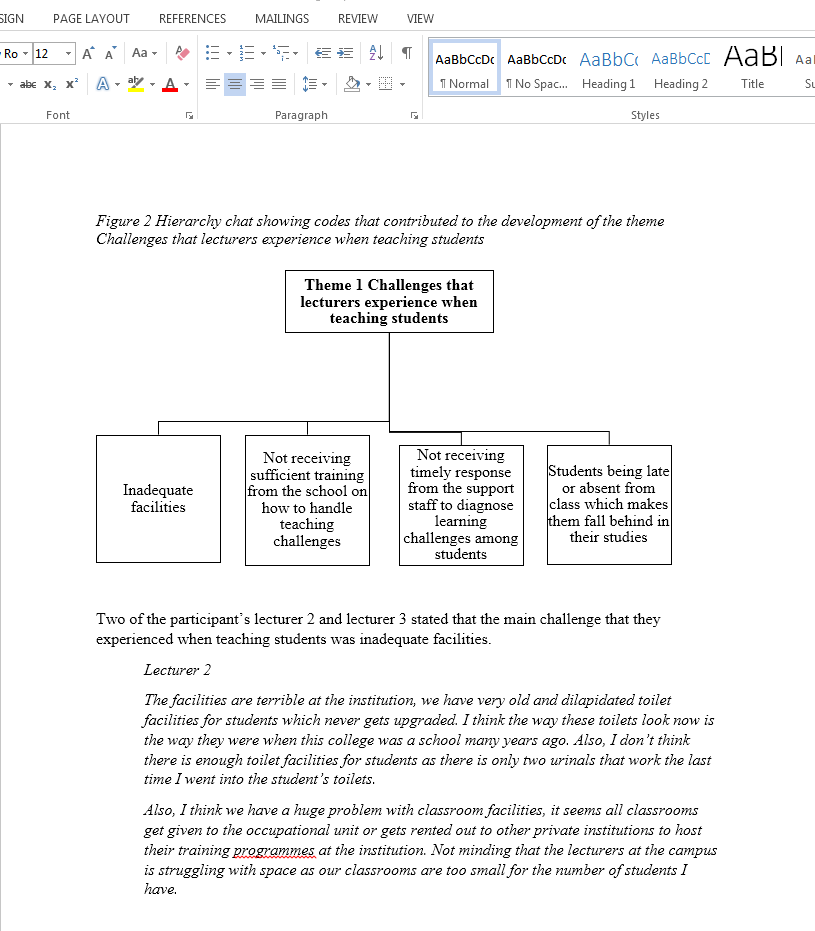
Now I say two of the participants.
Let’s double click on this code to see which participants we are talking about.
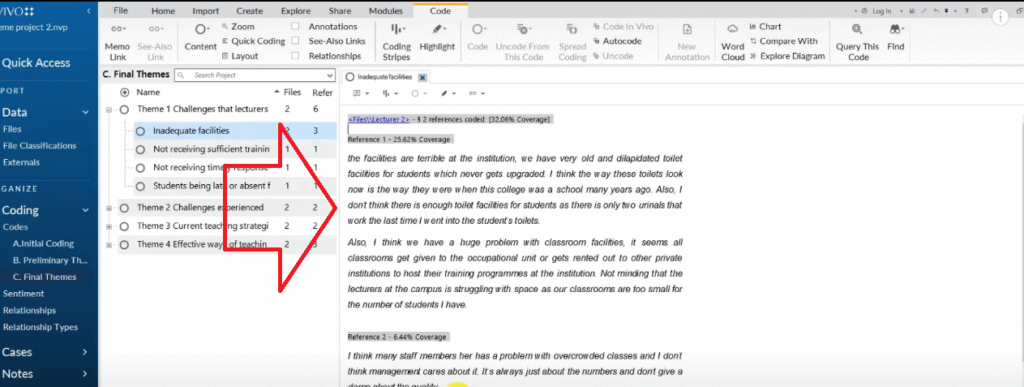
That’s lecturer two and lecturer three.
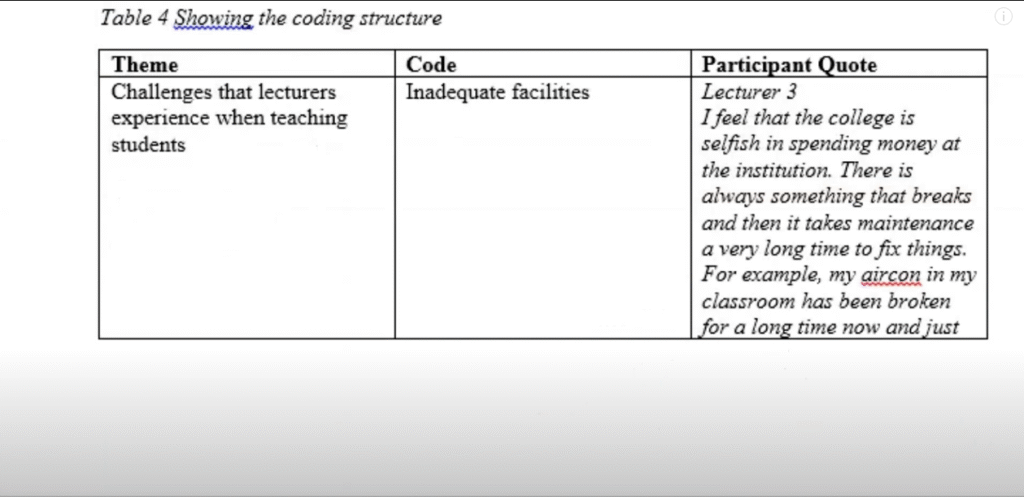
Now I state that two of the participants Lecturer two and lecturer three stated that the main challenges that they experienced when teaching students was inadequate facilities.
You see, I’ve explained the code.
Then I provide the quote, I Ctrl A, then copy the quote.
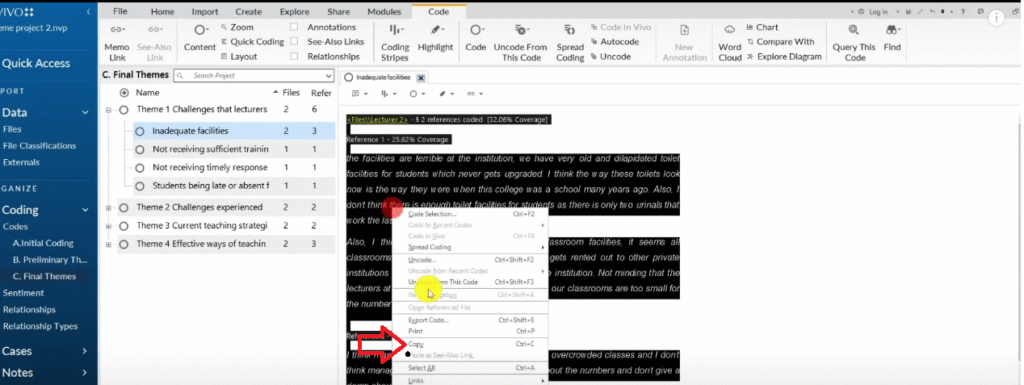
Then I’ll paste the quote in my report.
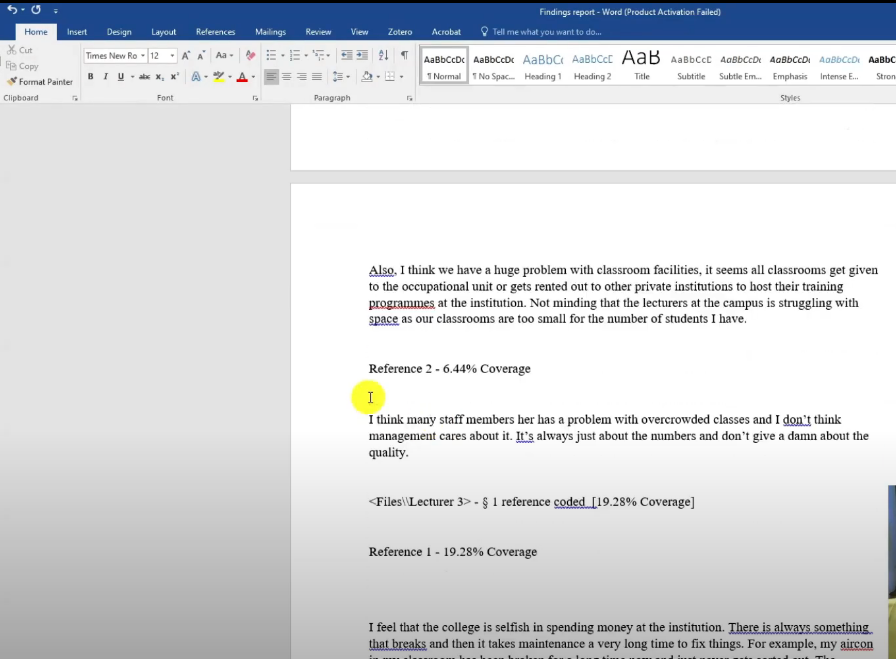
So we don’t want to have files,coverage and all these details delete them.
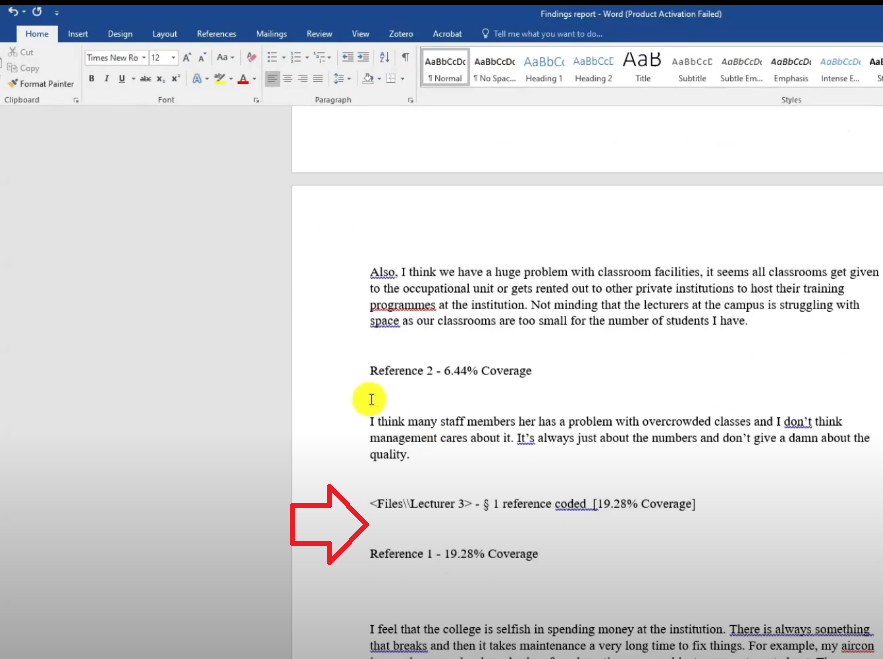
It’s some N-Vivo way of counting everything that you’re doing.
So for these quotes, I’m going to highlight them put them in italics then put an indent by clicking on tab.
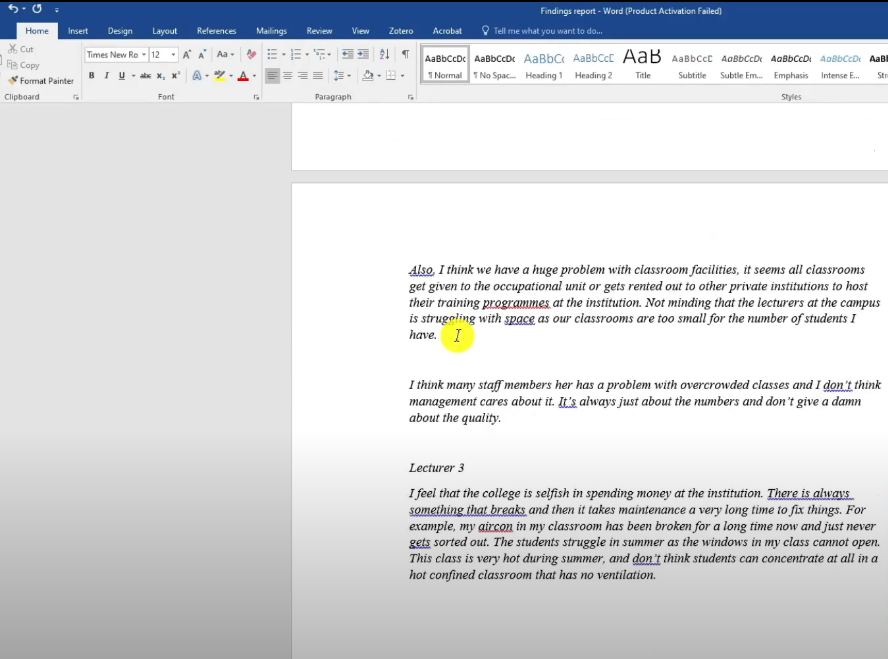
And you can see if you read that I have the quotes to support the code.
Let me write another one so that you can understand what I’m doing.
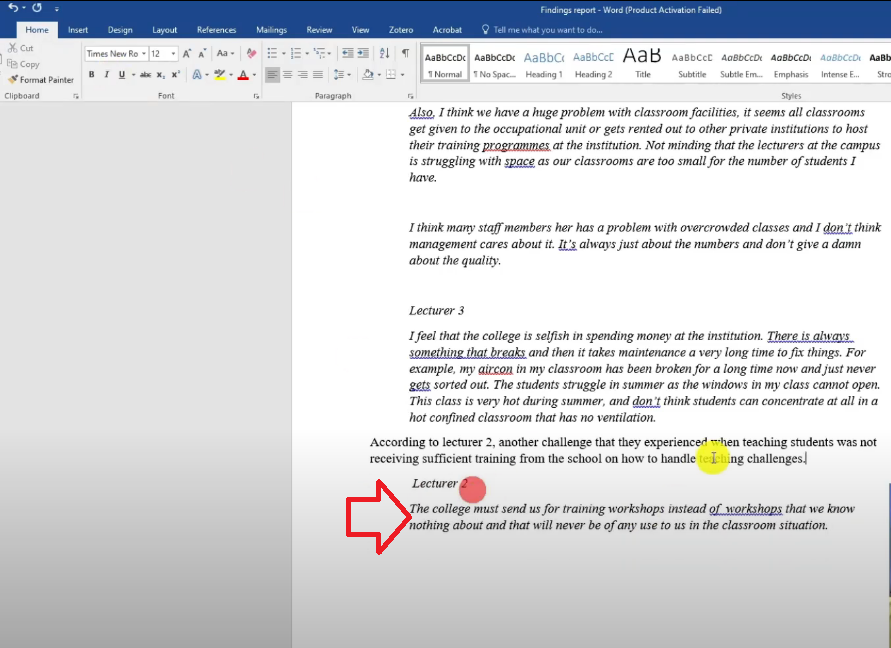
So the second challenge this lecturer said they have is not receiving sufficient training.
According to lecturer two, another challenge that they experienced when teaching students was not receiving sufficient training from the school on how to handle teaching challenges.
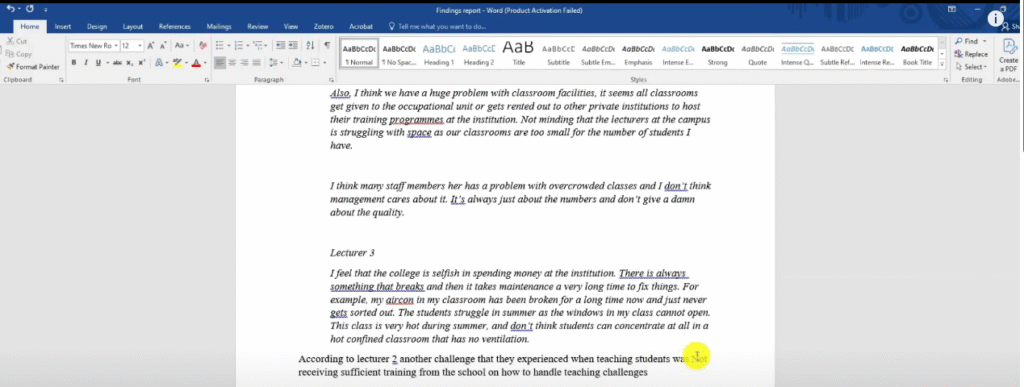
So you see the way the codes combine with the narrative that I’m trying to create.
Now lets go extract a quote.
And I paste it on the report
So you can see the narrative has started shaping up.
Adding visuals to the findings report including Hierarchy charts, mind maps,word clouds and sunburst
Now in theme one, I left a certain space here because it’s always good to have more visuals in our work.
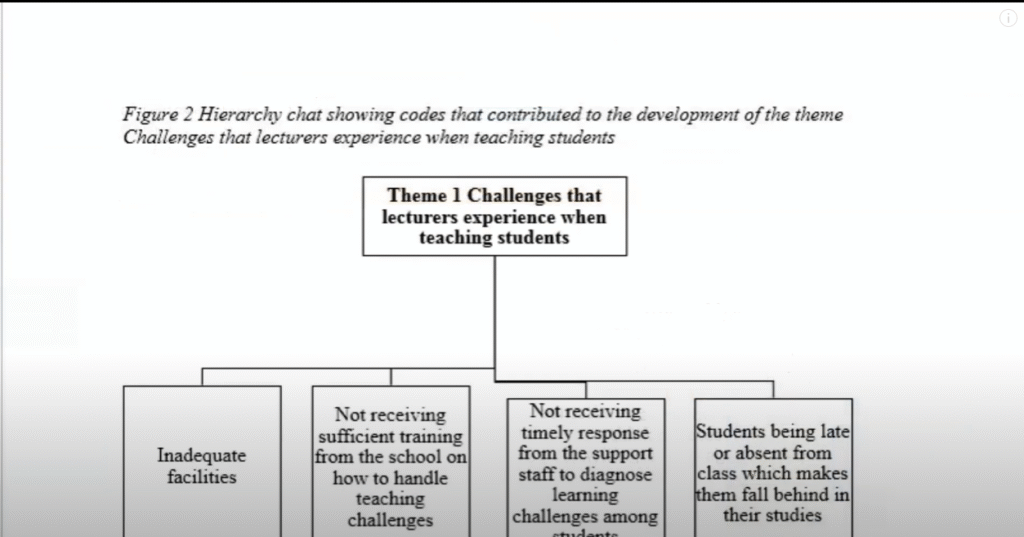
In N-Vivo we can go and draw something we call a mind map and use it in our report.
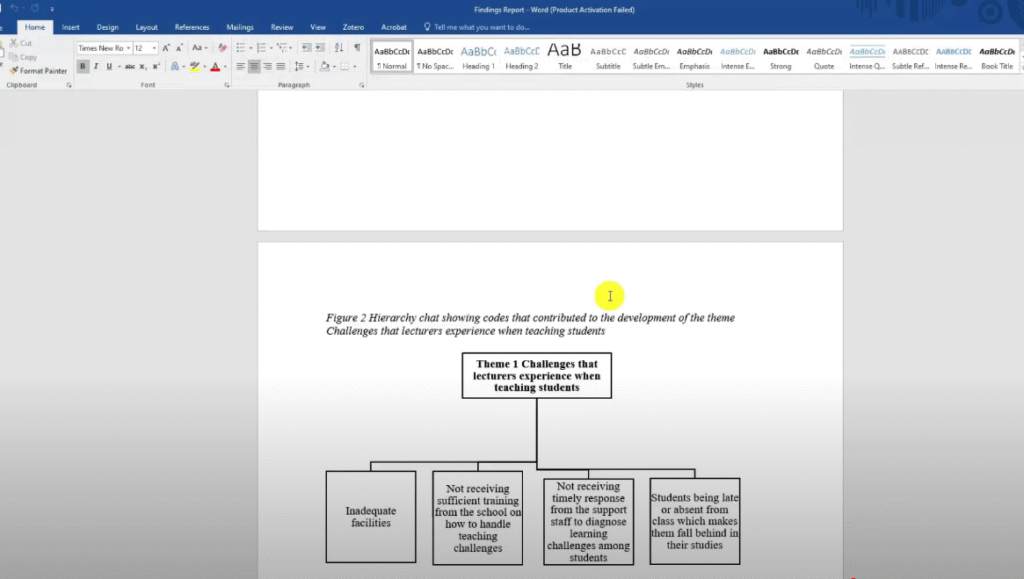
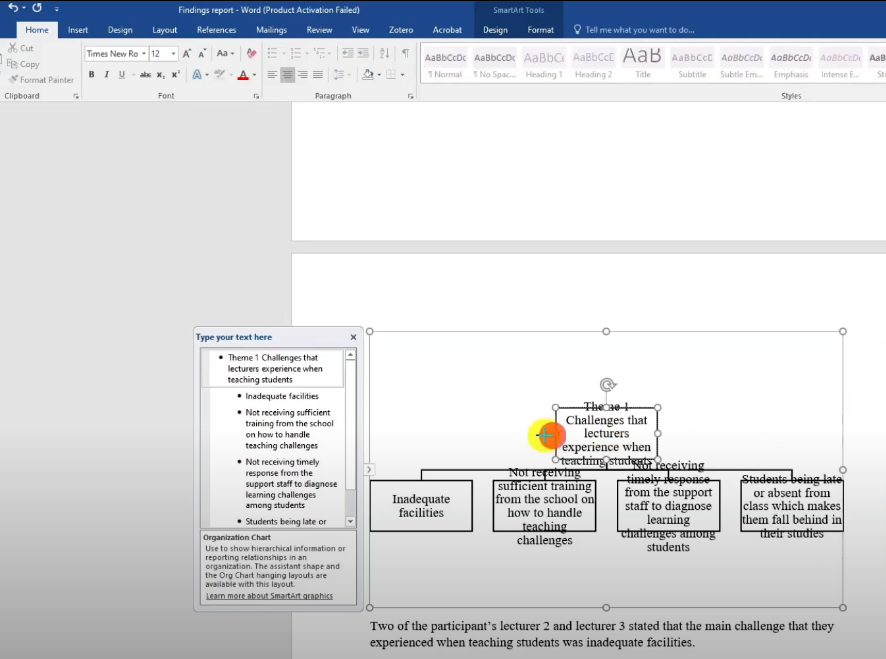
Or we can draw a hierarchy chart in Microsoft Word.
I like to draw in Microsoft Word because it has editable visuals and N-Vivo doesn’t have that.
How do I do it?
I got to insert.
I go to smart art.
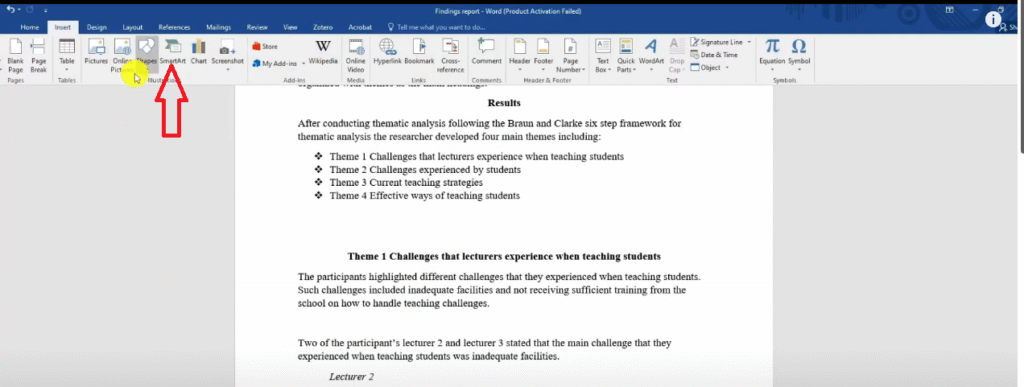
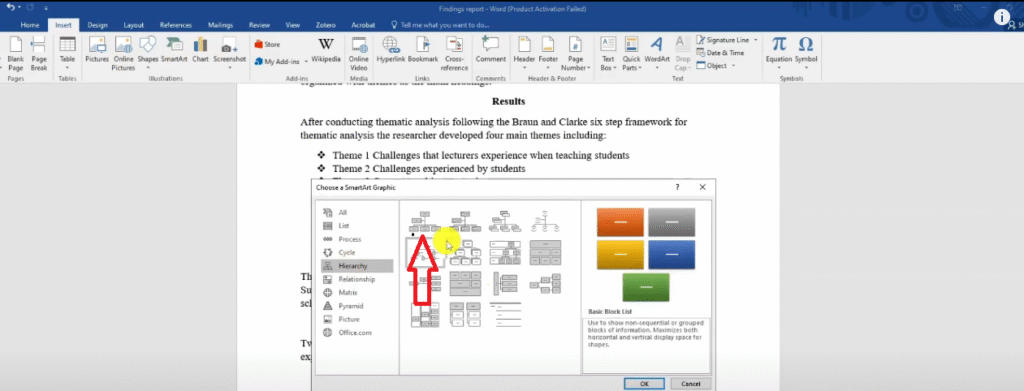
I choose hierarchy.
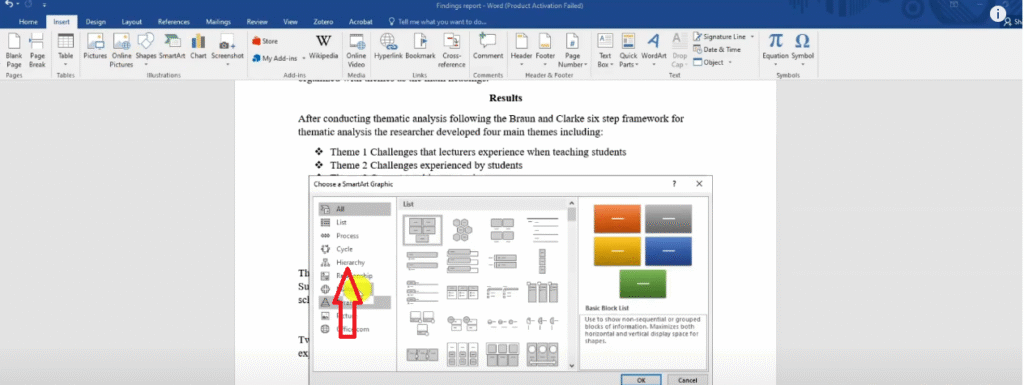
I choose the first option and click okay.
Of course this is the theme.
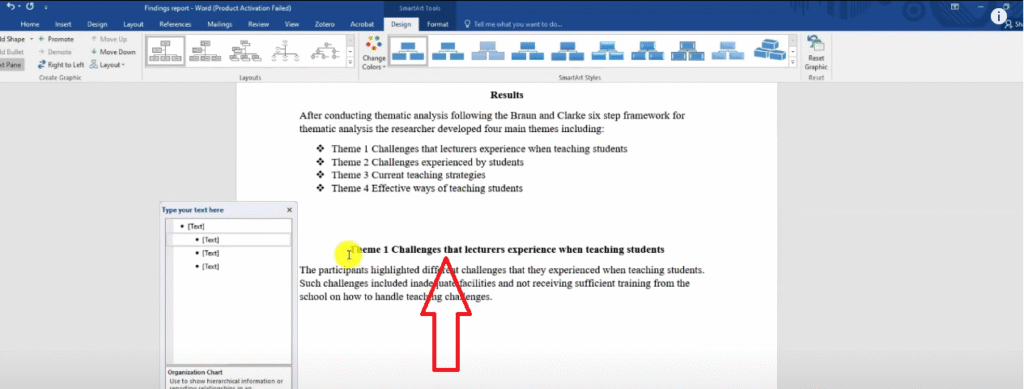
The theme is the top most.
I copy and I paste the theme here.
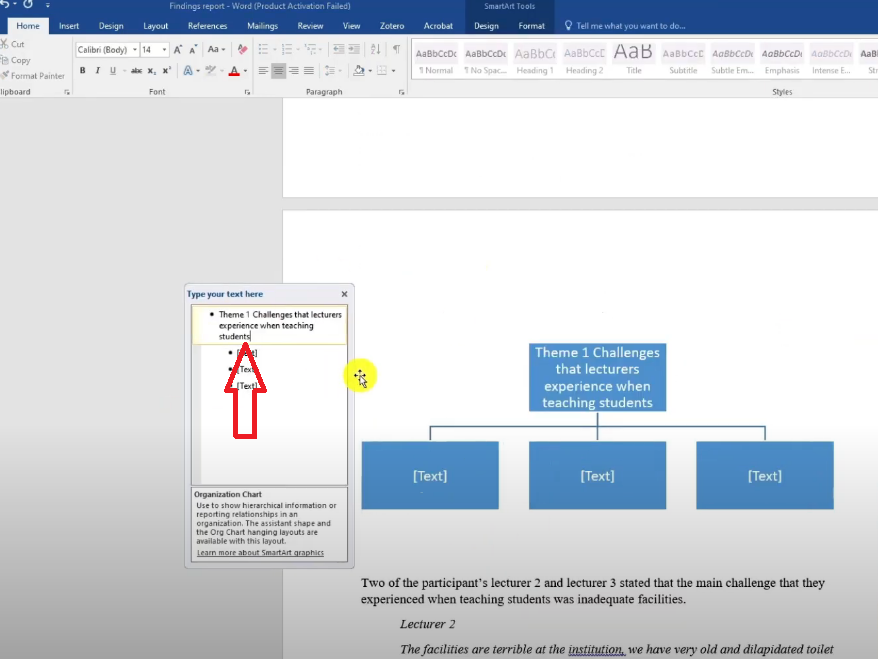
And under that theme if you look at N-Vivo, we have 1, 2, 3, 4 codes
So we have four codes.
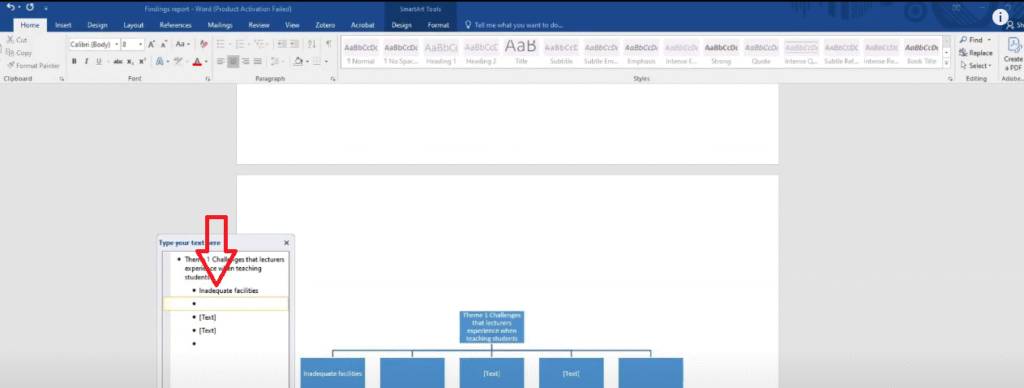
And those codes are still the same one in my Excel so I can use my Excel to be able to copy paste.
The first code is inadequate facilities.
I paste it here.
The second code is not receiving sufficient training time.
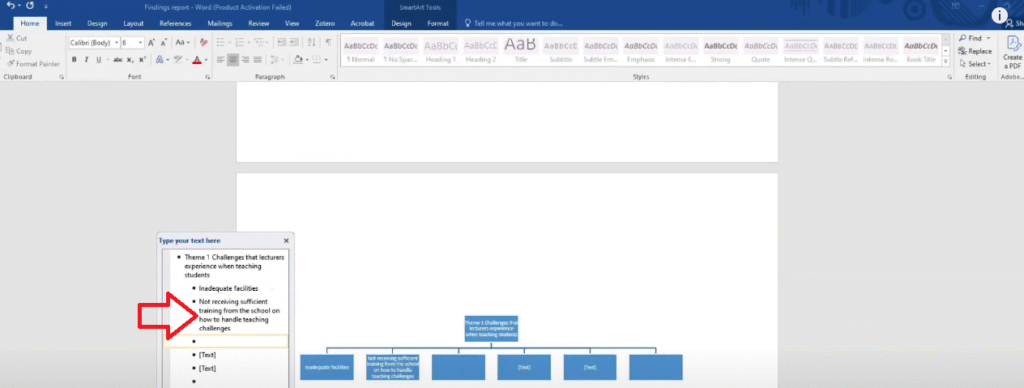
Another code is not receiving timely response.
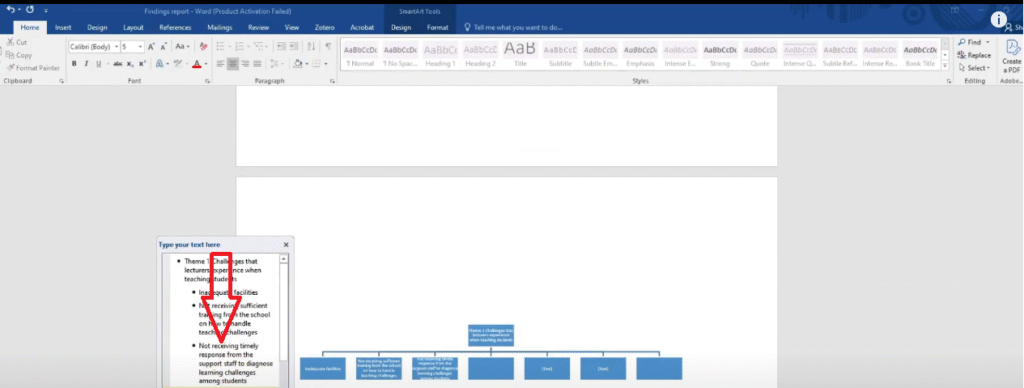
Another code is students being late or absent for class.
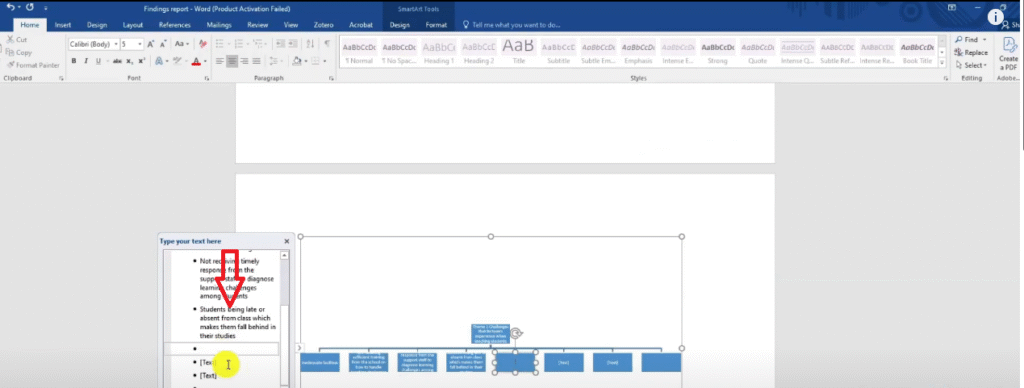
Then I go to change colors I put black and white.
I can always highlight it and change it to the font that I’m using which is times New Roman.
Font size 12
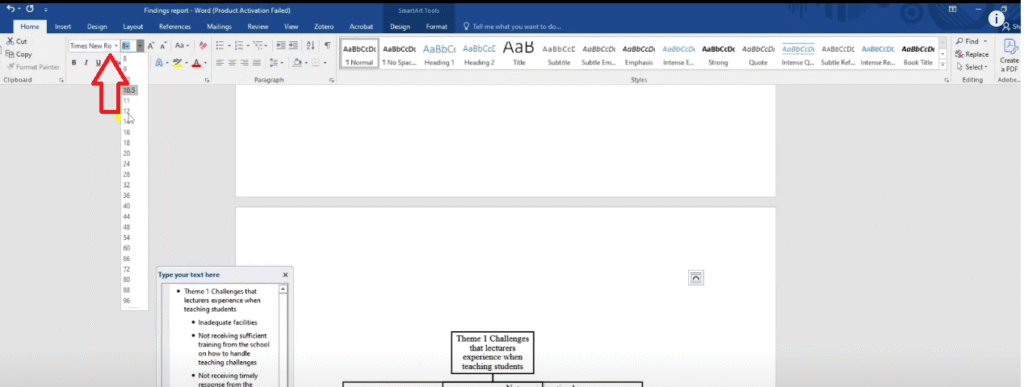
If you see your visual doing like that just expand the space and move the blocks a bit further.
So this one I’m going to expand the blocks a bit down and this kind of visual is the one we get here.
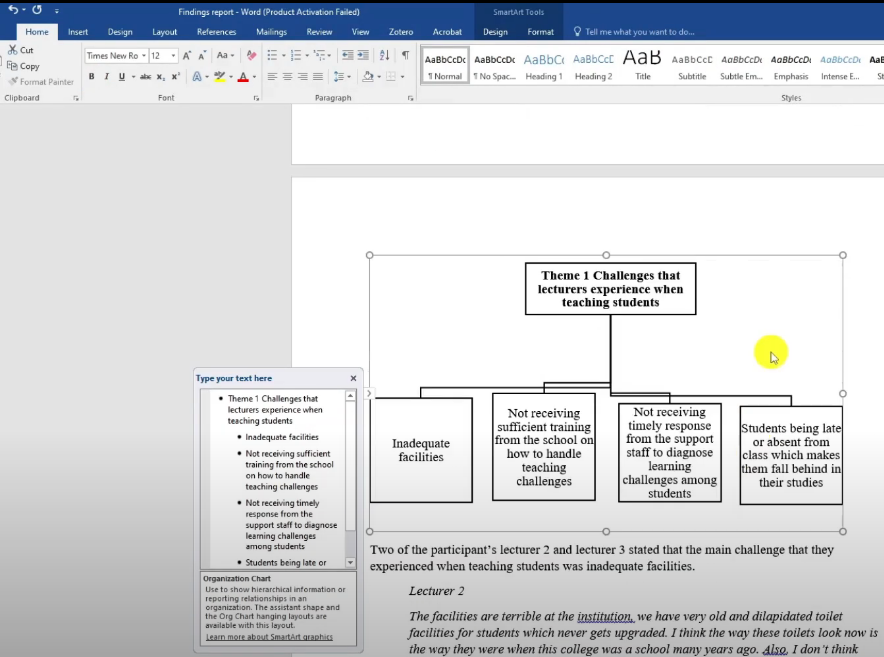
So that’s a hierarchy chart.
And that’s the first kind of visual that we use in N-Vivo.
This visual I normally call them a mind map.
That’s how we present our data.
Look at how the findings report is shaping.
We moved from having data in N-Vivo to now having themes, Clear descriptions and charts.
Another visual we can draw in N-Vivo is called a hierarchy chart.
For the second theme here let’s say I’ve gone and written the whole narrative and I want to add a visual.
I’ve shown you how to draw tables.
I’ve also shown you how to draw mind maps.
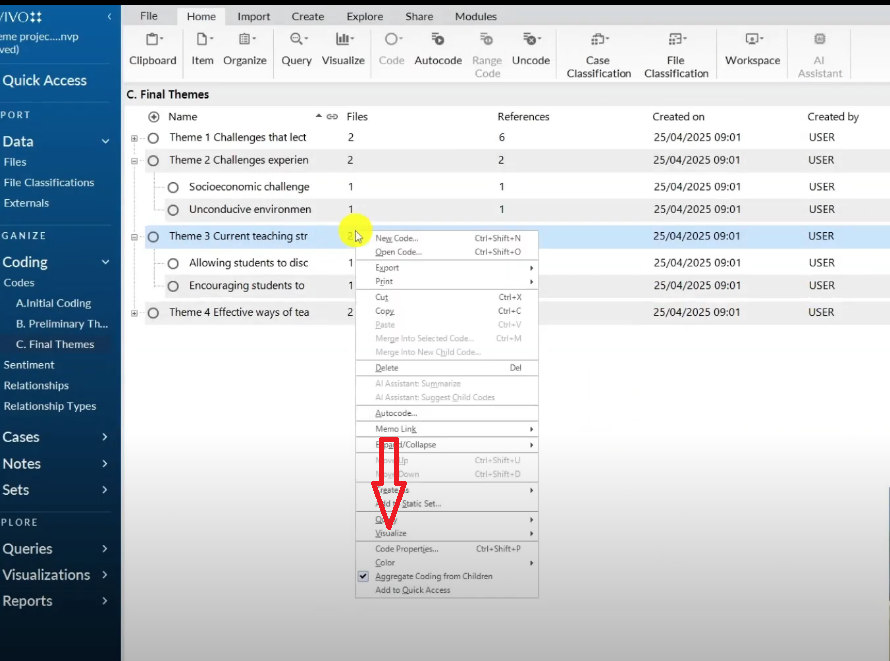
Now let me show you how to draw another visual in N-Vivo,
Select a theme.
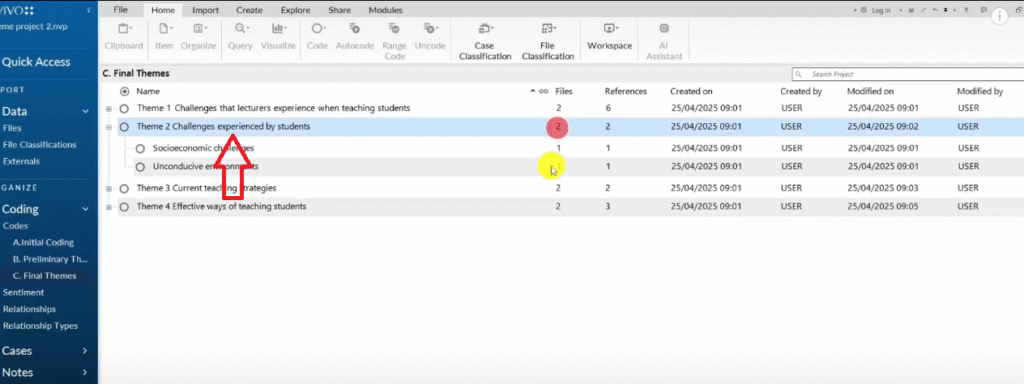
Go to visualize.
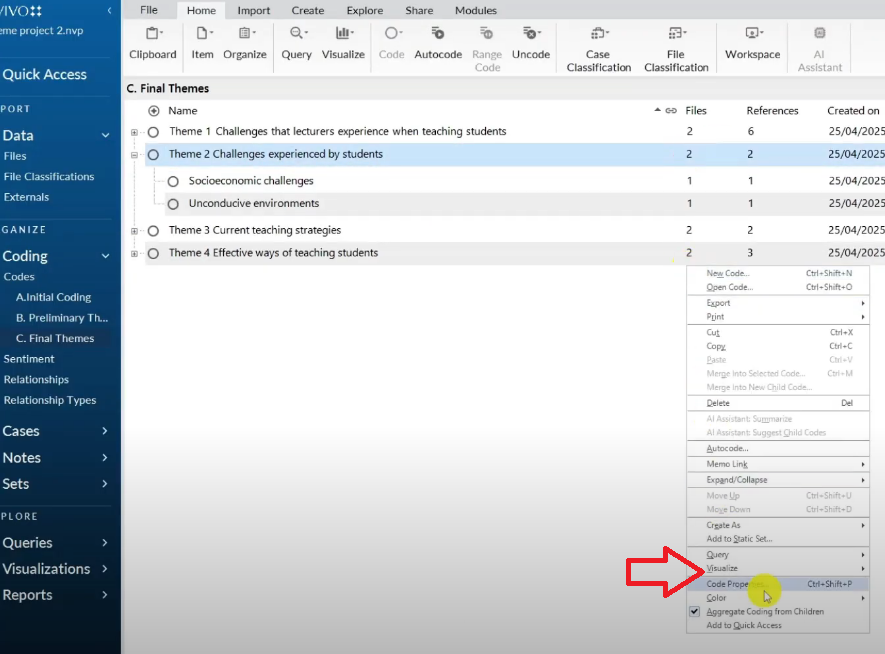
Go to hierarchy chart.
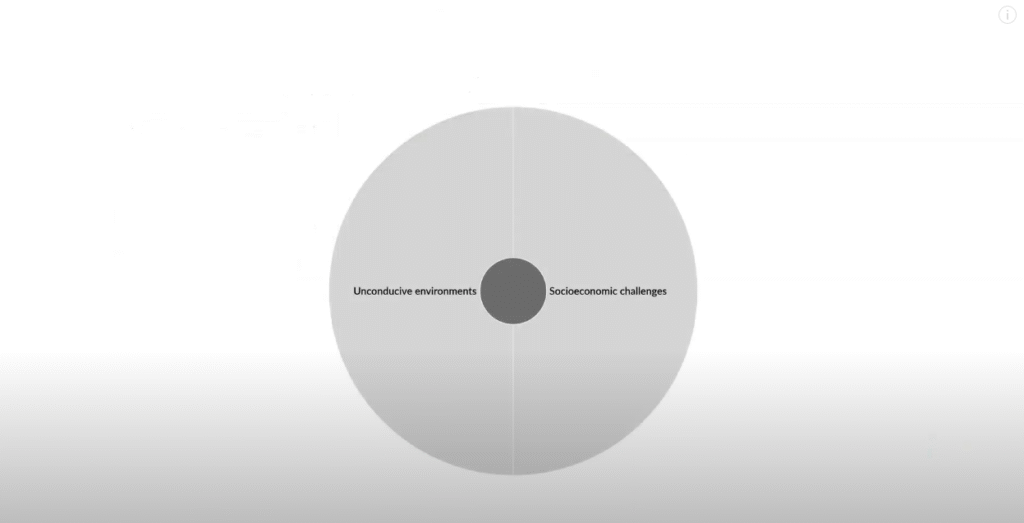
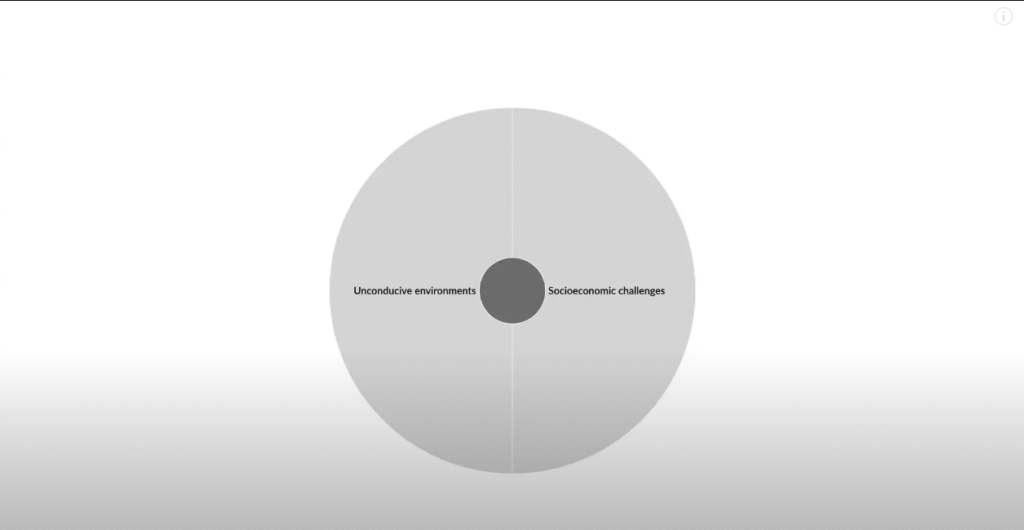
Select the second option here sunburst.
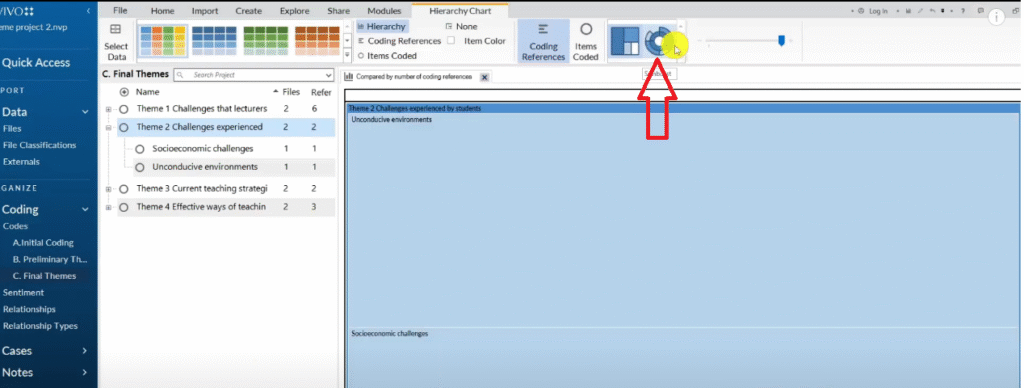
That’s another visual it’s called a hierarchy chart.
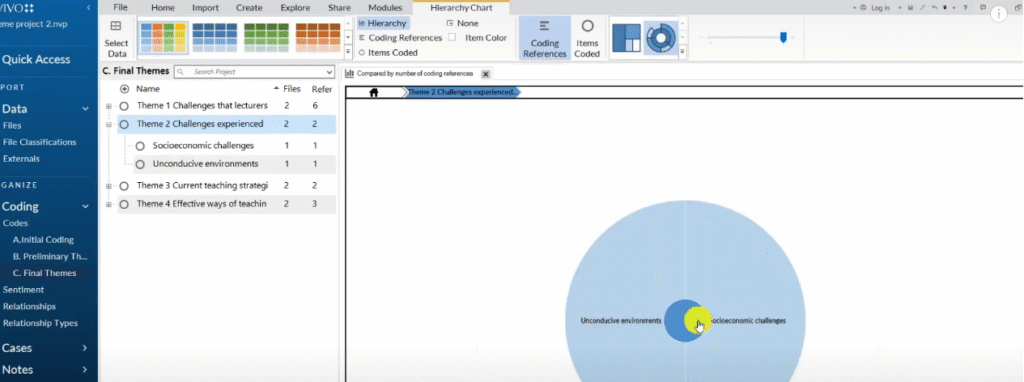
It shows which codes are more prominent.
And these are challenges experienced by students conducive environment and social challenges.
I can format this into black and white ’cause most of the times we don’t use colors.
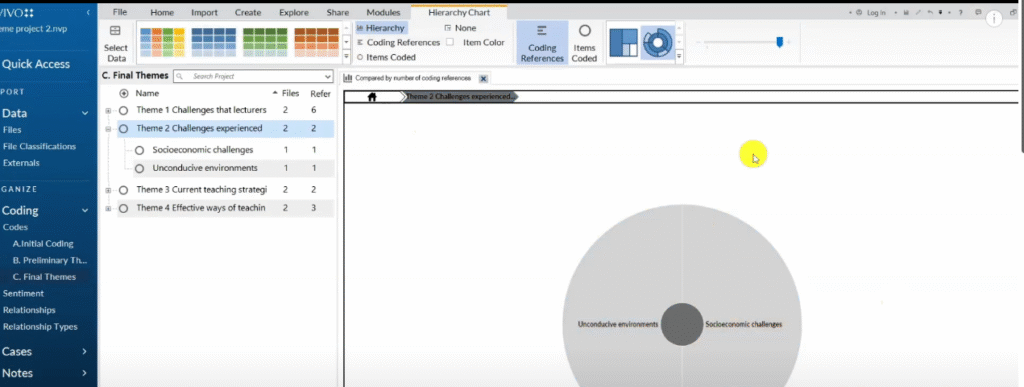
Then I can right click export hierarchy or sunburst.
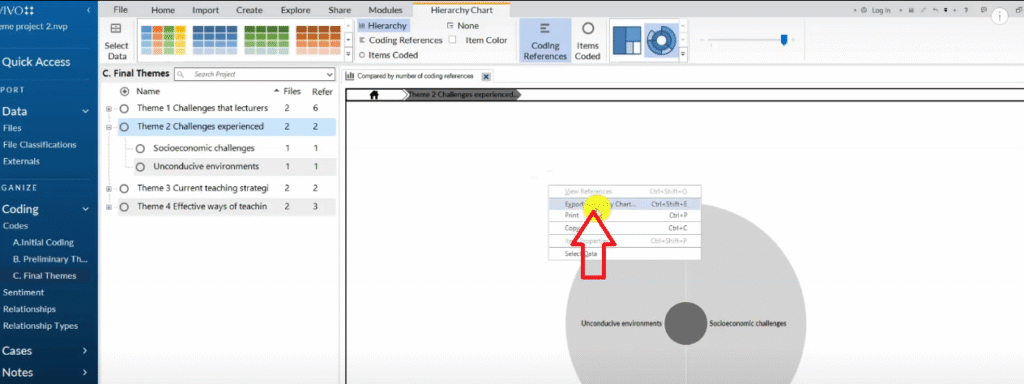
And then save that and use that in my visual.
Let’s call this theme two.
So I will go to theme two folder then drag the sunburst and drop it inside my findings report.
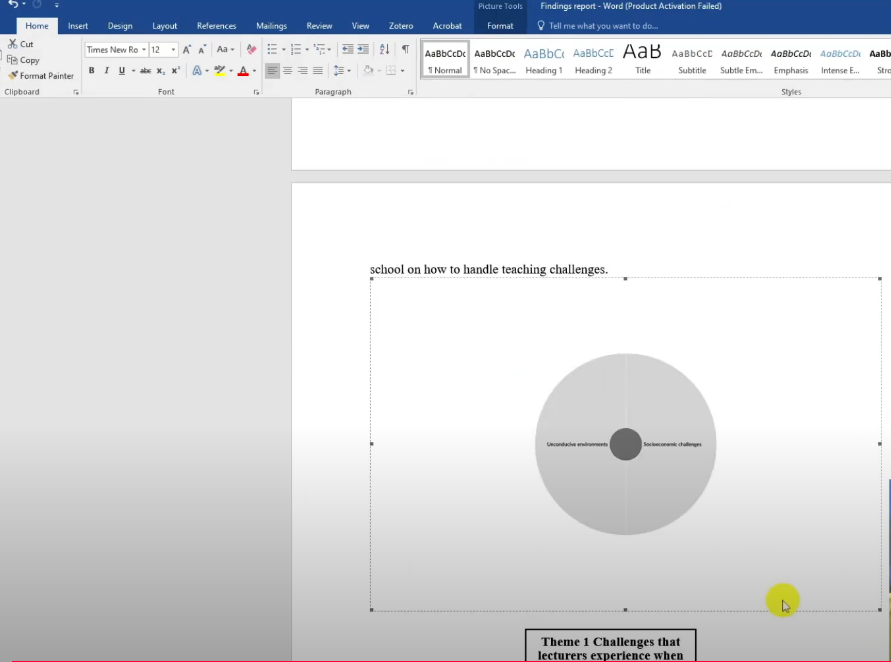
You see that kind of visual is a hierarchy chart that we can draw in N-Vivo.
That’s another visual.
Those are the three main ones that I use.
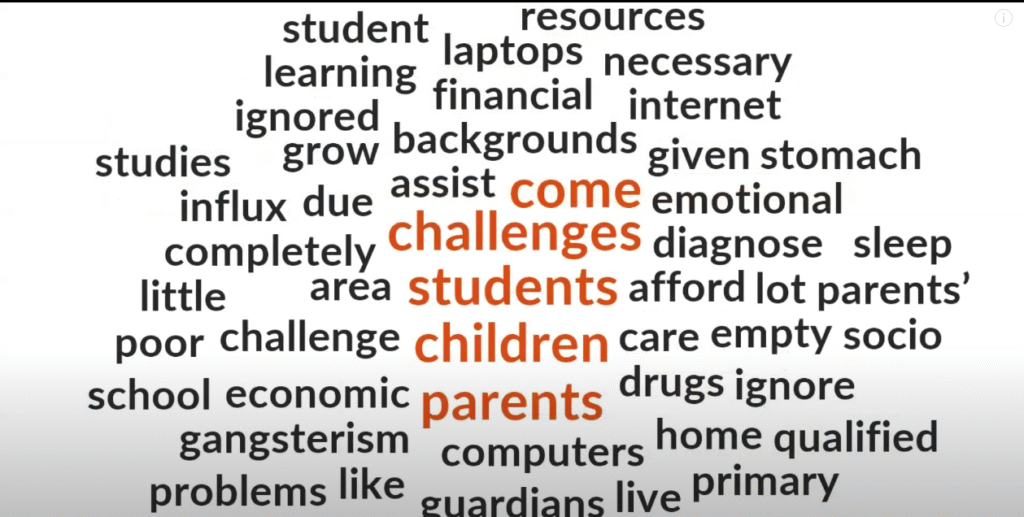
Another kind of visual that we can draw in N-Vivo is a word cloud.
So if we click on theme number three, let’s say we had written the narrative
Go to visualize
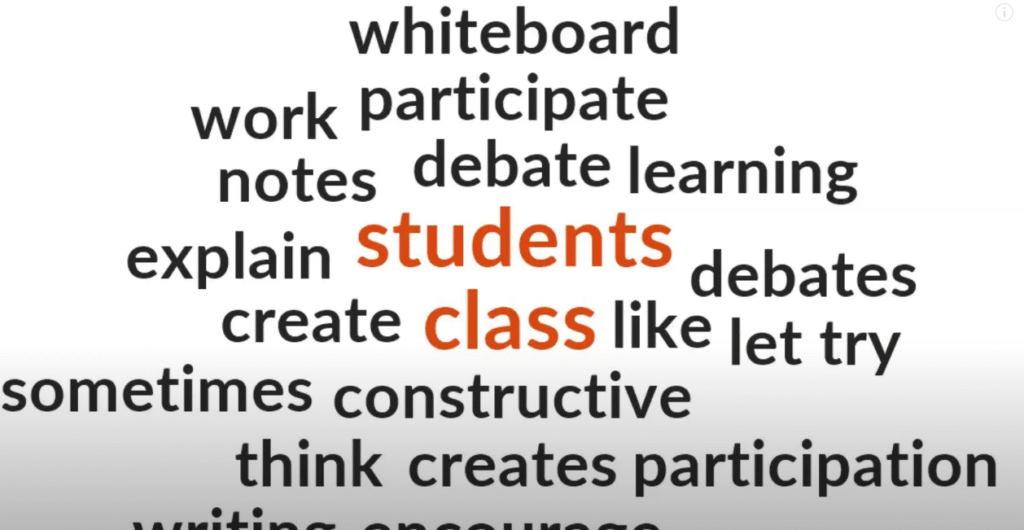
And click on word cloud.
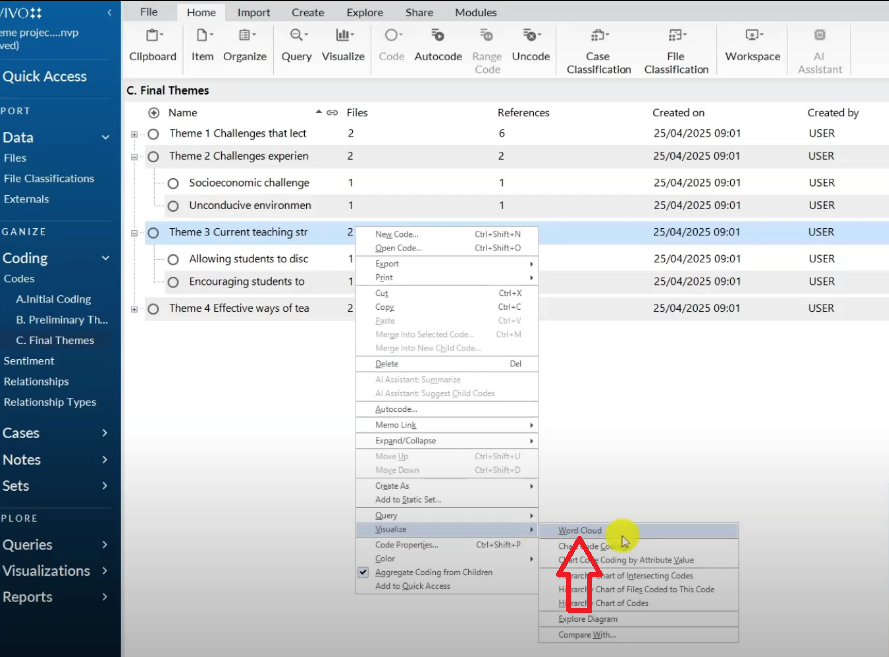
So a word cloud shows the main words that contributed or the main ideas that contributed to the formation of that theme.
Let’s have a word cloud.
And let’s see.
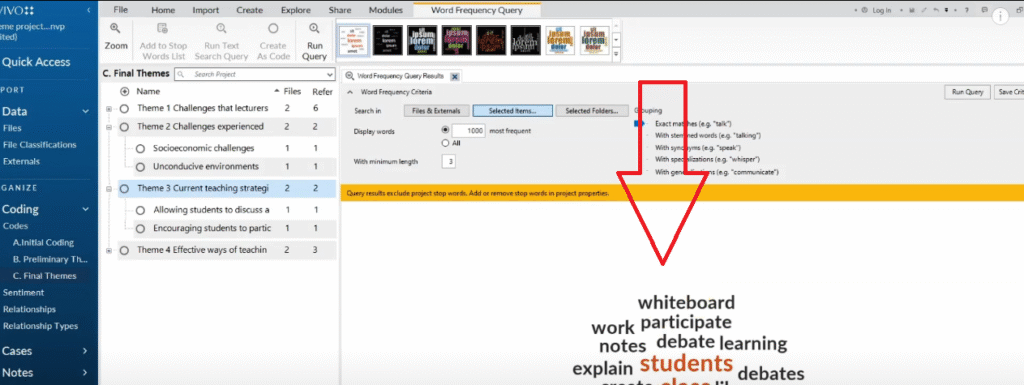
So these are current teaching strategies that teachers employ.
So you can export this by right clicking then export.
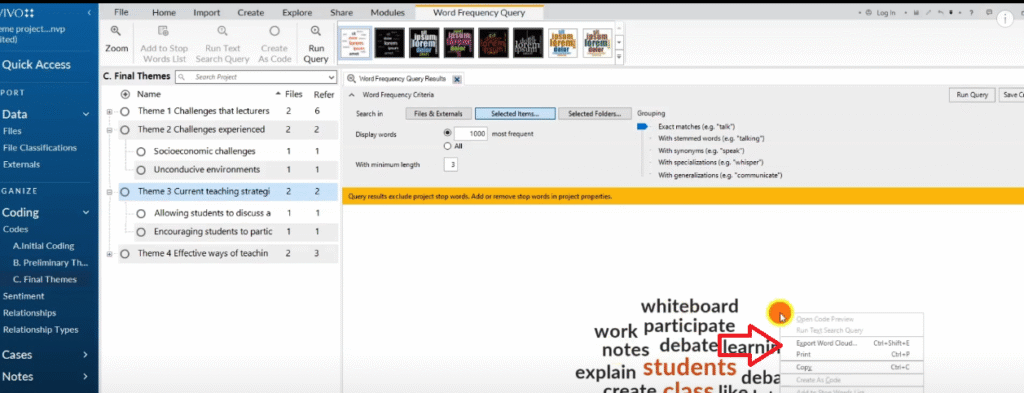
Let’s call it word cloud.
And you can always put that in your report when you have written the narrative.
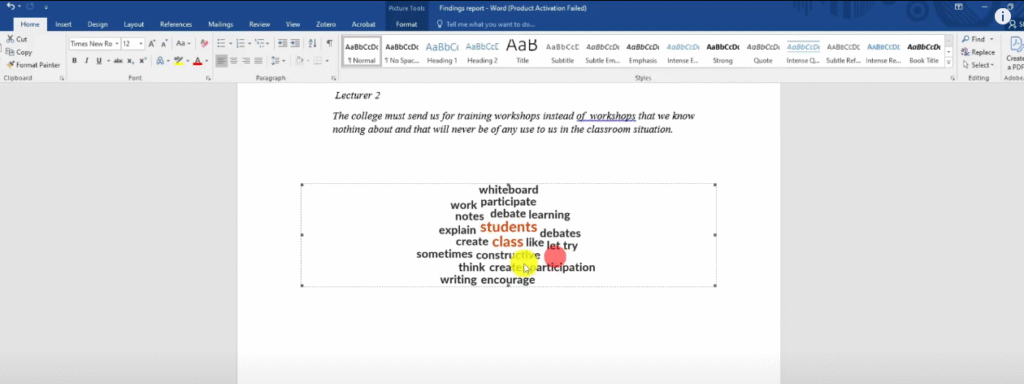
You see that’s a word cloud on a given theme.
And basically those are the main visuals that we can have in N-Vivo.
We have tables
We have charts which we do inward.
We have a sunburst or a hierarchy chart which we drew in N-Vivo.
And we have a word cloud.
So those are the main visuals that you can put in your report and if you would like to know how to use these numbers to draw pie chart.
If you like bar charts and pie charts which are not really recommended in qualitative analysis.
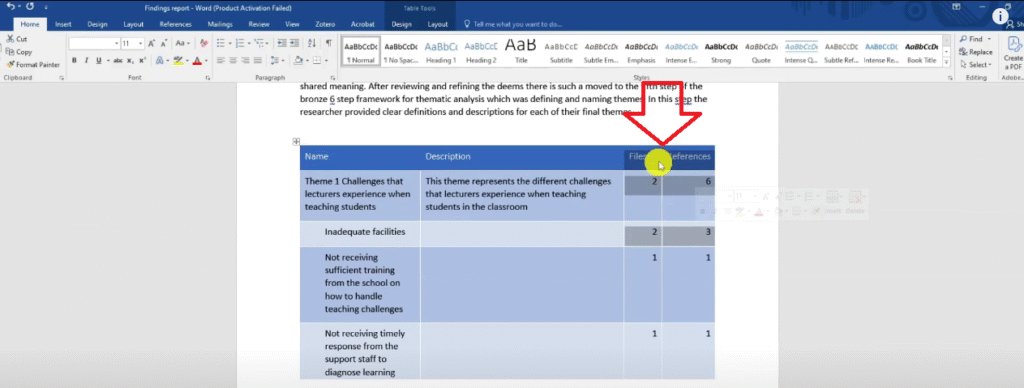
But maybe you’re a visual person and you want to draw some comparison to show the theme prominence.
For instance, this theme has two files and it has six references
So if I was to plot the references for the themes
I can know which theme is more prominent and its theme one which have six references
Followed by them four.
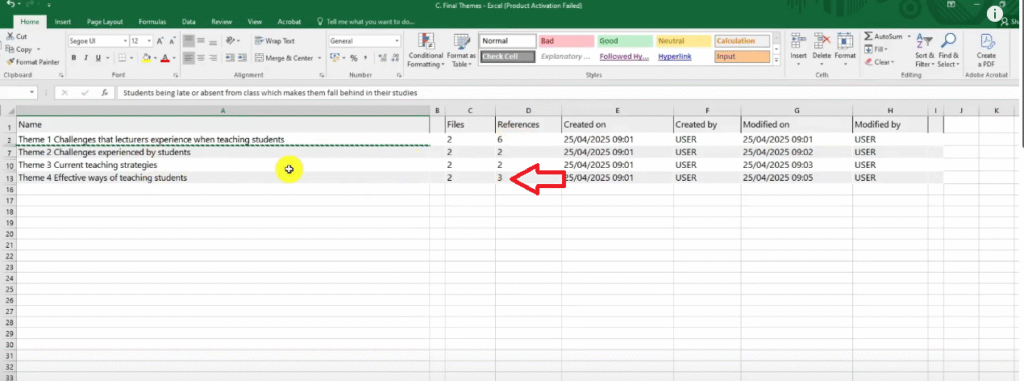
Which has three references followed by theme three.
Then two.
So if I wanted to plot that in a biography what would I do?
I have an article on how to create even more types of visuals in N-Vivo which you can include in your findings report.
That’s how you write the findings report in N-Vivo.
You write the narrative you start with the data analysis process.
You describe it.
You provide evidence of what you did.
Then you go to the results and present the theme in a narrative format and supplement your narrative with visuals.