Last Updated on 4 weeks ago by Bernard Mugo
Writing up your thematic analysis findings in NVivo 15 is the step where all your hard coding work finally becomes a dissertation chapter. In this guide, I will show you exactly how to move from your final themes in NVivo 15 to a complete, well-structured findings report — including the narrative, tables, participant quotes, and visuals that examiners expect to see.
By the end of this article, you will know how to describe your data analysis process, export tables and codebooks from NVivo, write a theme-by-theme narrative using participant quotes, and supplement your report with four types of visuals.
This article is the final part of my NVivo thematic analysis series. If you have not yet completed your coding and theme development, start with my guide on thematic analysis in NVivo 15 before continuing here.
- What Does a Thematic Analysis Findings Report Include?
- Step 1 — Describe Your Data Analysis Process
- Step 2 — Export Tables from NVivo 15 for Your Report
- Step 3 — Present Your Themes in Narrative Format
- Step 4 — Add Visuals to Your Findings Report
- Frequently Asked Questions
- What is the difference between the data analysis process section and the results section?
- How many visuals should I include in a thematic analysis findings report?
- Can I include bar charts or pie charts in a qualitative findings report?
- Do I need to cite Braun and Clarke every time I mention the six-step framework?
- Key Takeaways
- Need Help Writing Your Findings Report?
What Does a Thematic Analysis Findings Report Include?
A thematic analysis findings report — typically Chapter 4 of a thesis or dissertation — has two main sections:
- Data analysis process — a step-by-step account of how you analyzed your data, with evidence from NVivo
- Results — a theme-by-theme narrative that presents what you found, using codes, participant quotes, and supporting visuals
Many PhD students skip the data analysis process section entirely and jump straight into the results. That is a mistake. Examiners want to see that you followed a rigorous, documented method — and the NVivo export tools make it straightforward to provide that evidence.
According to Braun and Clarke’s foundational 2006 paper on thematic analysis, the six steps of their framework are: familiarizing yourself with the data, generating initial codes, constructing initial themes, reviewing themes, defining and naming themes, and writing the report. Your findings chapter should walk the reader through each of these steps.
Step 1 — Describe Your Data Analysis Process
Writing About Each Braun and Clarke Step
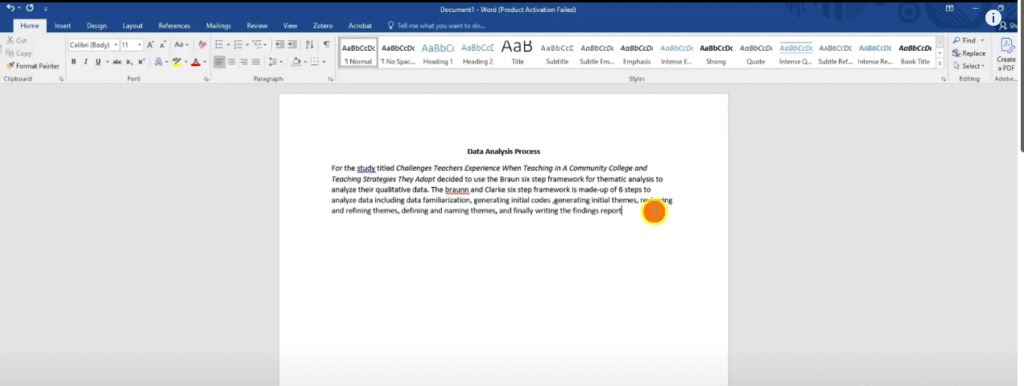
The data analysis process section explains how you moved from raw transcripts to final themes. You are not presenting your findings here — you are providing a transparent, citable account of your methodology.
Here is the structure I use for each step:
- Name the step and cite Braun and Clarke
- Explain what the step involved in plain language
- Provide evidence from NVivo — a screenshot, a table, or a code list export
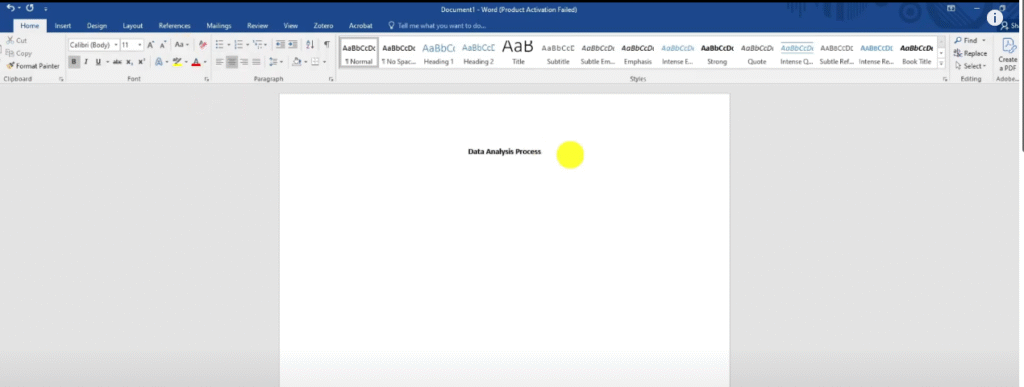
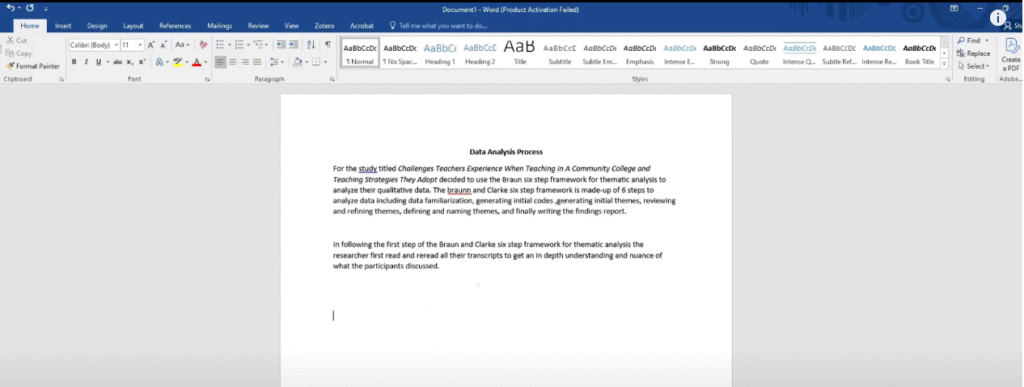
For example, for Step 1 (data familiarization), you might write:
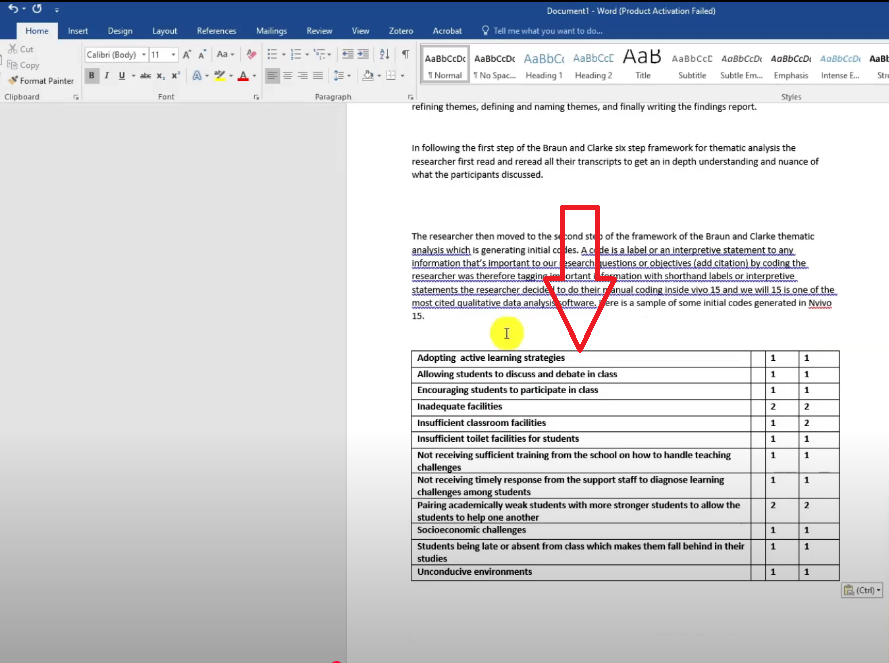
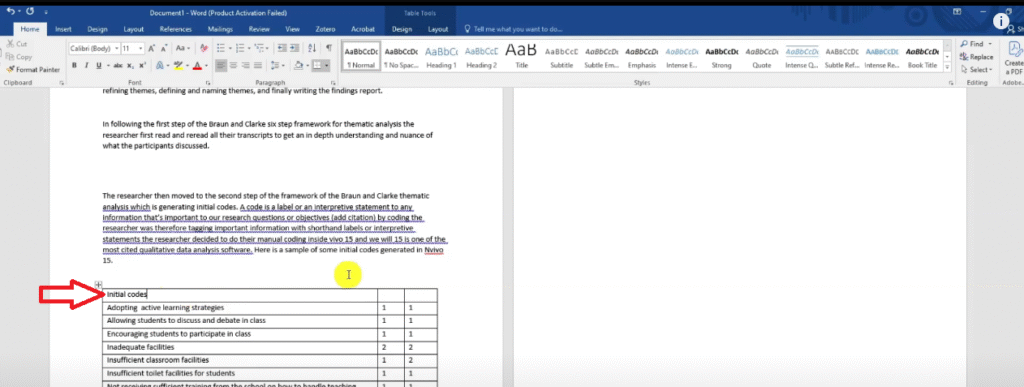
Following the first step of the Braun and Clarke (2006) six-step framework for thematic analysis, the researcher read and re-read all interview transcripts to develop an in-depth understanding of the data. This process of data familiarization allowed the researcher to begin noting initial ideas before any formal coding began.
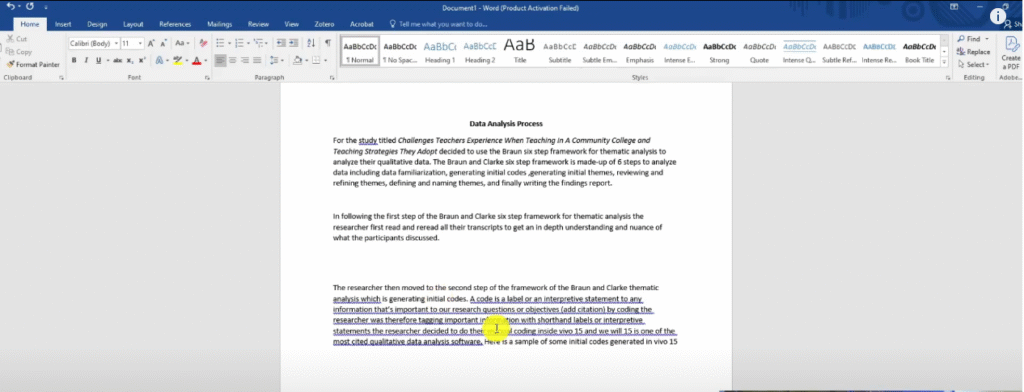
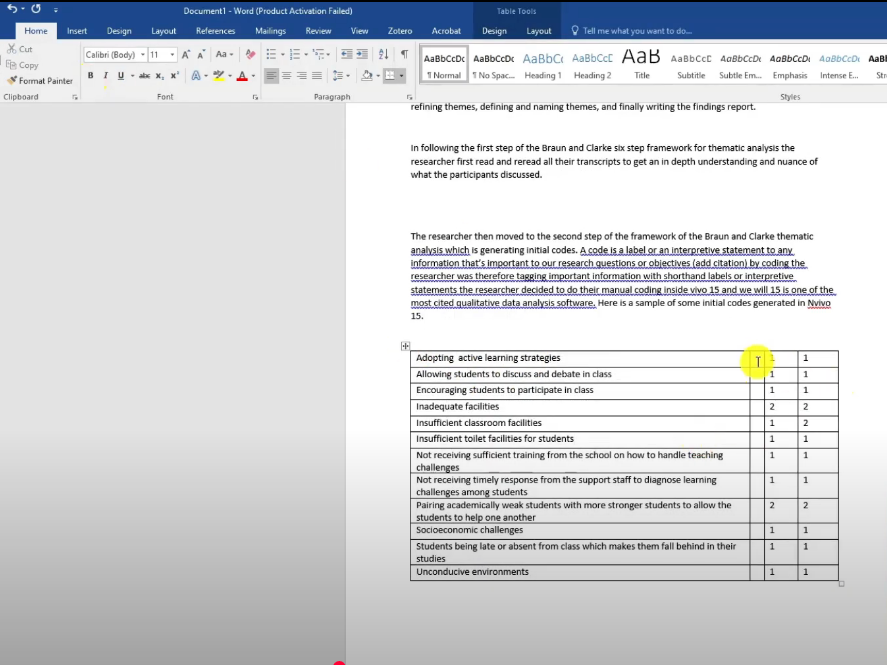
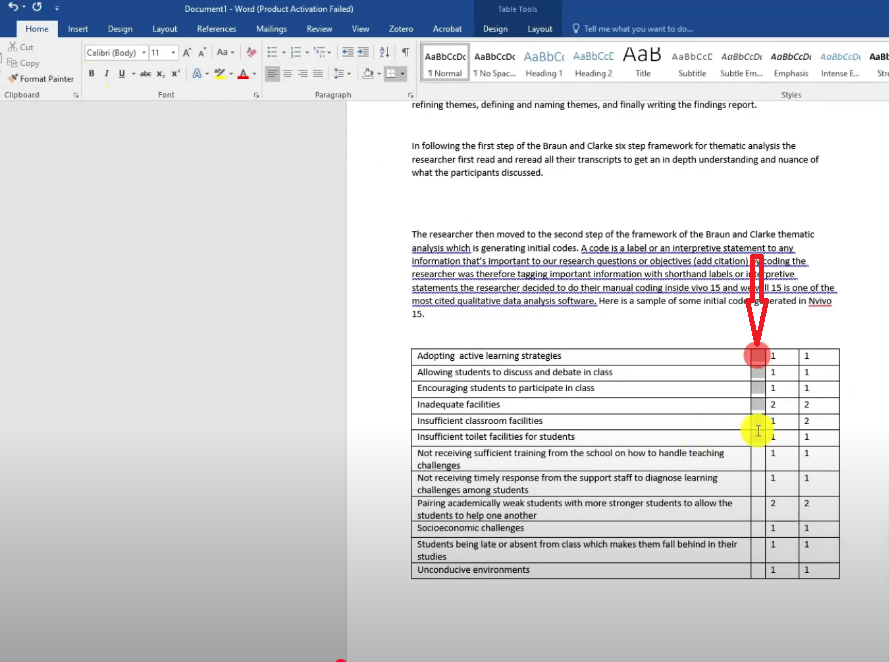
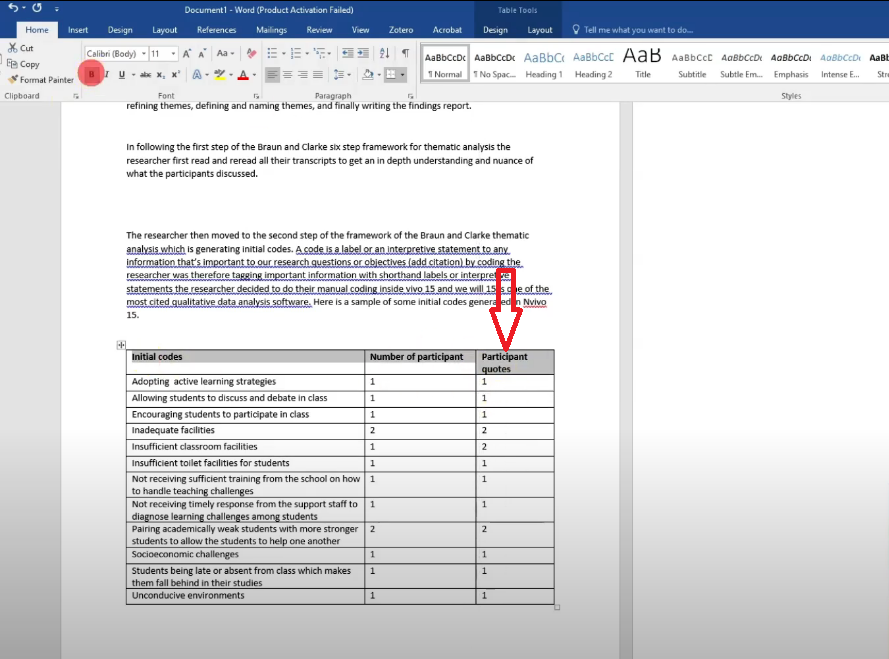
For Step 2 (generating initial codes), add a table of your initial codes exported directly from NVivo. This turns an abstract claim into documented evidence.
Exporting Your Codebook and Code List from NVivo 15
NVivo 15 gives you two export options that are essential for the data analysis process section:
- Code list (Excel) — exports your coding structure as a spreadsheet showing themes, codes, file counts, and reference counts. Use this to build tables in Word.
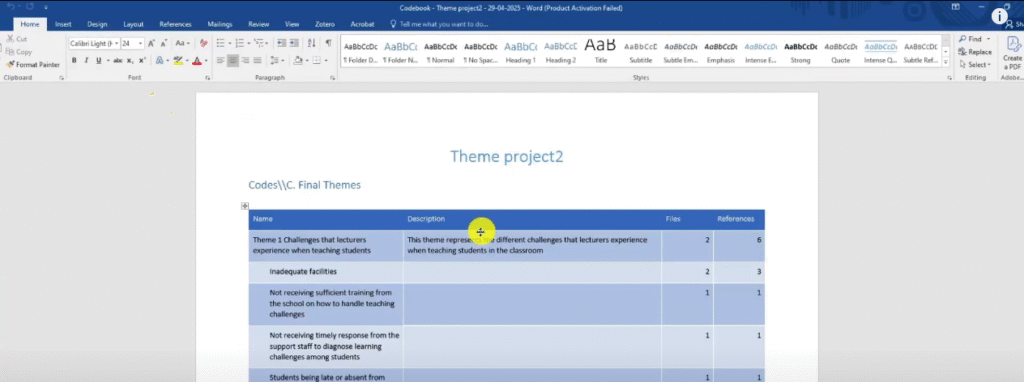
- Codebook (Word/PDF) — exports your themes with their full descriptions. Use this to show your theme definitions in the report.
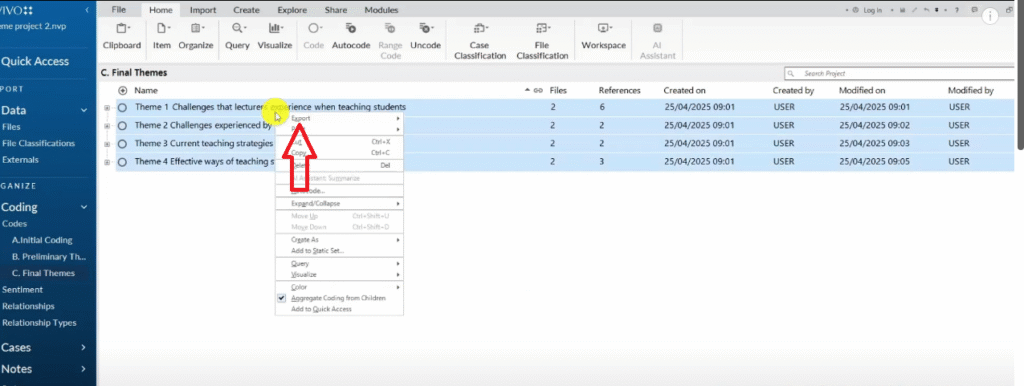
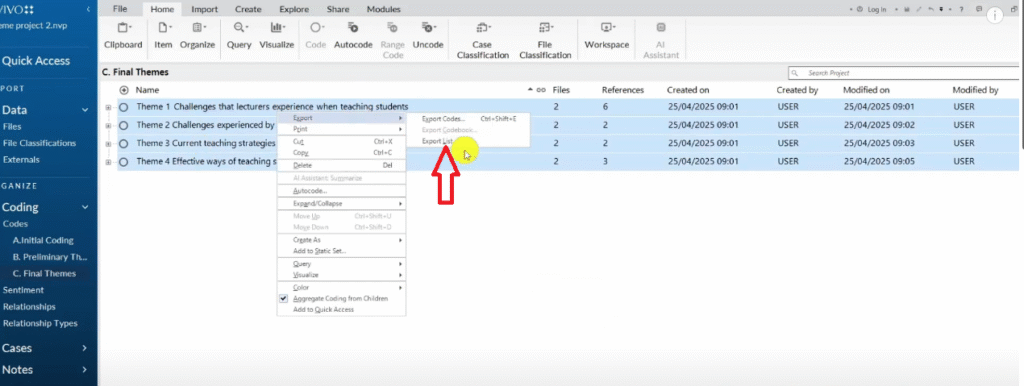
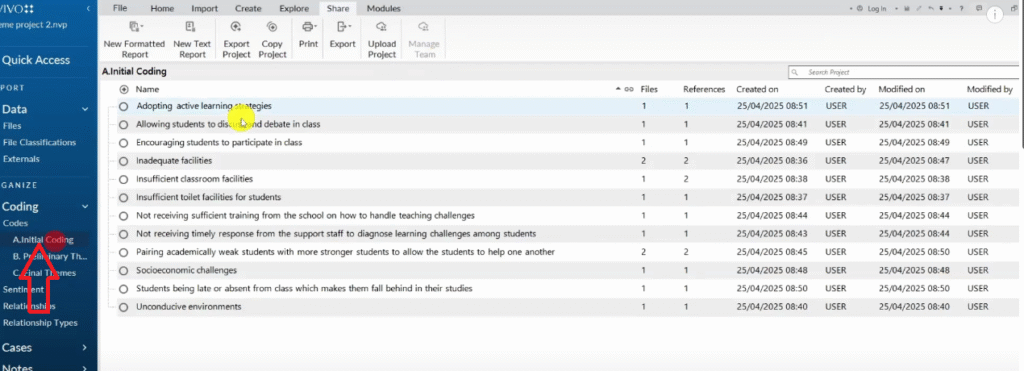
To export the code list:
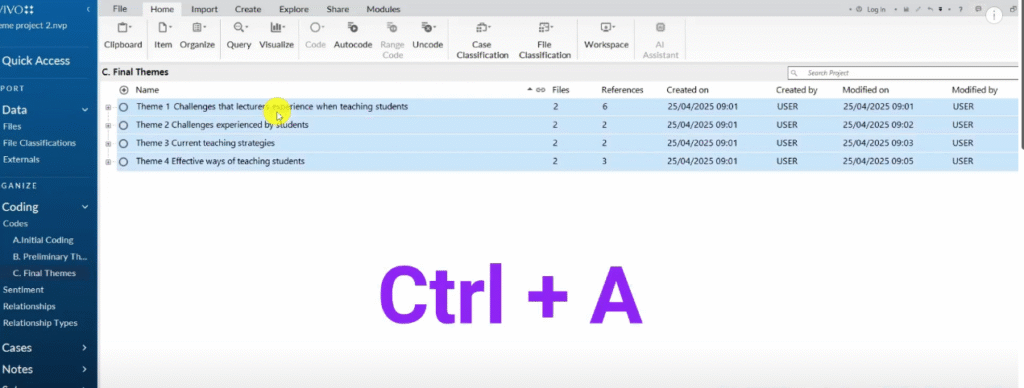
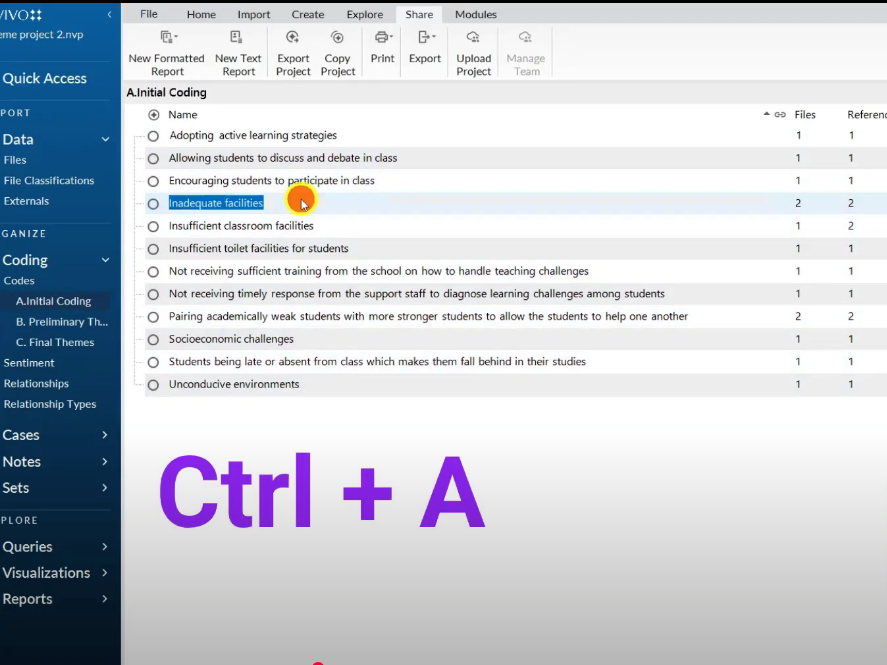
- In NVivo, press Ctrl+A to select all items in your coding folder
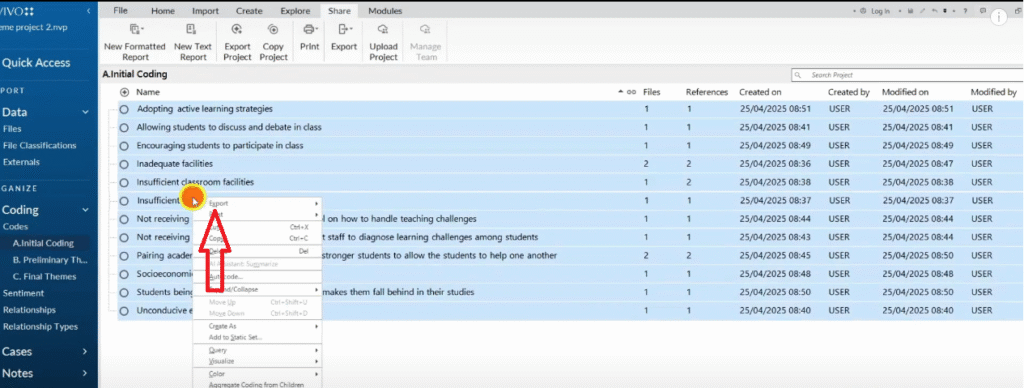
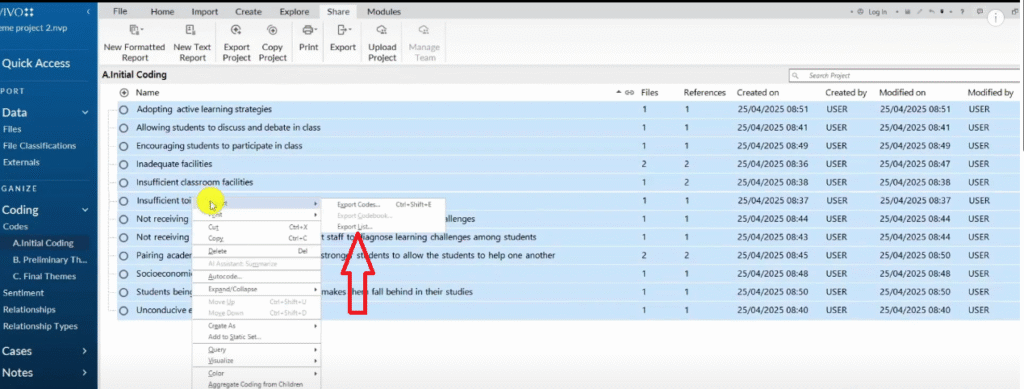
- Click Export → Export List
- Save as an Excel file
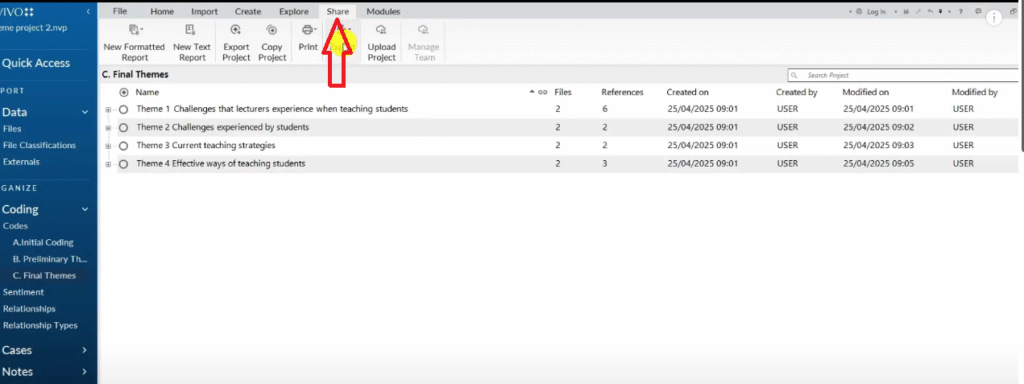
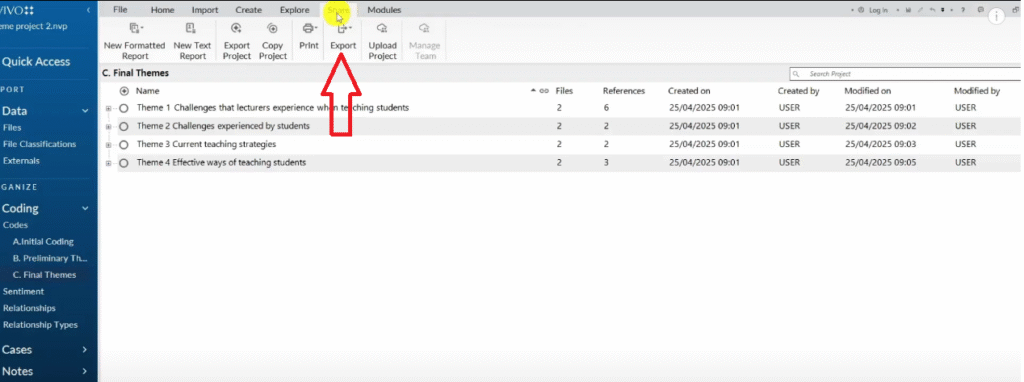
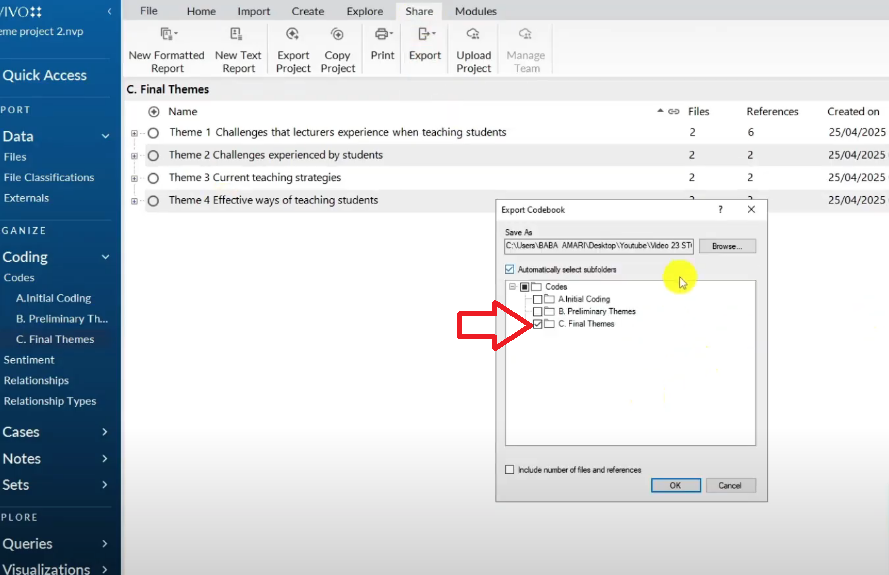
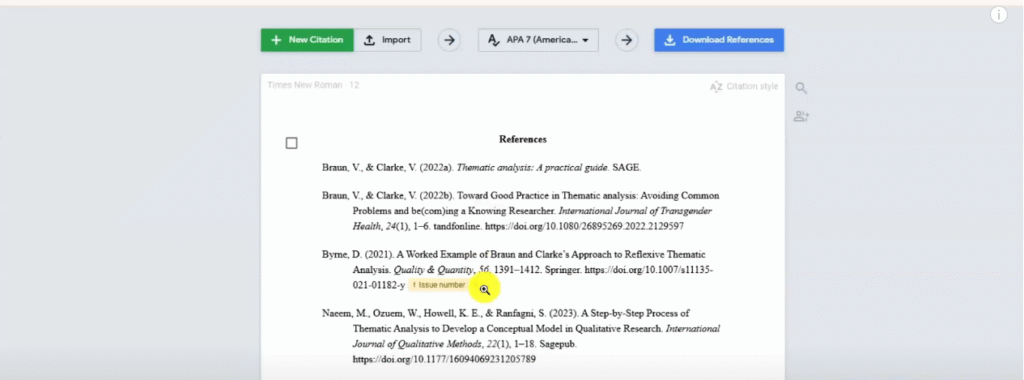
To export the codebook:
- Click the Share button
- Go to Export → Export Codebook
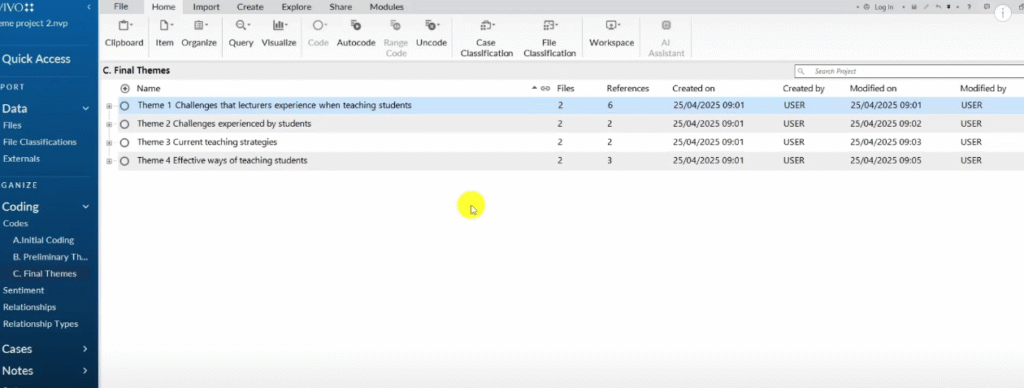
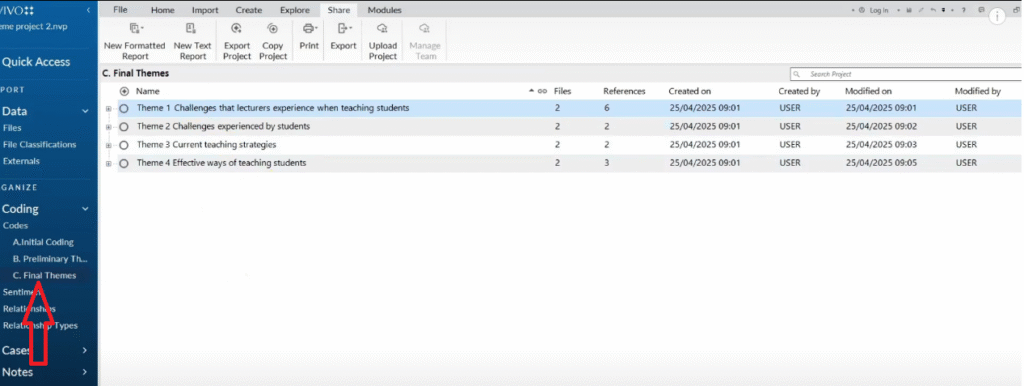
- Select your Final Themes folder
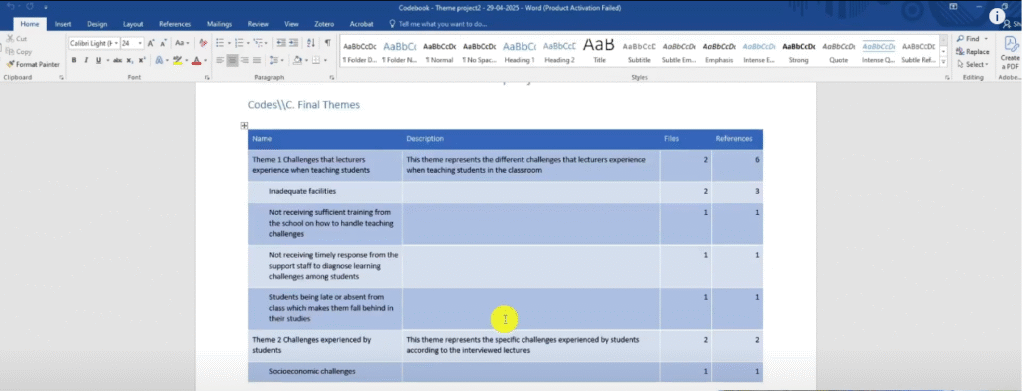
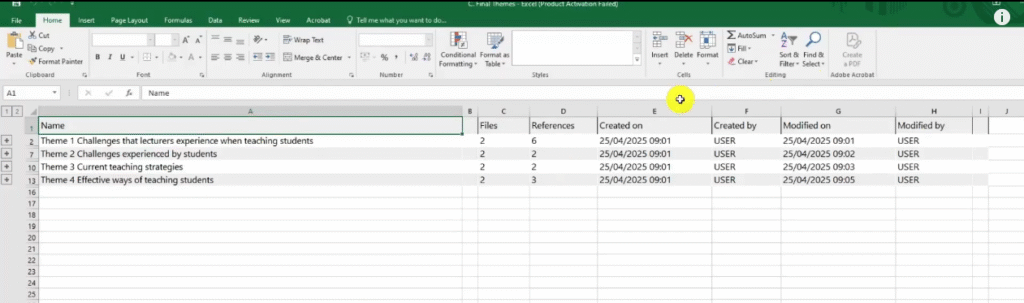
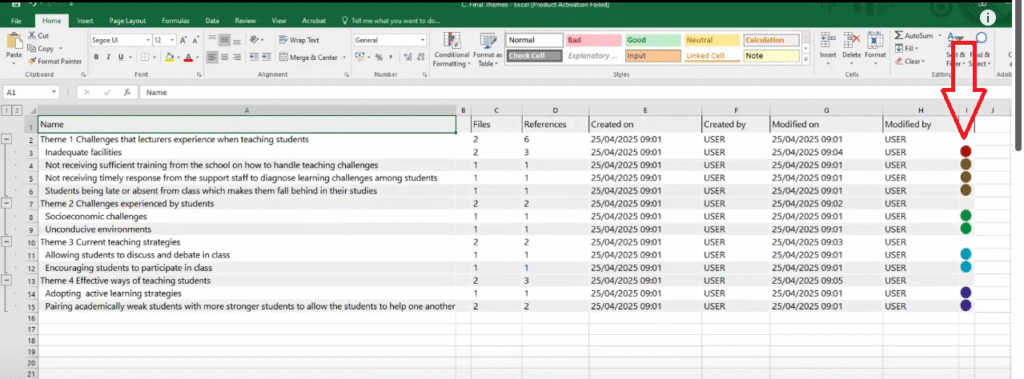
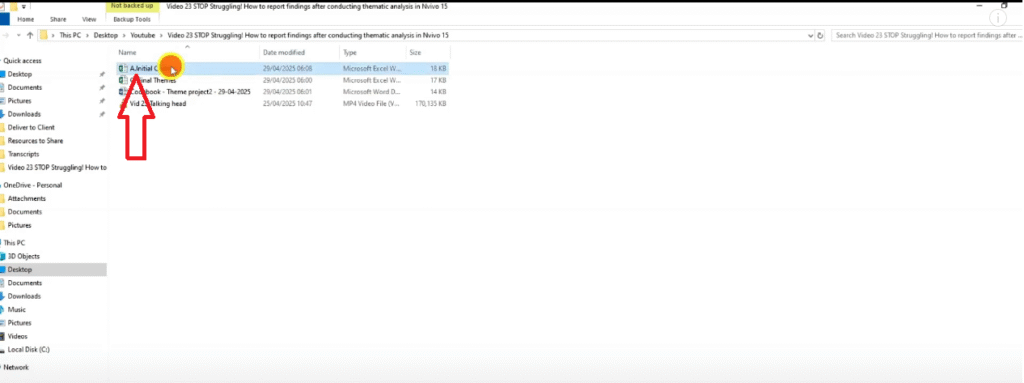
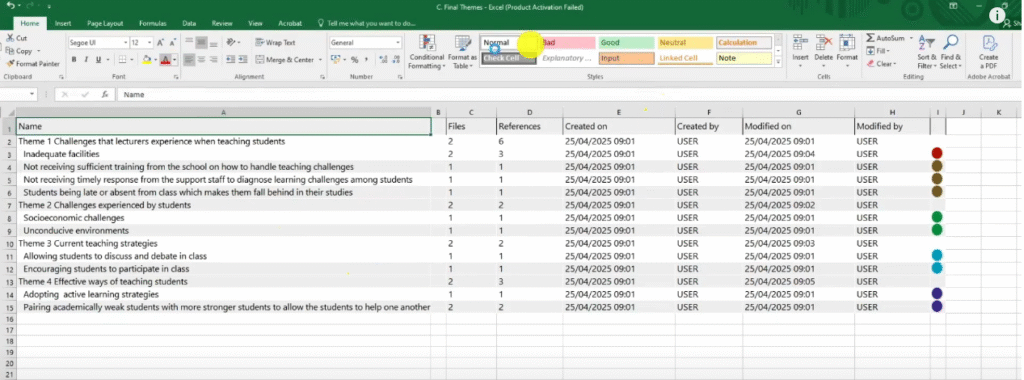
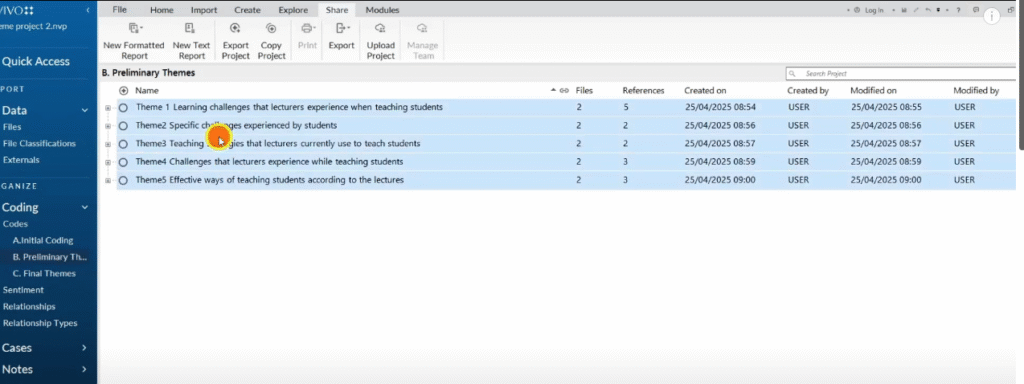
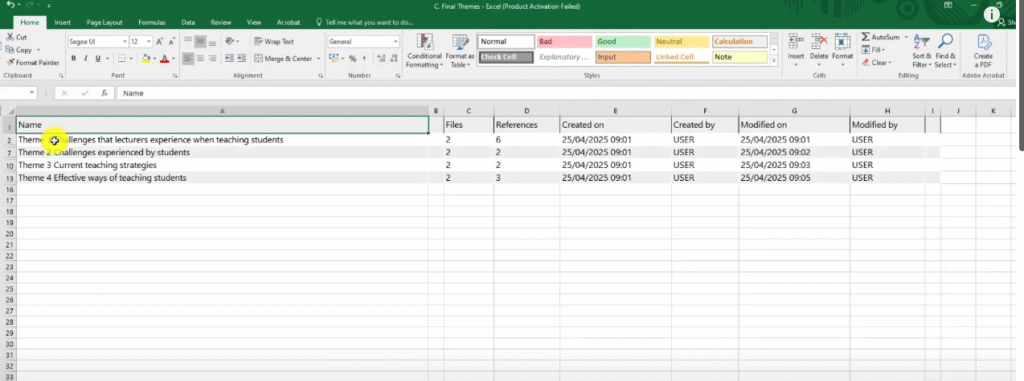
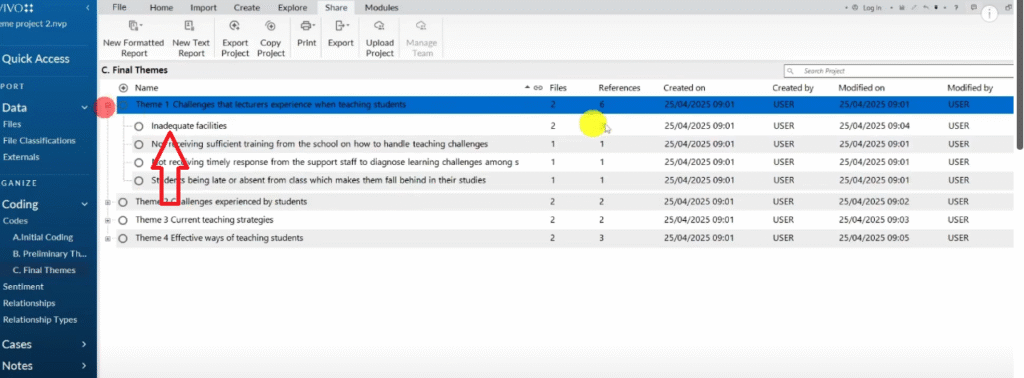
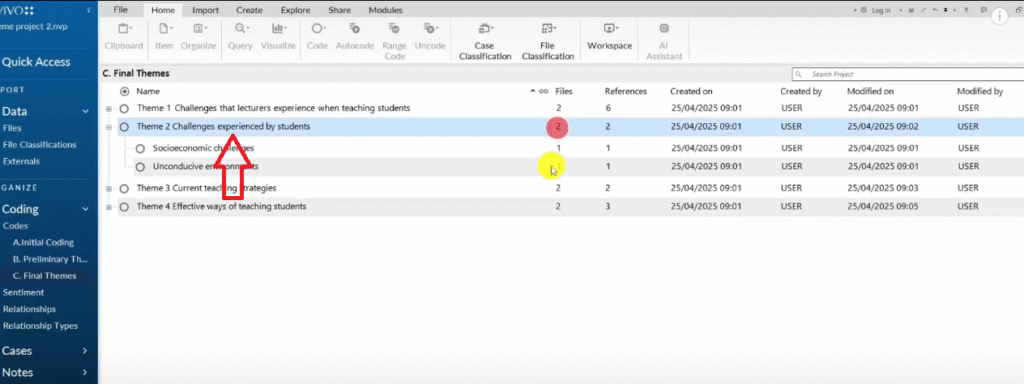
Once exported, open the Excel file — you will see your coding structure with colour codes, theme names, file counts, and reference counts. You will use this file repeatedly throughout your report.
Step 2 — Export Tables from NVivo 15 for Your Report
Exporting the Code List as an Excel Table
Tables are the backbone of a well-evidenced findings report. For each stage of your analysis — initial codes, preliminary themes, and final themes — you need a supporting table.
Here is how to build each one:
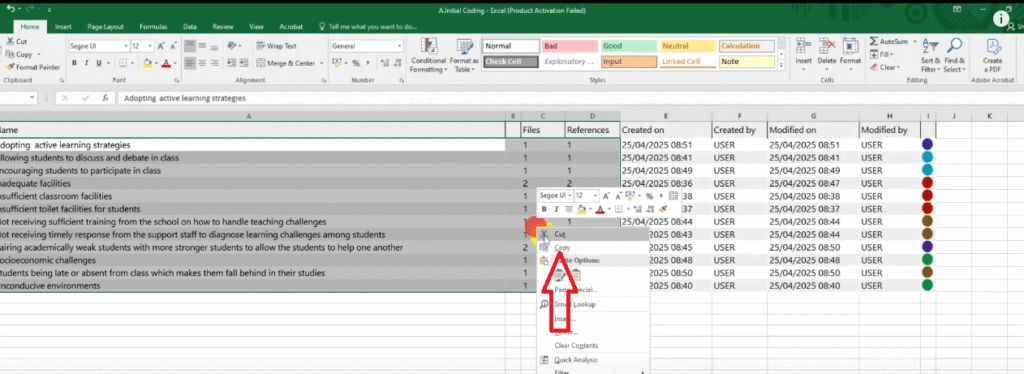
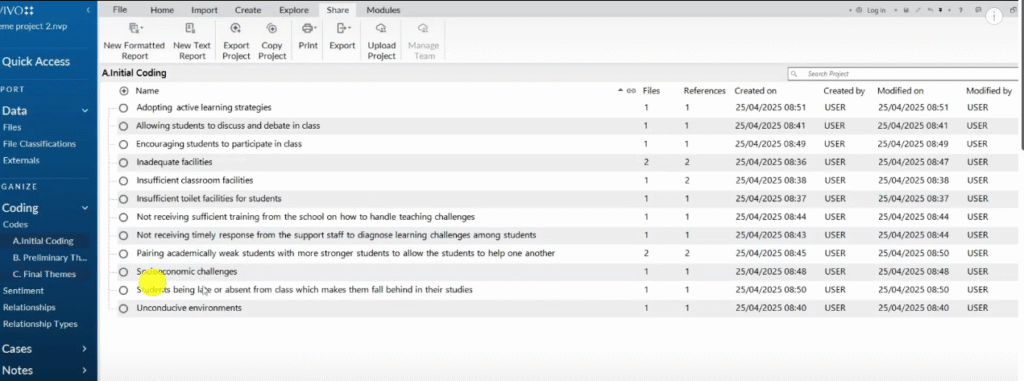
- In NVivo, navigate to the relevant coding folder (e.g., Initial Coding)
- Press Ctrl+A to select all
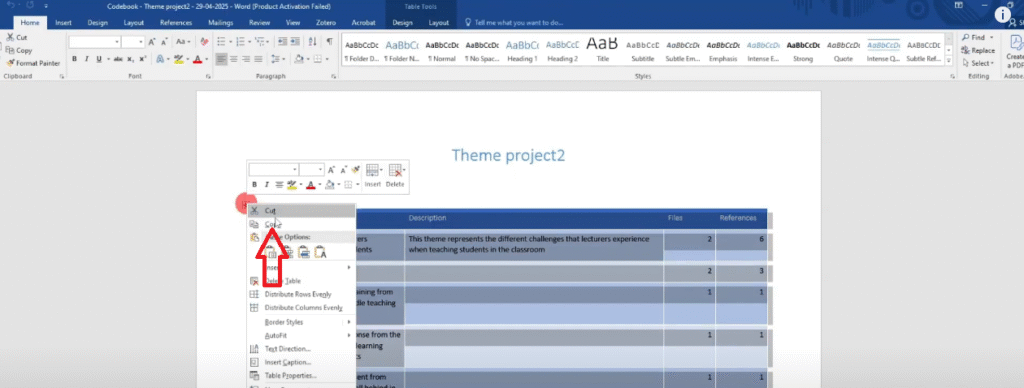
- Right-click → Export → Export List
- Open the exported Excel file
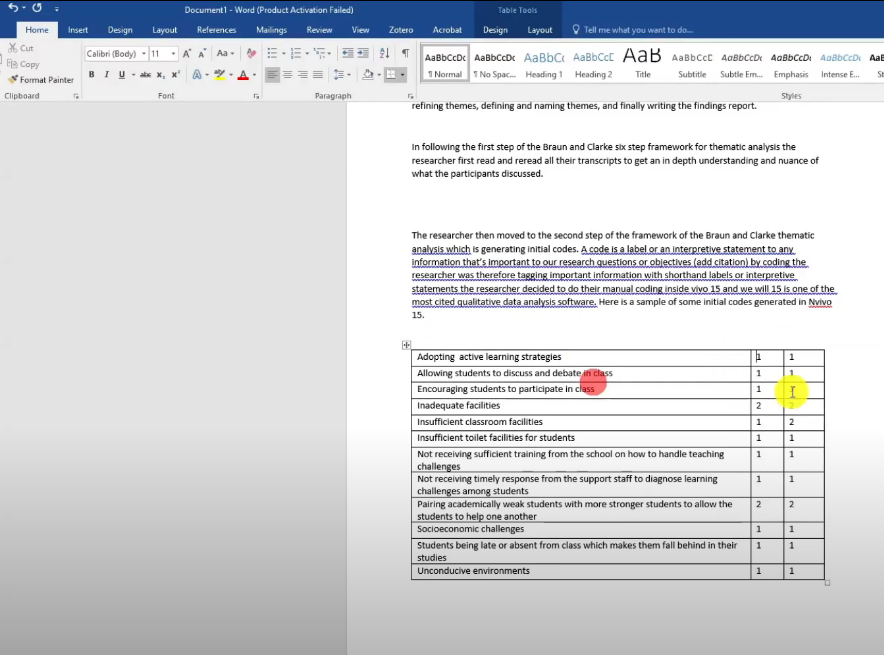
- Copy the code names, file counts, and reference counts columns
- Paste the table into your Word document
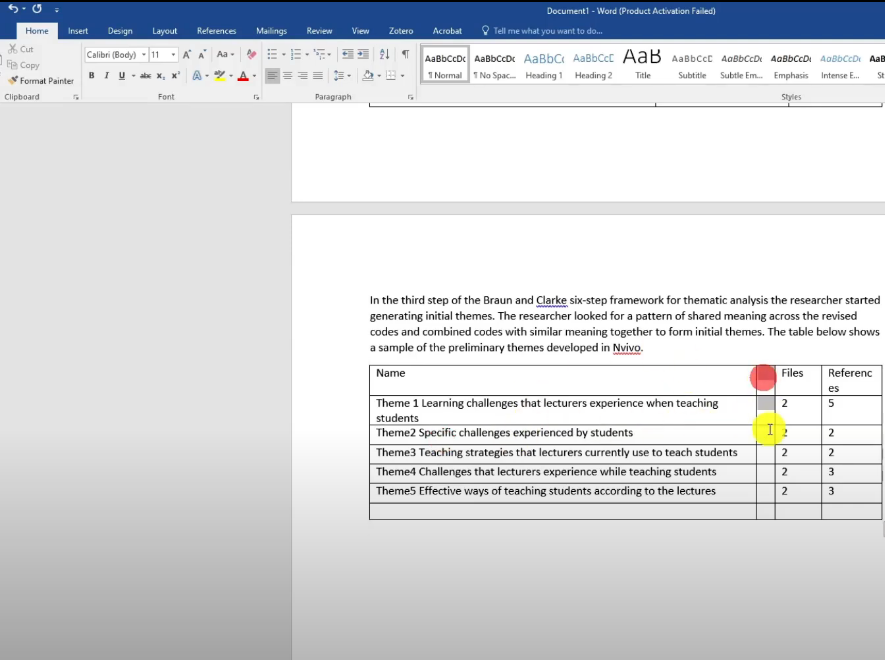
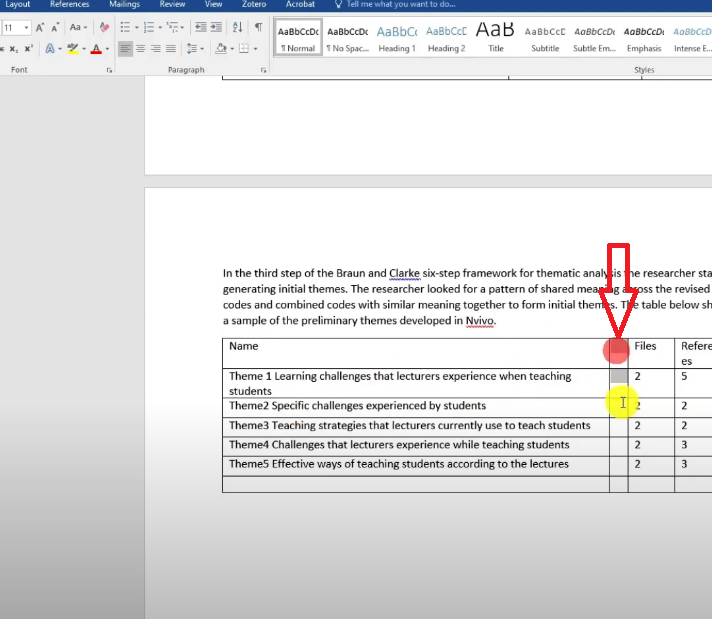
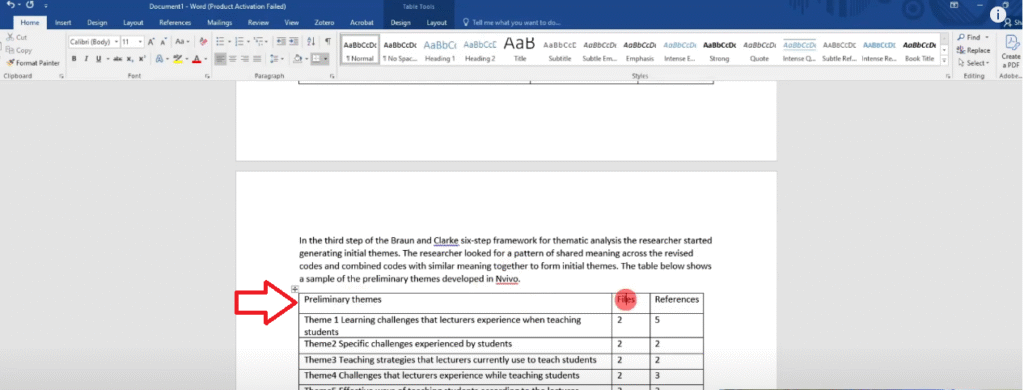
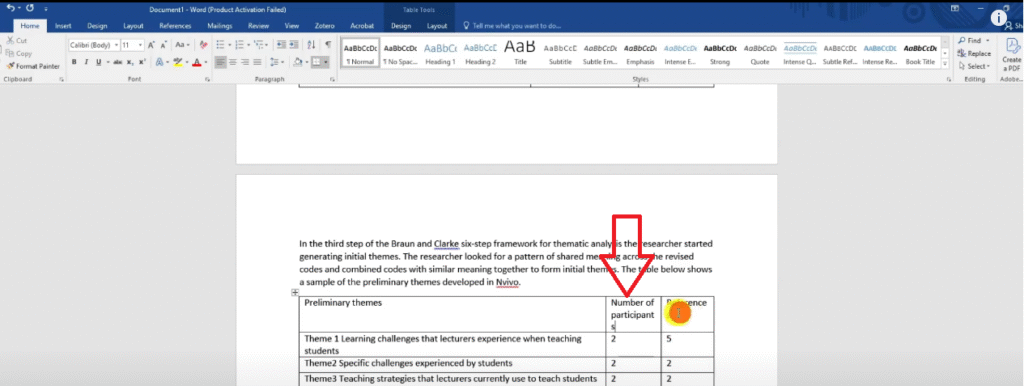
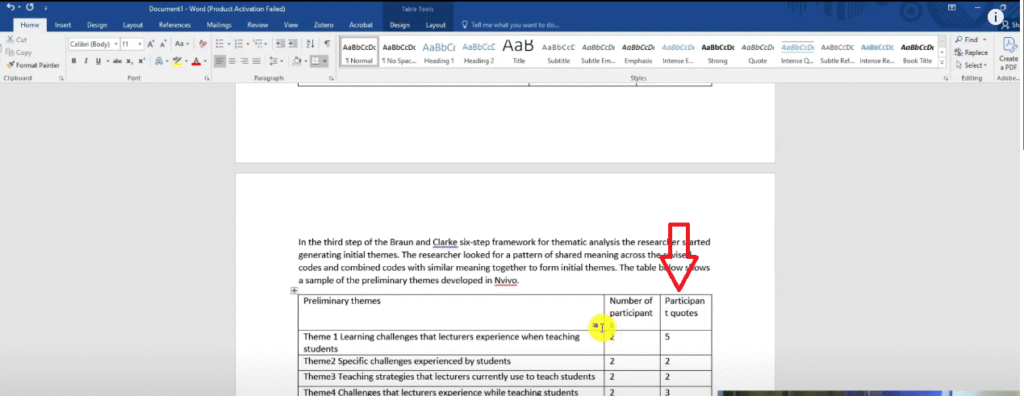
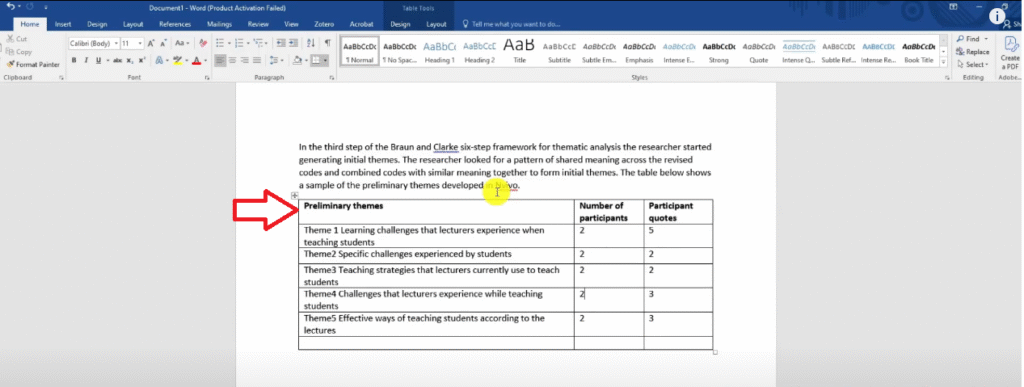
Formatting the Table in Word
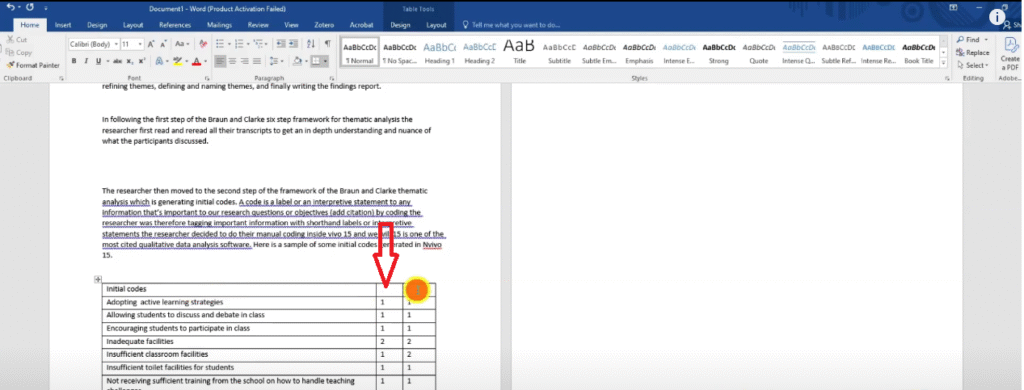
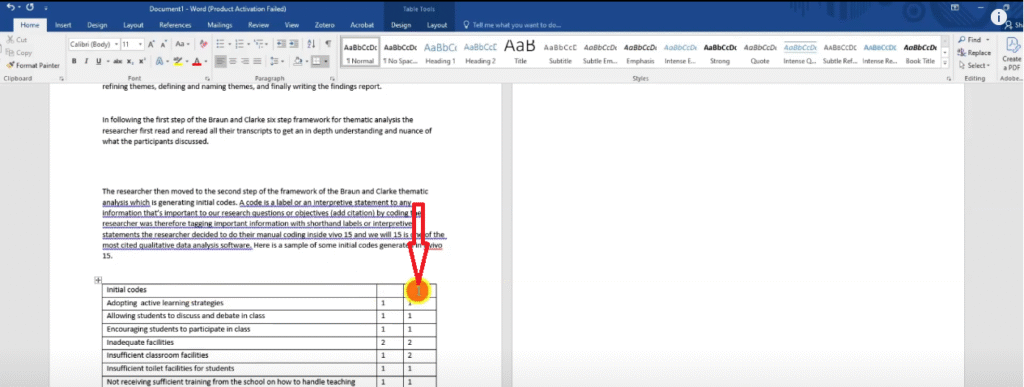
Once pasted into Word, clean up the table as follows:
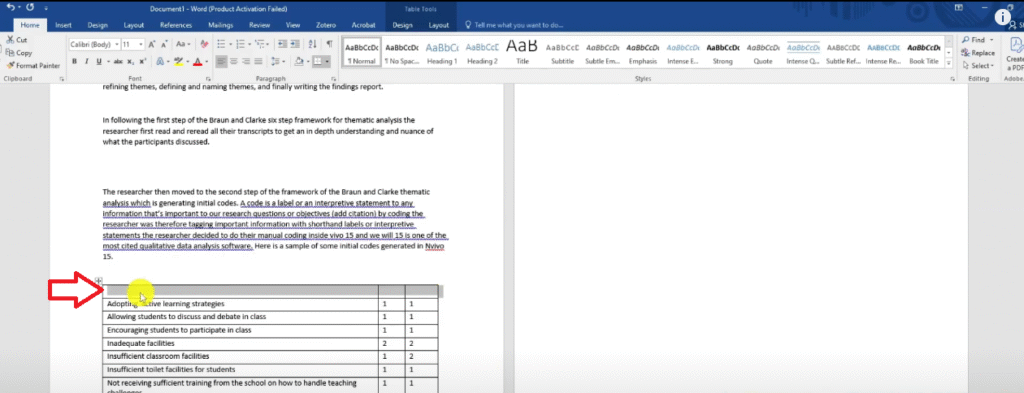
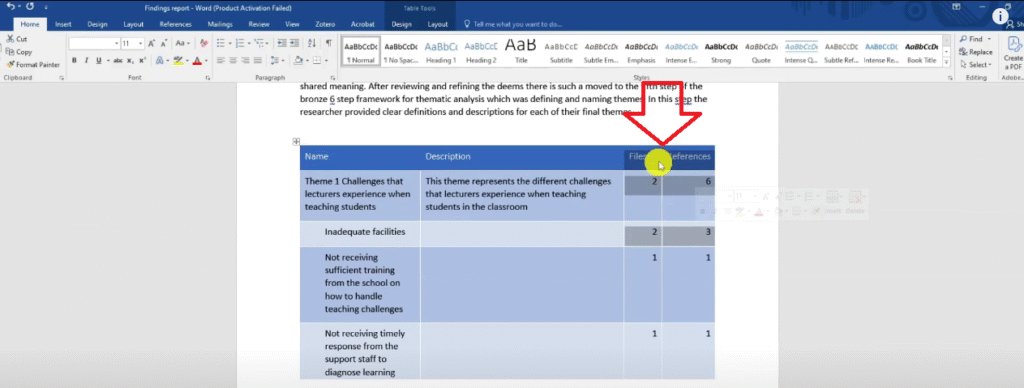
- Remove bold formatting from the body cells — keep the header row bold
- Delete any columns you do not need, such as colour code columns
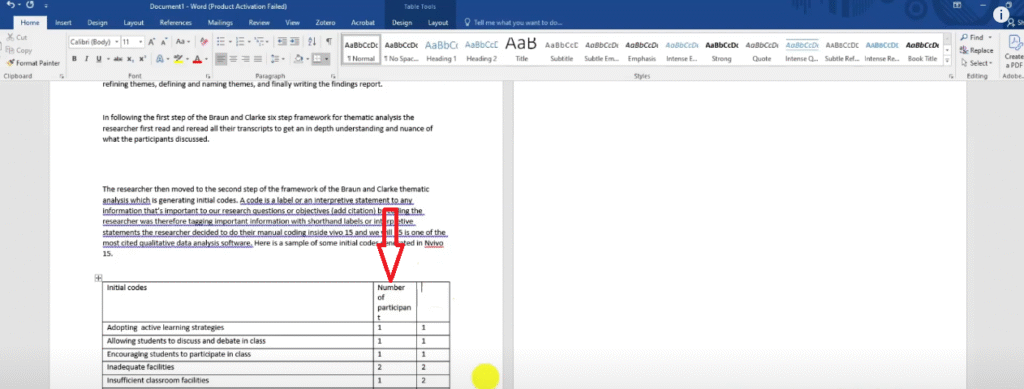
- Rename the “Files” column to “Number of Participants”
- Rename the “References” column to “Participant Quotes”
- Insert a header row and label the table — e.g., “Table 1: Initial Codes Generated in NVivo 15”
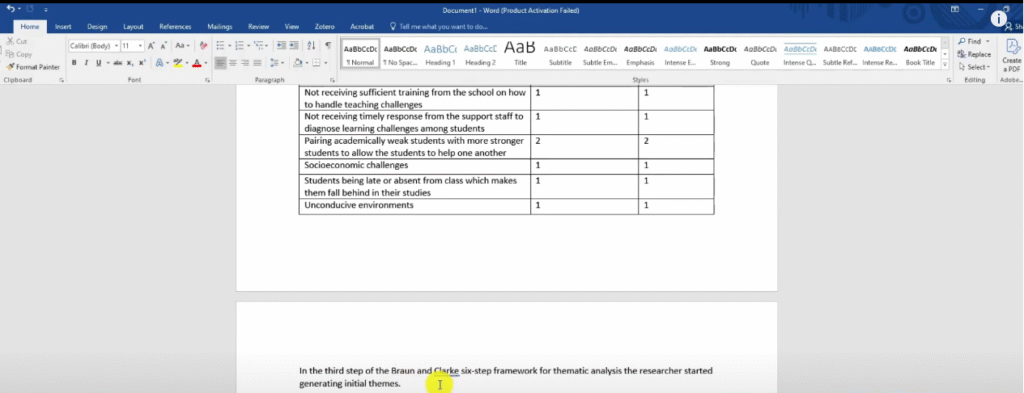
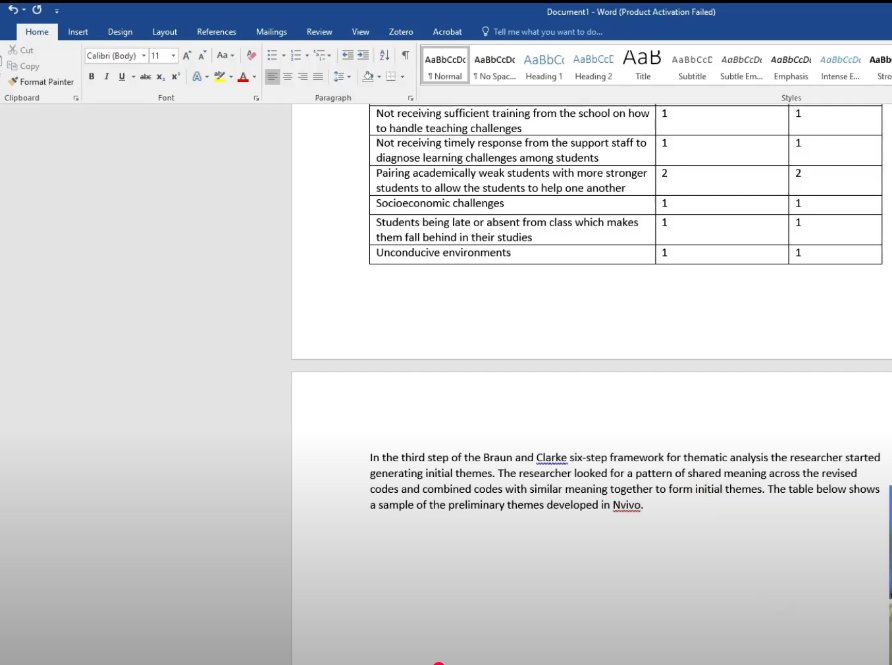
Repeat this process for your preliminary themes table and your final themes table. Each table gives the examiner direct evidence that you followed the Braun and Clarke framework systematically.
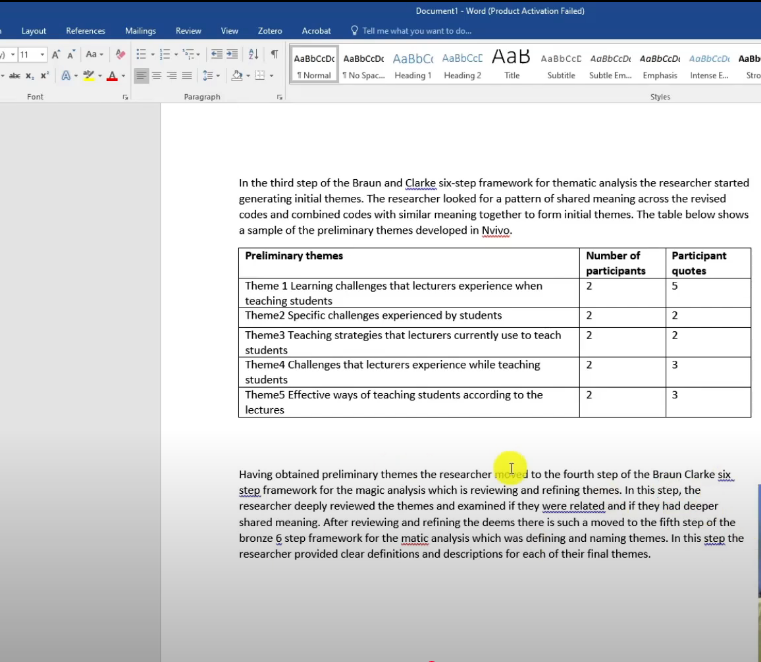
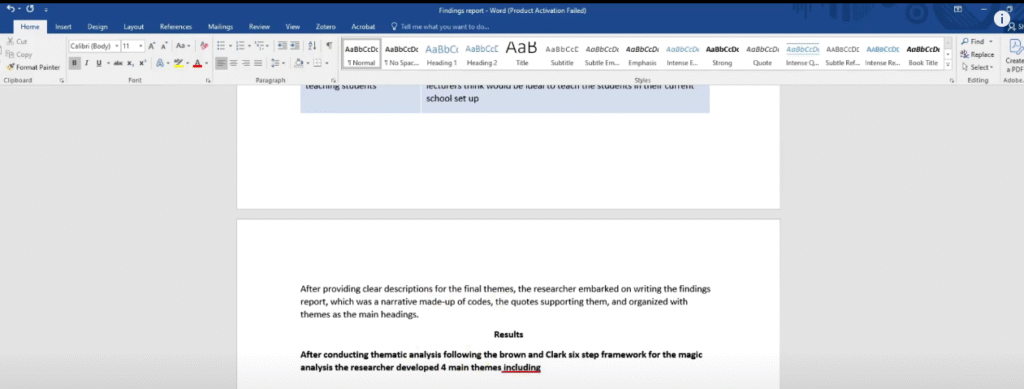
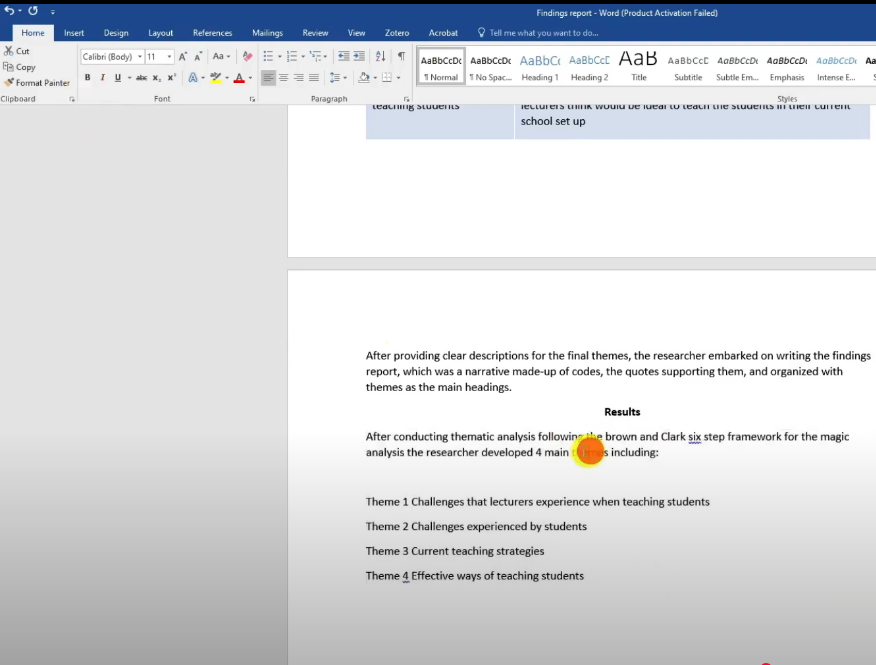
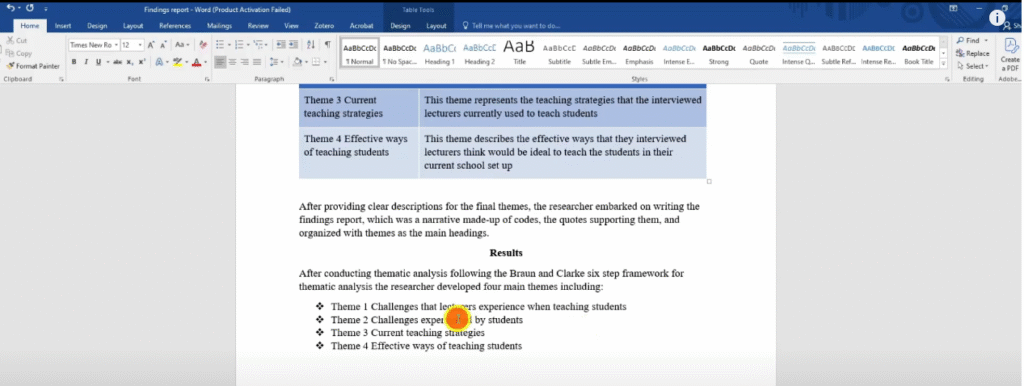
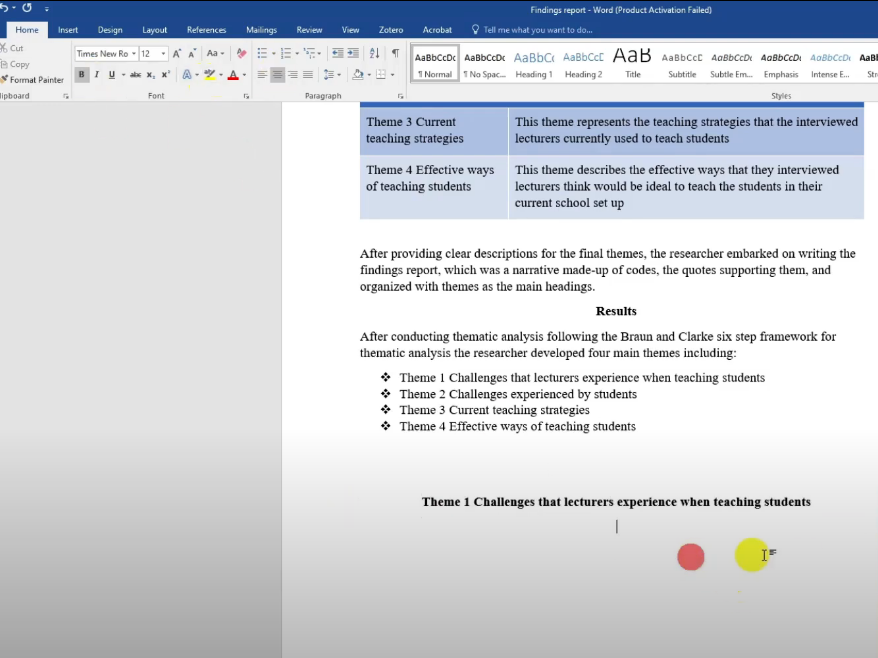
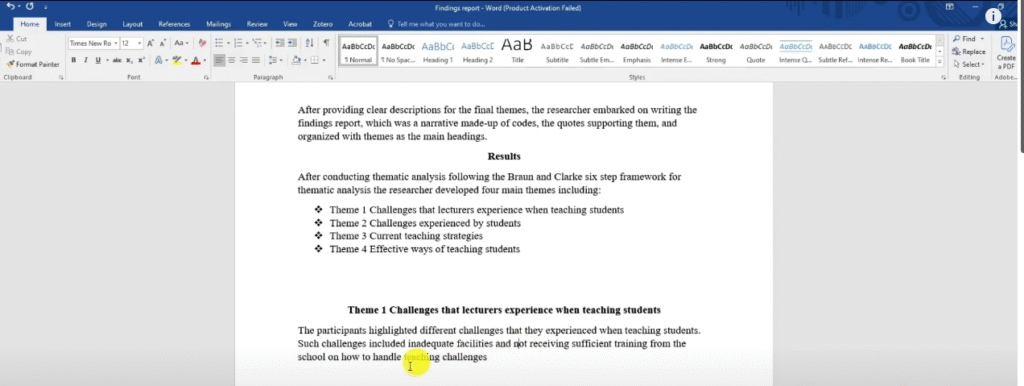
Step 3 — Present Your Themes in Narrative Format
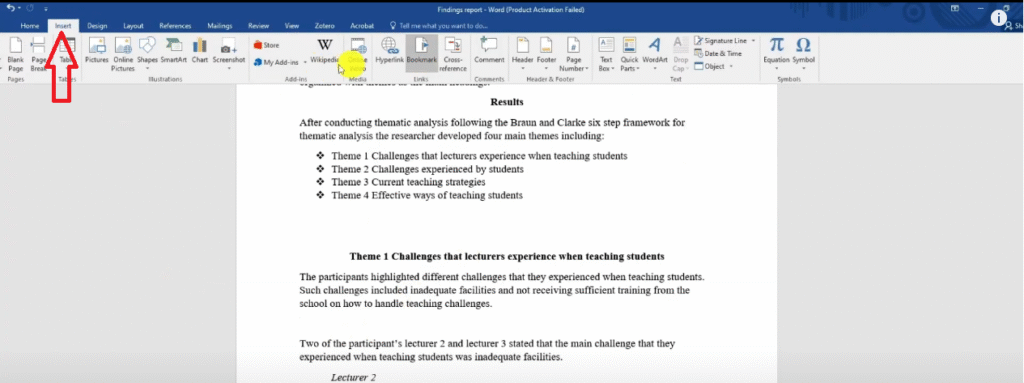
How to Introduce Each Theme
The results section is where you present your findings. Each theme becomes a main heading in your Word document. Under each heading, write a narrative that explains what the theme means, which codes it contains, and what the participants said.
Here is the structure I use for each theme:
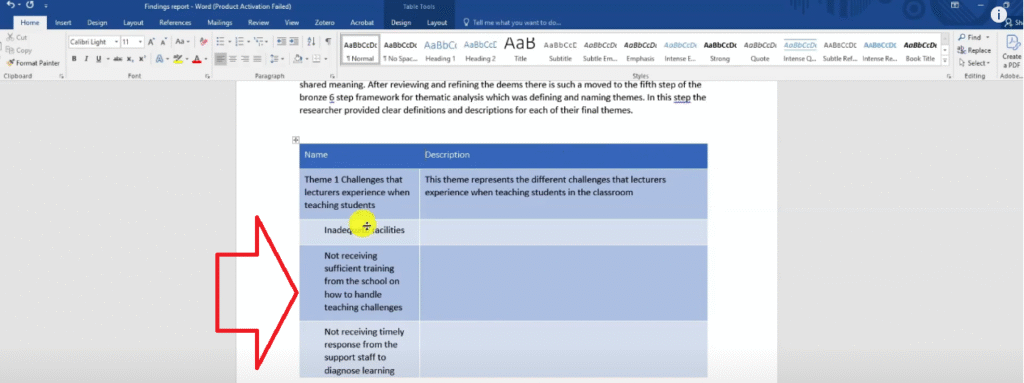
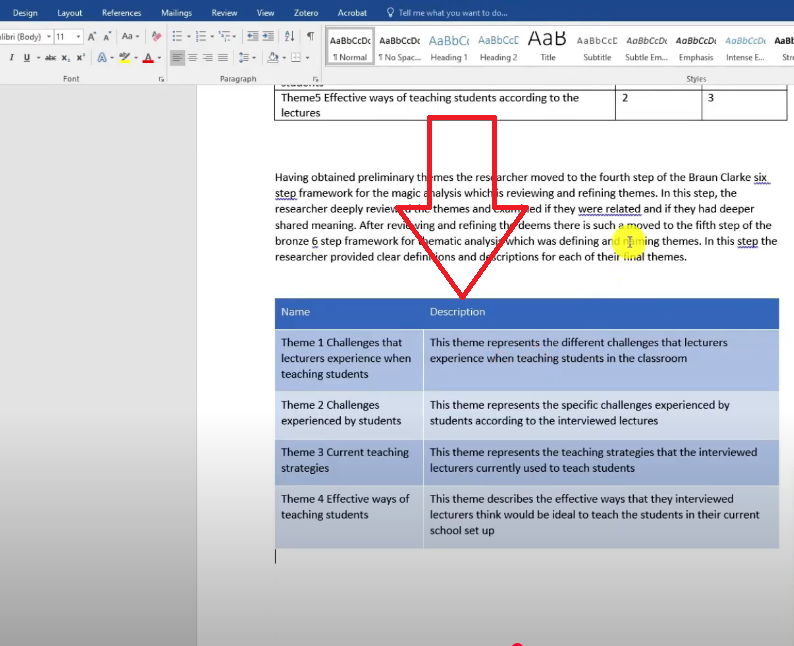
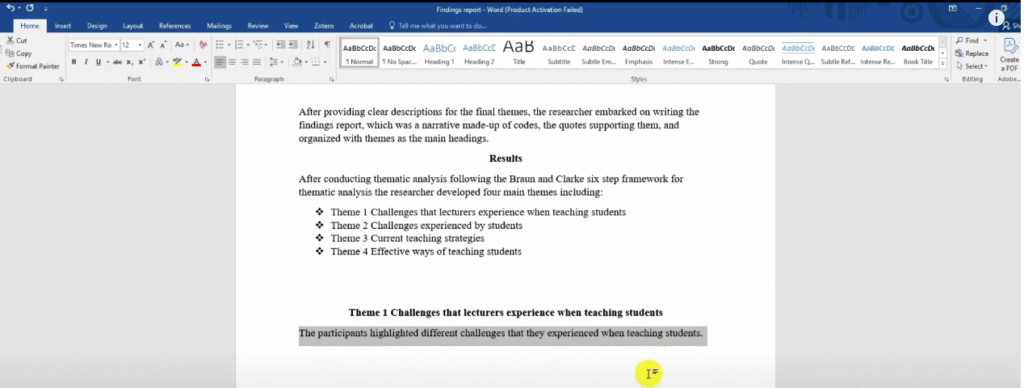
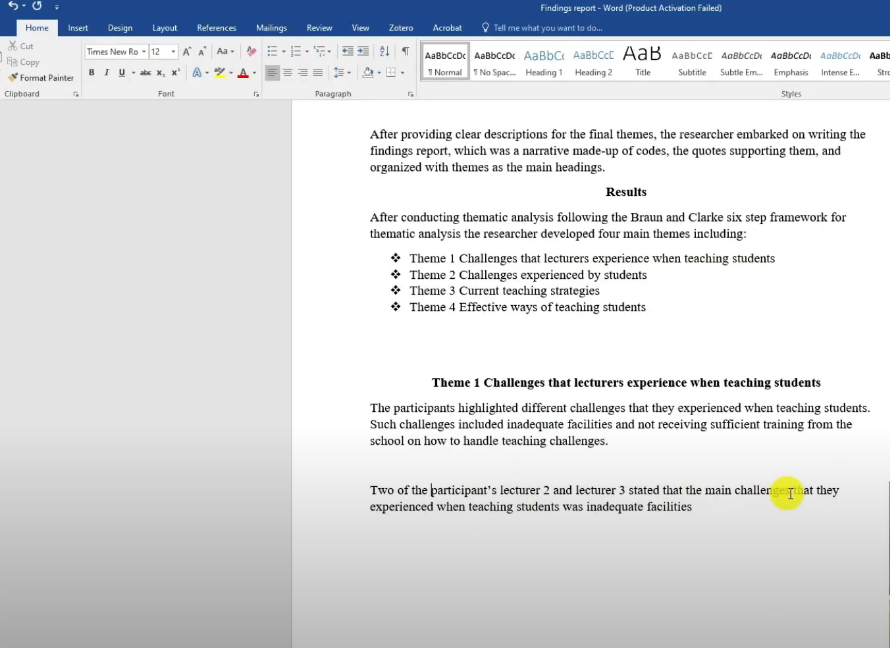
- Theme introduction — one to two sentences defining the theme, drawn from your codebook description, written in past tense
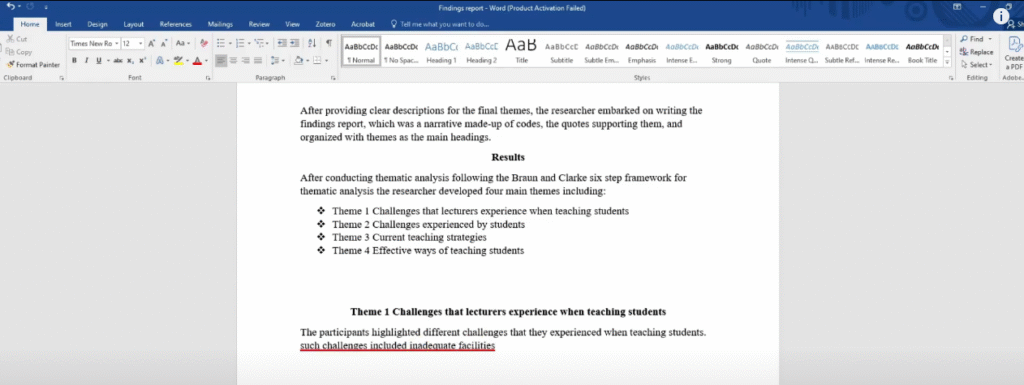
- Overview of codes — a brief sentence naming the codes within the theme
- Code-by-code narrative — for each code, state how many participants mentioned it, then provide a supporting quote
For example:
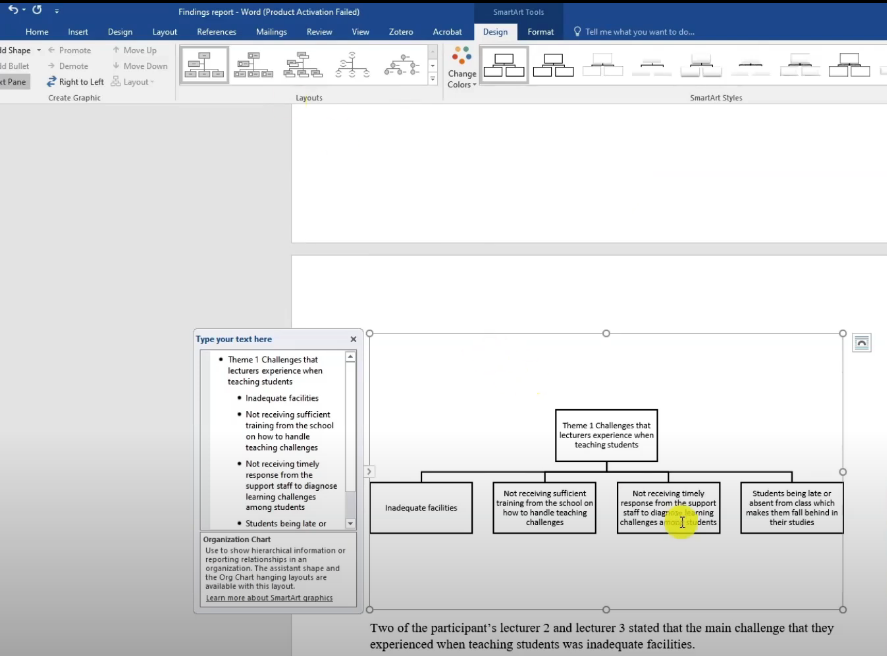
This theme represented the different challenges that lecturers experienced when teaching students in the classroom. Participants highlighted two main challenges within this theme: inadequate facilities and insufficient training.
How we represent our themes
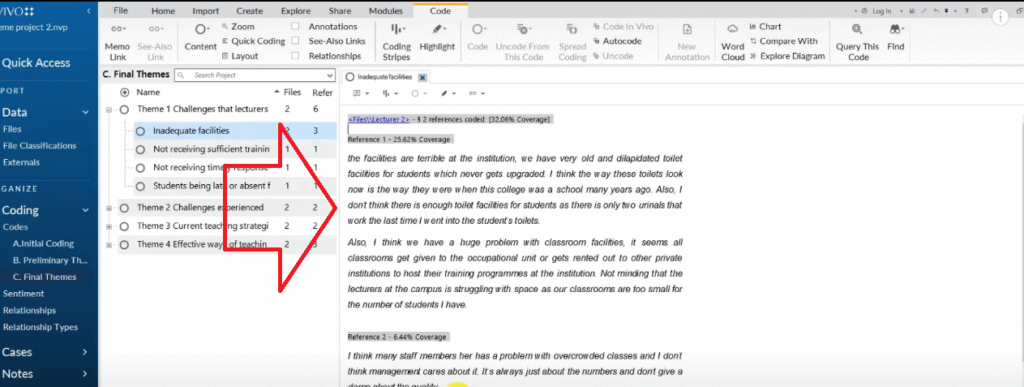
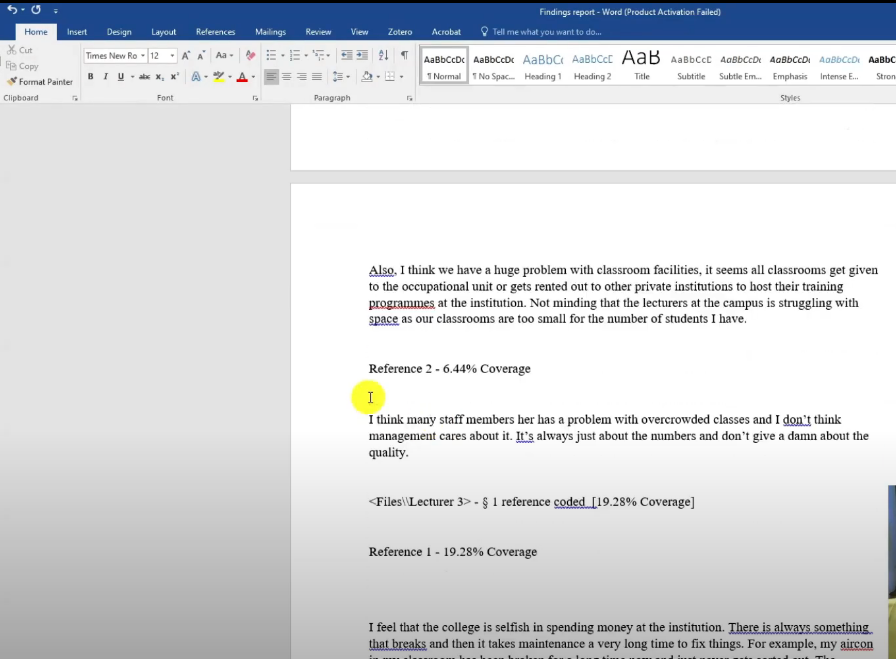
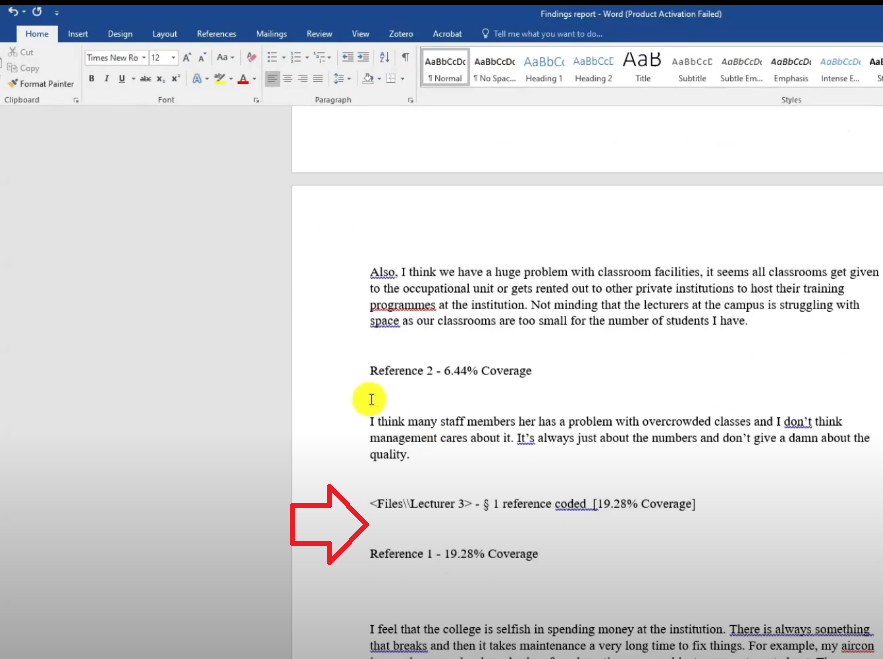
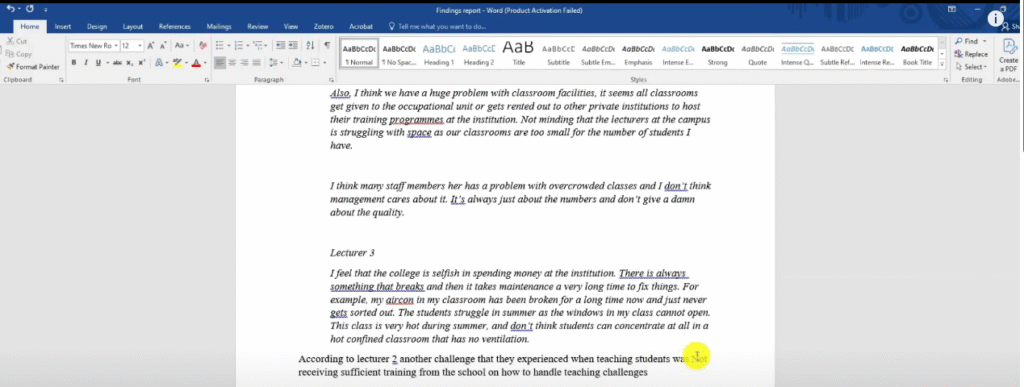
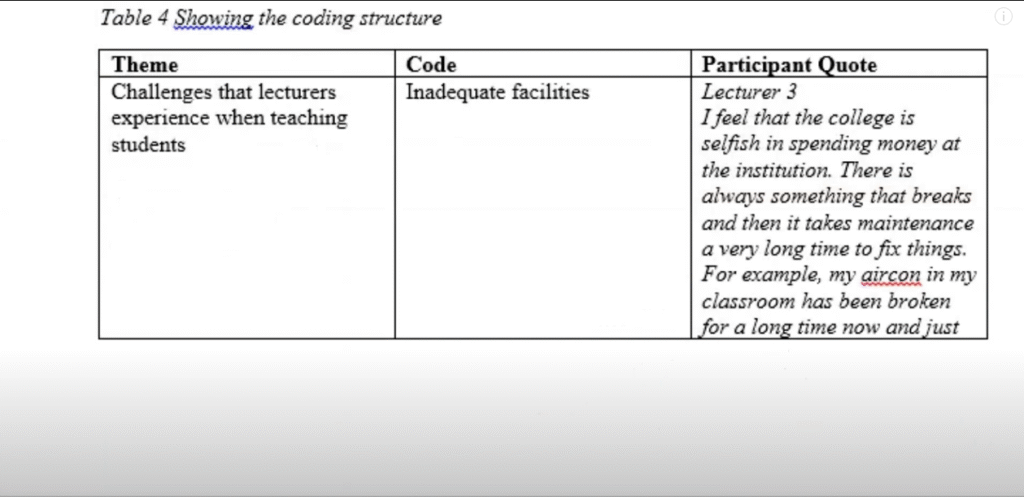
Incorporating Participant Quotes
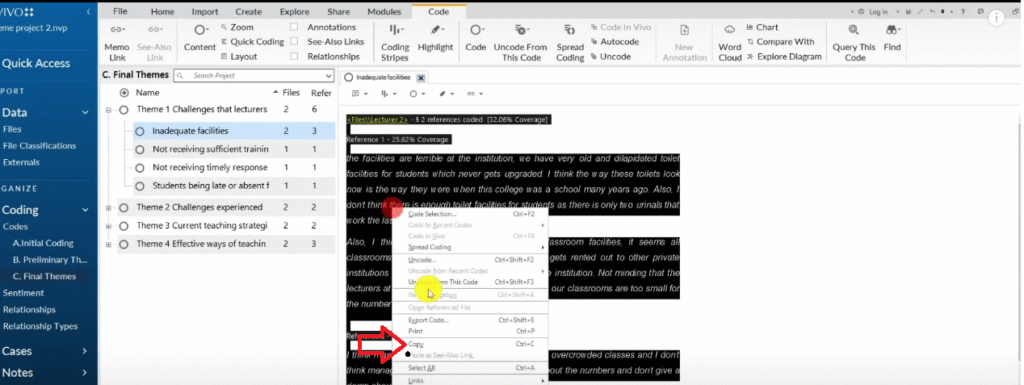
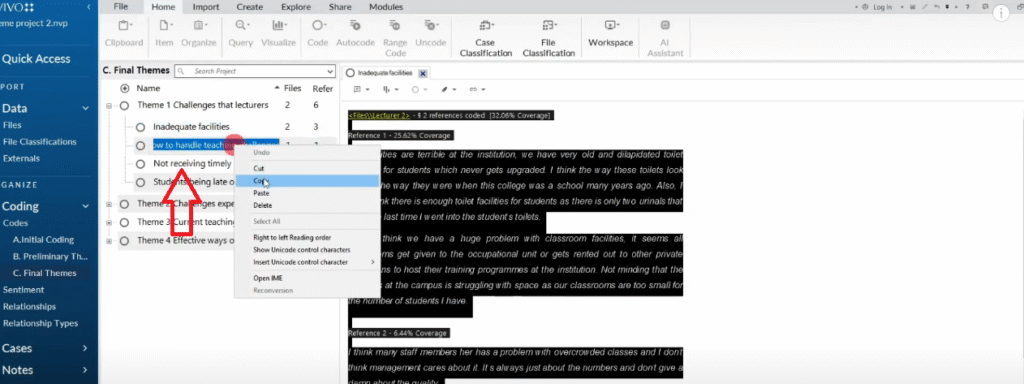
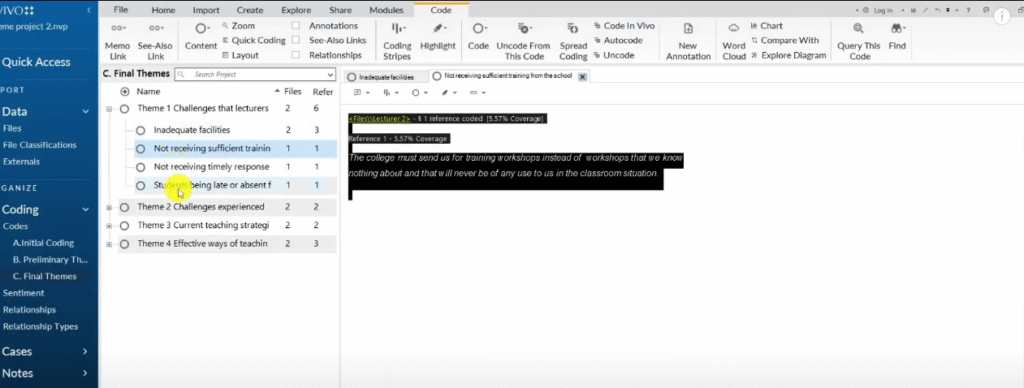
After each code explanation, insert a direct quote from NVivo to support it. Here is how to extract quotes:
- In NVivo, double-click on the code to open the coded segments
- Press Ctrl+A to select all segments
- Copy the content and paste it into your Word document
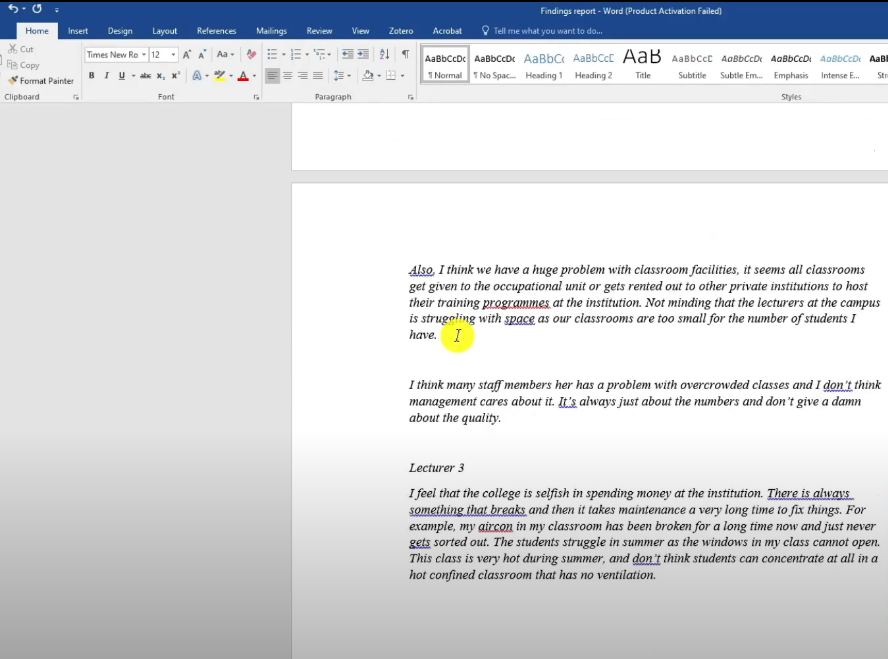
- Delete the NVivo metadata columns — Files, Coverage, and so on
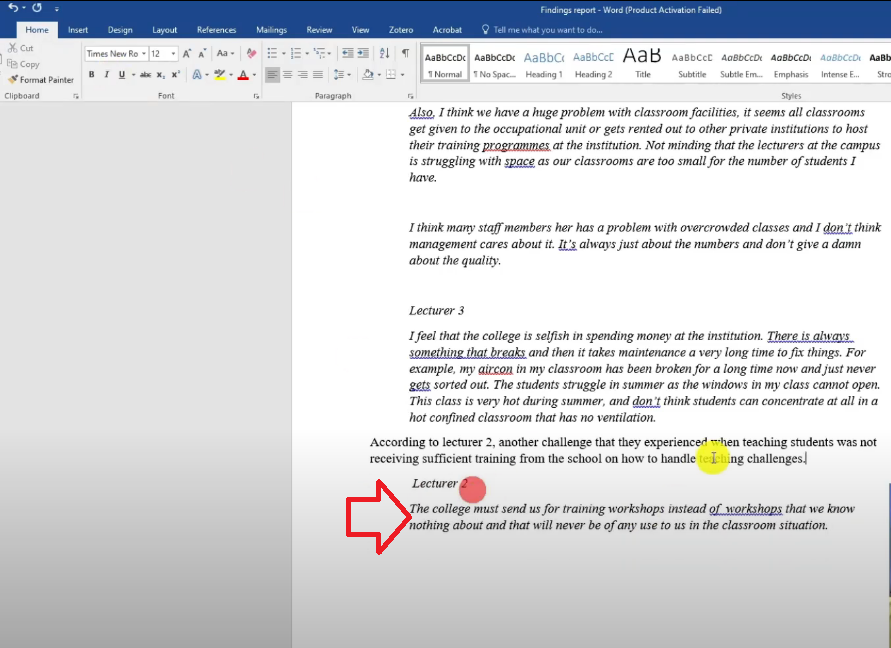
- Format the quote in italics and indent it using the Tab key
This structure — code name, number of participants, participant quote — is the standard format that most examiners expect in a qualitative findings chapter.
Step 4 — Add Visuals to Your Findings Report
Visuals make your findings report more readable and give examiners a clear picture of your coding structure at a glance. I use four types of visuals in NVivo findings reports.
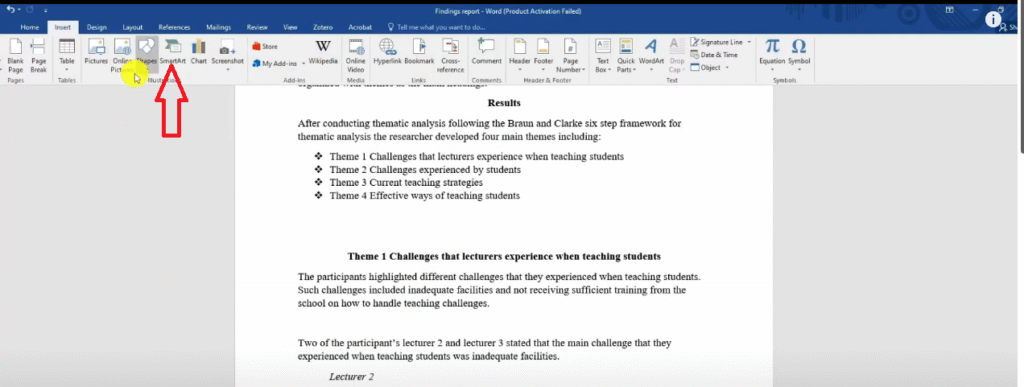
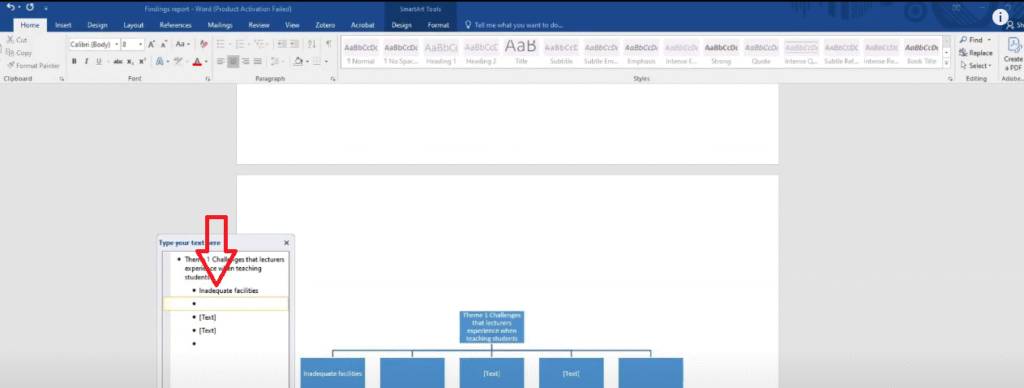
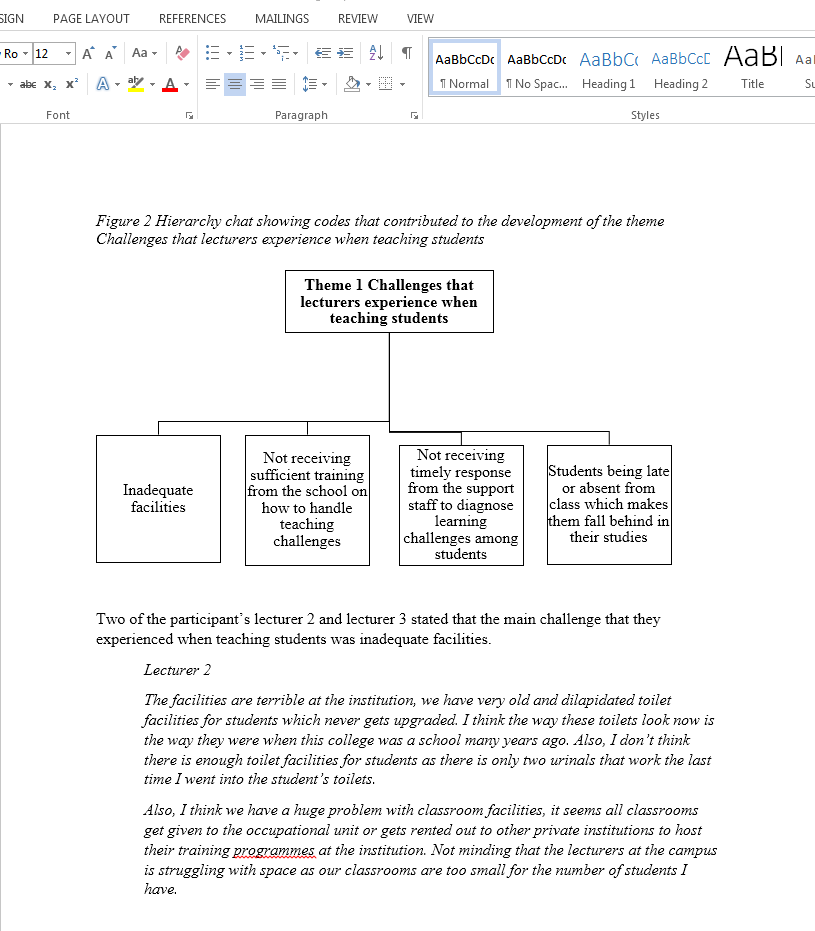
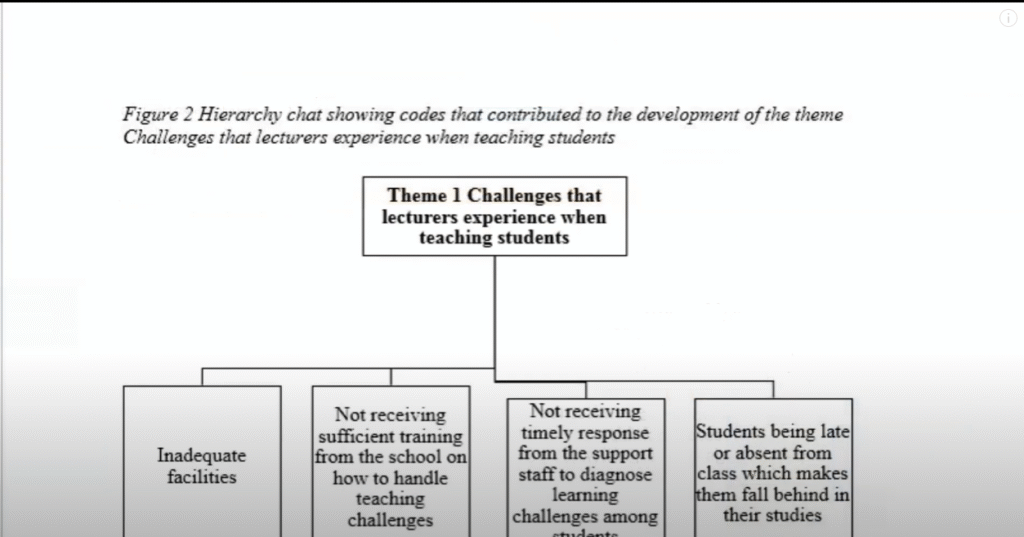
Hierarchy Charts (SmartArt in Word)
I prefer building hierarchy charts in Microsoft Word rather than NVivo because Word produces editable, print-ready graphics.
To create one:
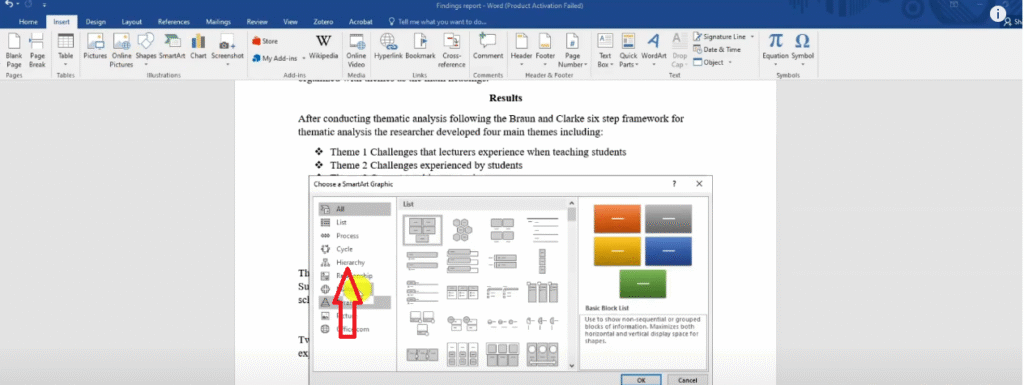
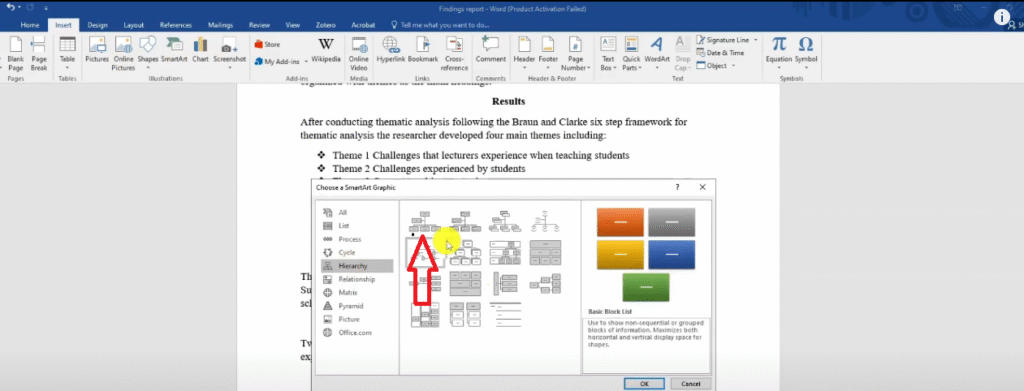
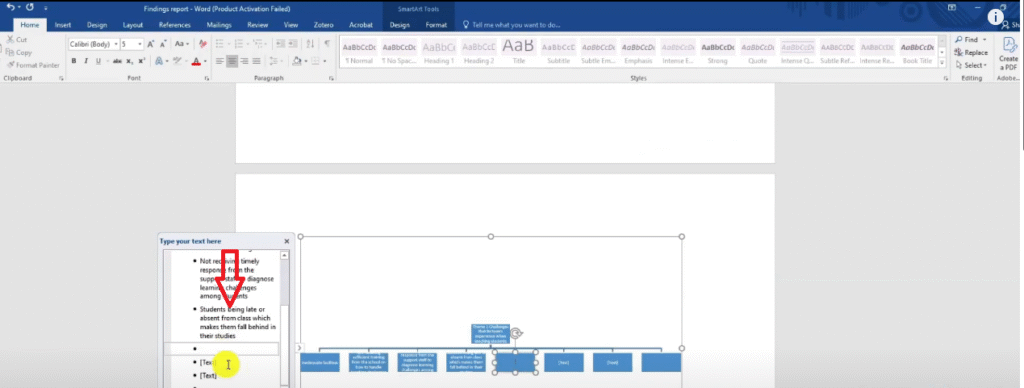
- In Word, go to Insert → SmartArt → Hierarchy
- Select the first option and click OK
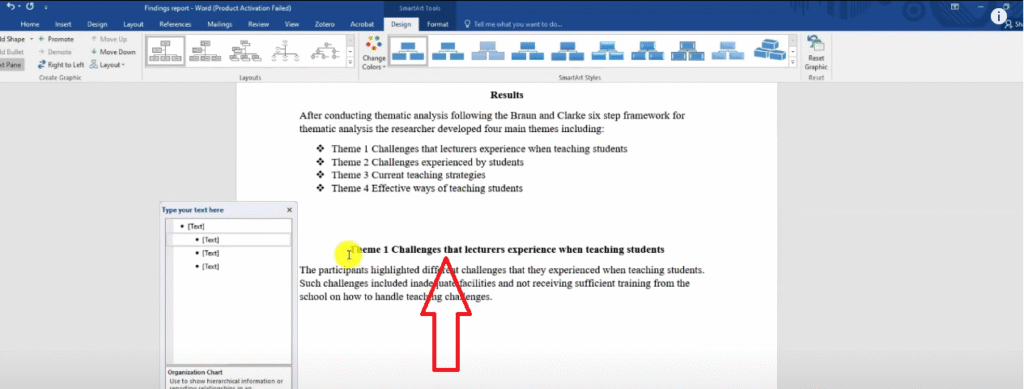
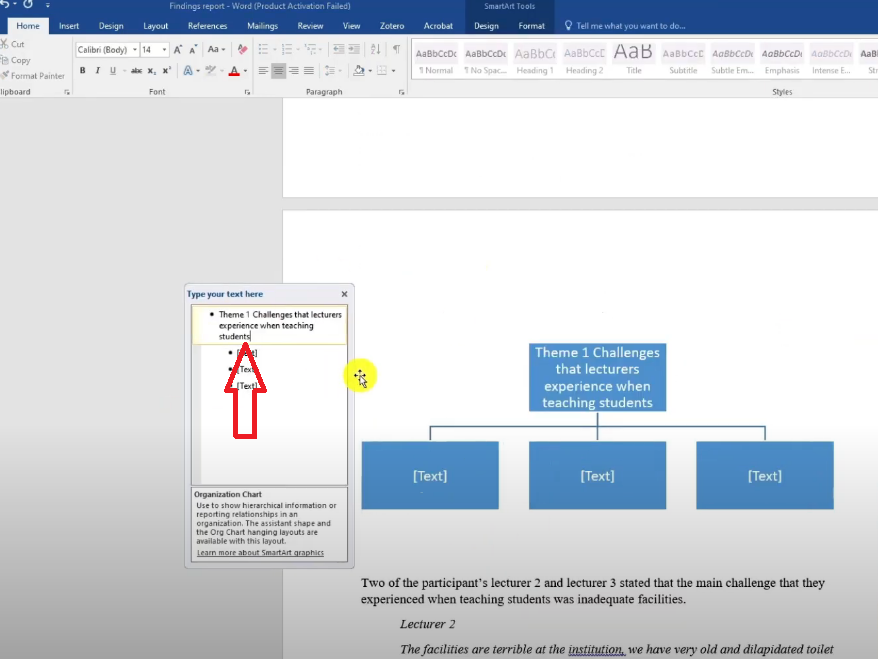
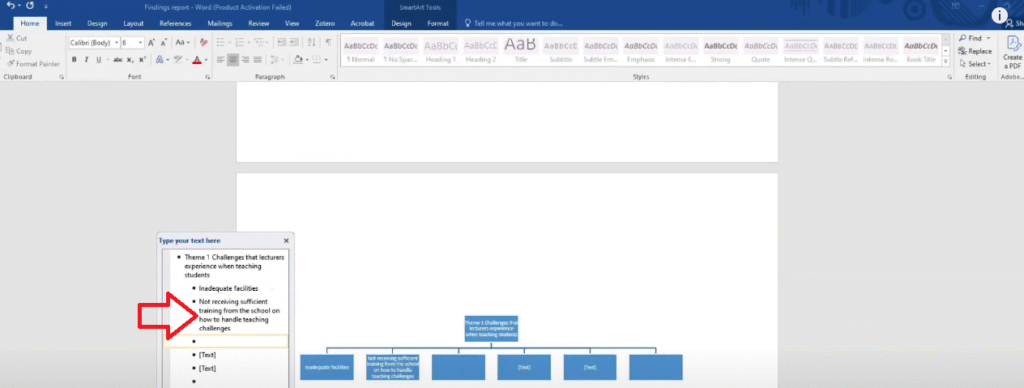
- Type your theme name in the top box
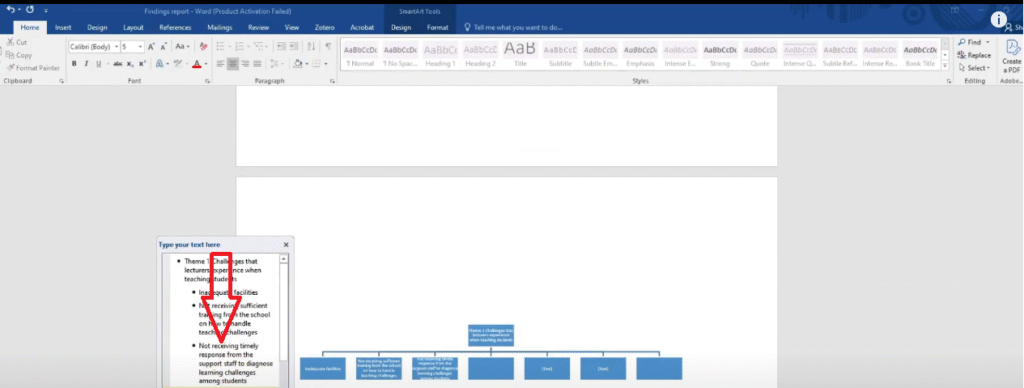
- Add one box for each code under that theme
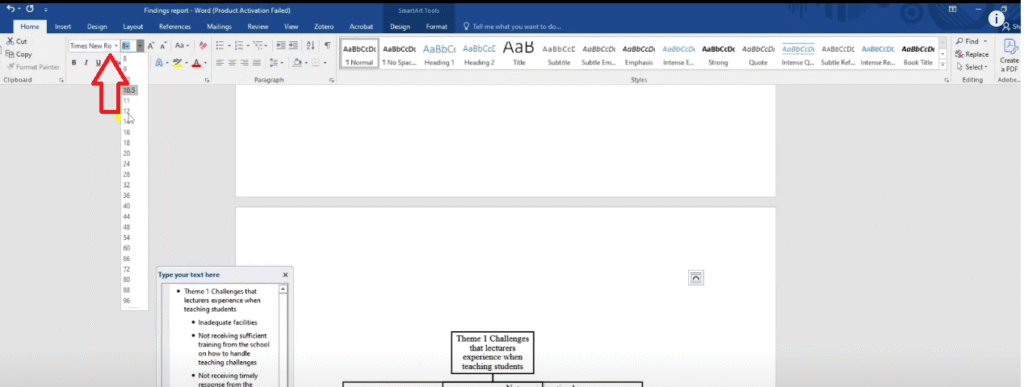
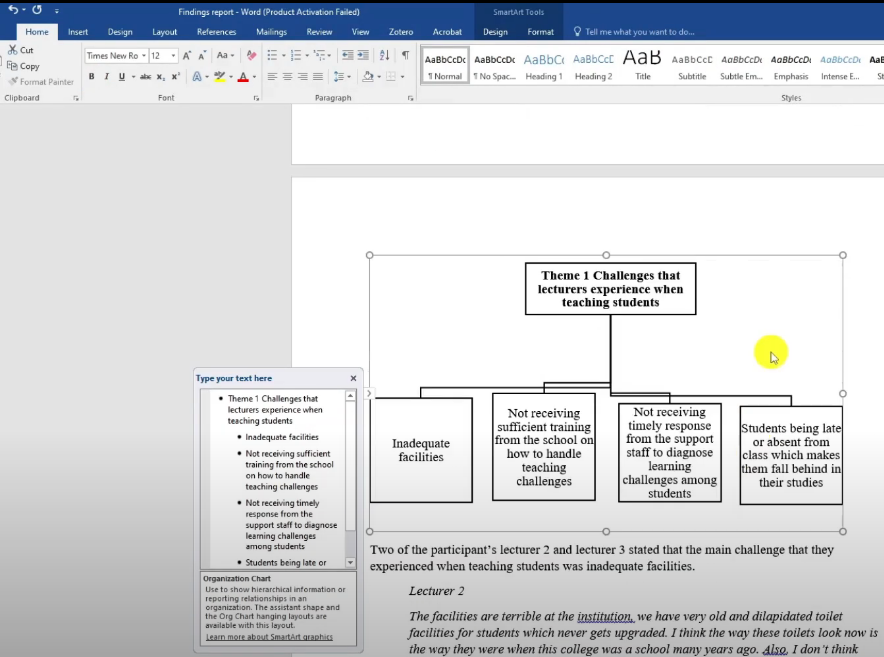
- Go to Change Colors → Black and White for print formatting
- Set the font to Times New Roman, size 12, to match your document
Place this chart at the start of each theme section, before you begin the narrative.
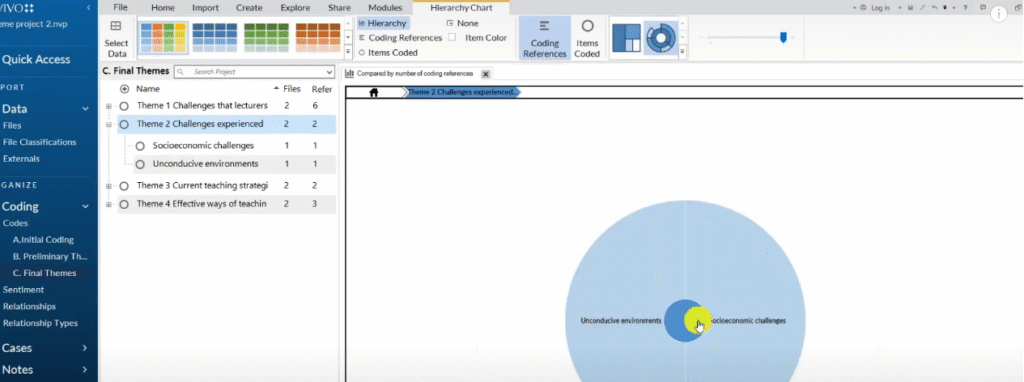
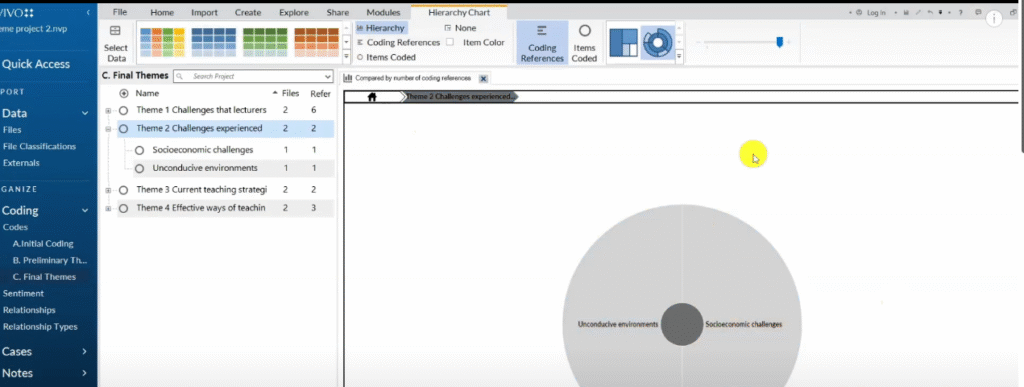
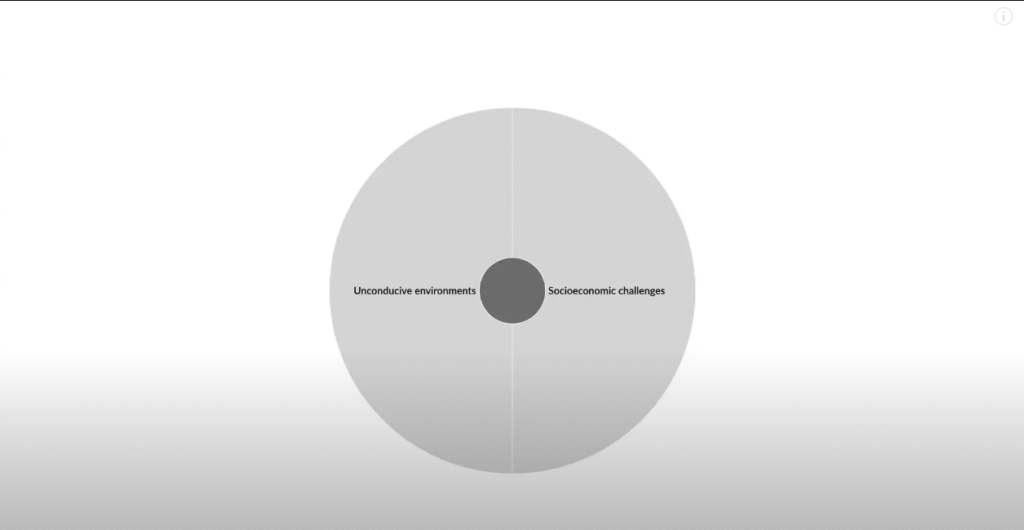
Sunburst Charts from NVivo 15
A sunburst chart shows which codes within a theme were most prominent, based on the number of references. To create one:
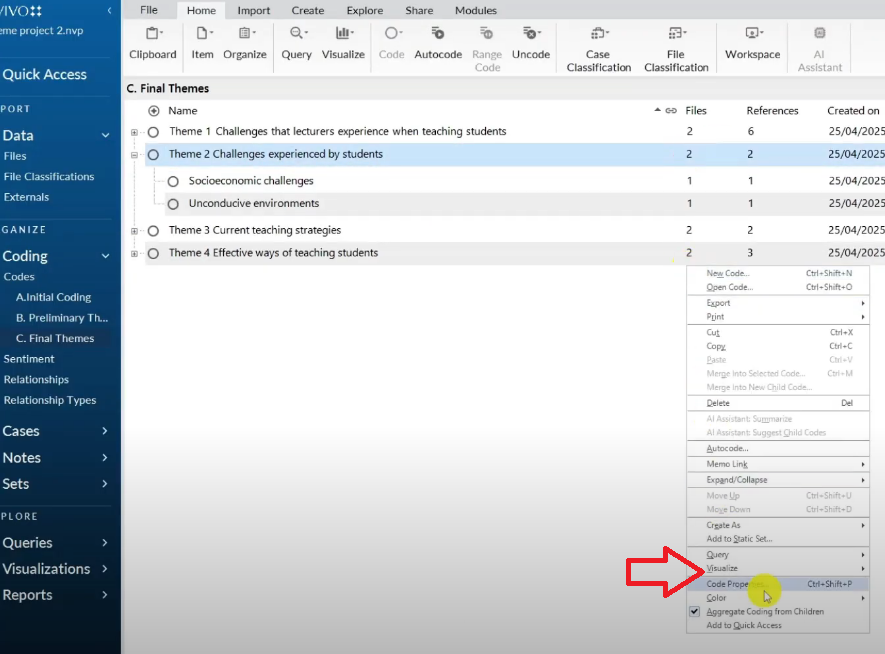
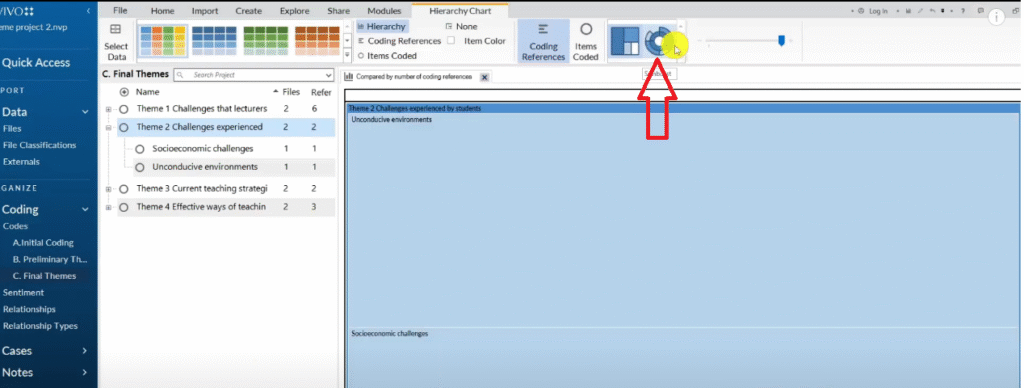
- In NVivo, select the theme folder
- Go to Visualize → Hierarchy Chart → Sunburst
- Format to black and white
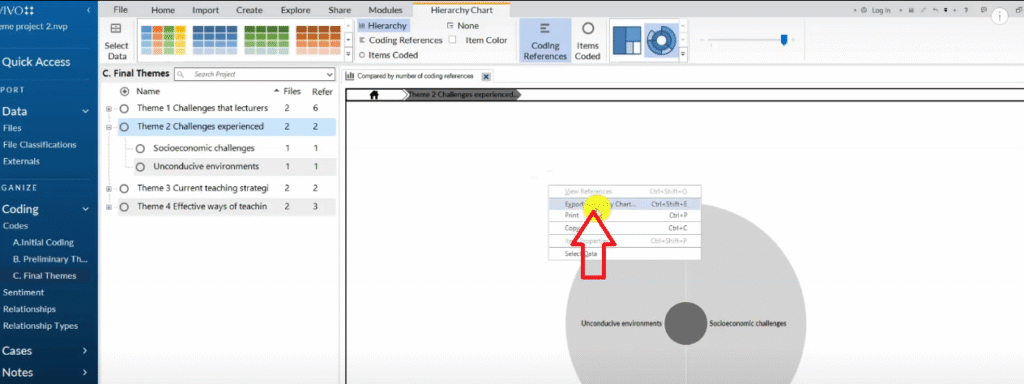
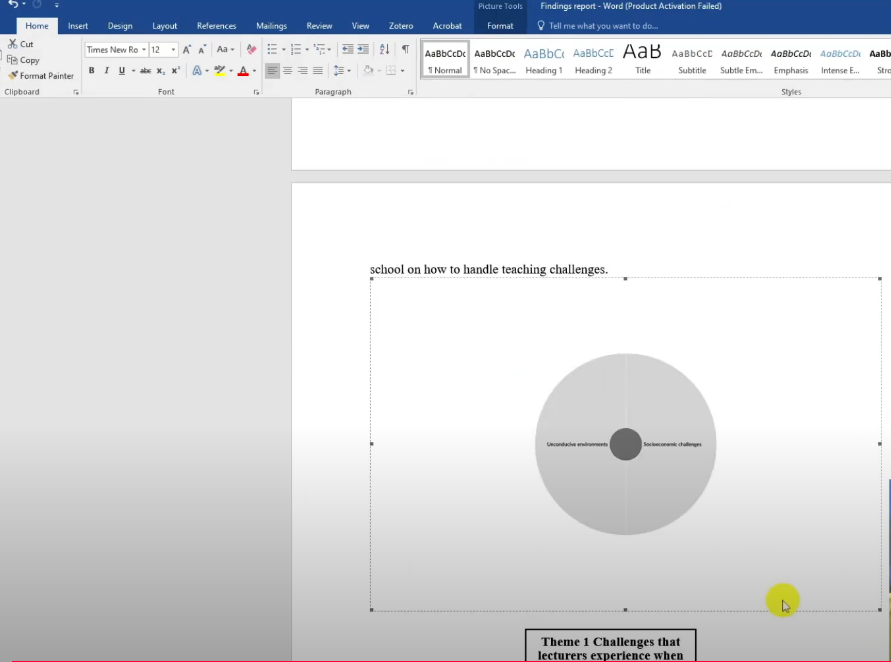
- Right-click → Export Hierarchy Chart
- Save the image and insert it into your Word document under the relevant theme
For more detail on NVivo’s visualization features, see the NVivo official documentation.
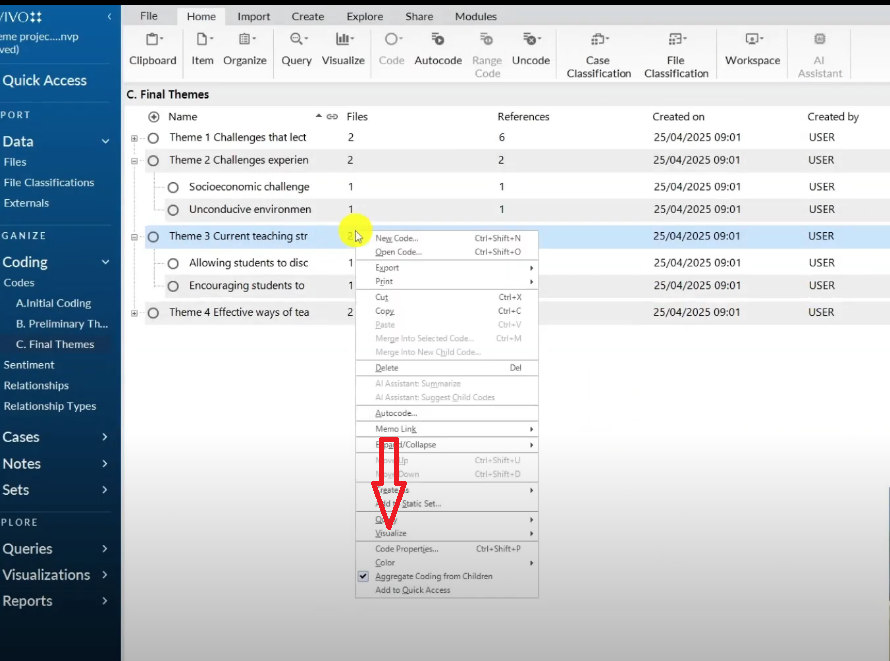
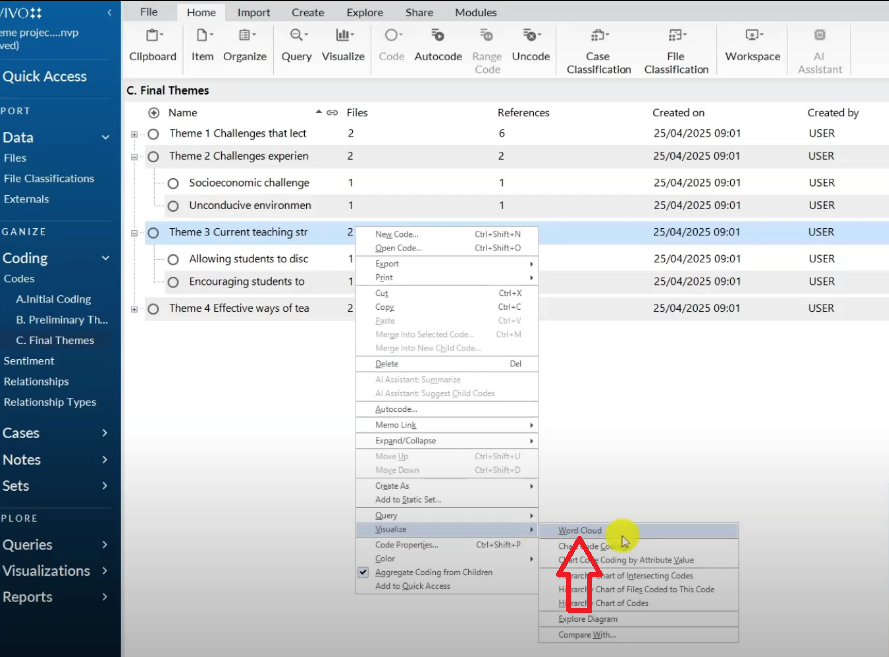
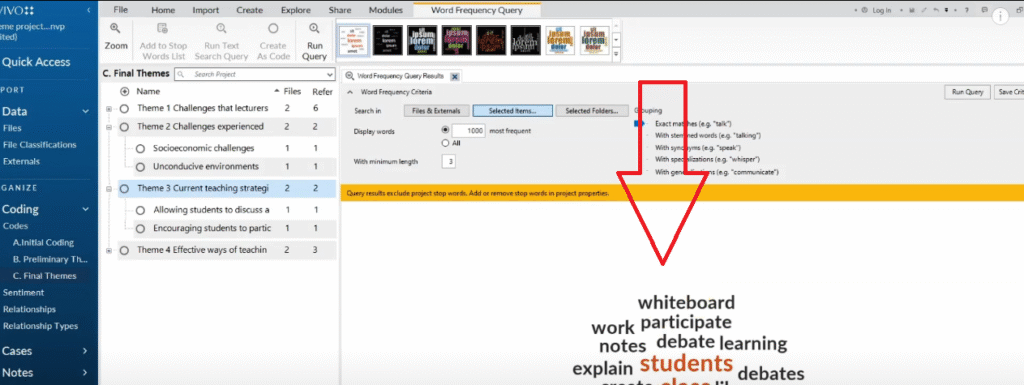
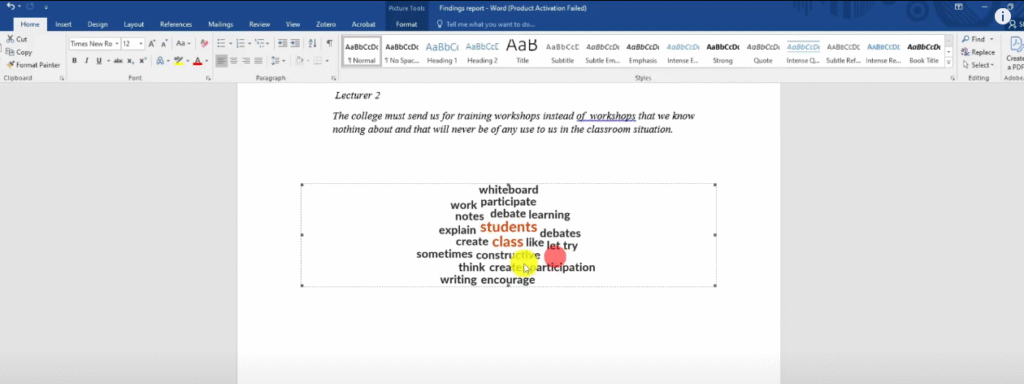
Word Clouds from NVivo 15
A word cloud shows the most frequently occurring words within a theme’s coded data. To create one:
- In NVivo, select the theme folder
- Go to Visualize → Word Cloud
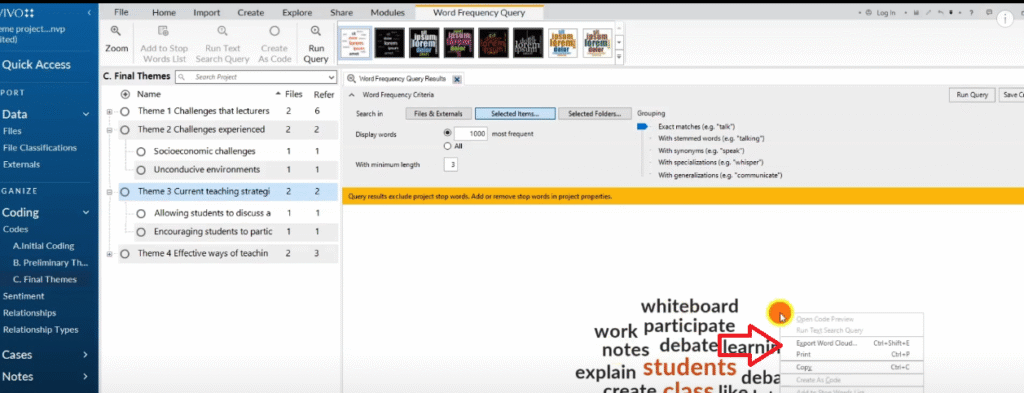
- Right-click → Export
- Insert the saved image into your Word document
Word clouds work best as a supplementary visual for themes with rich, descriptive participant language.


Frequently Asked Questions
What is the difference between the data analysis process section and the results section?
The data analysis process section explains how you analyzed your data — the steps you followed, the tools you used, and the decisions you made. The results section presents what you found — your themes, codes, and participant quotes. Most dissertations include both, though some universities ask you to move the data analysis process into Chapter 3 (methodology).
How many visuals should I include in a thematic analysis findings report?
There is no fixed rule, but I recommend at least one visual per theme. A hierarchy chart or SmartArt diagram works well as an opening visual, followed by a sunburst or word cloud if the theme has a rich coding structure.
Can I include bar charts or pie charts in a qualitative findings report?
Bar charts and pie charts are generally not recommended for qualitative analysis because they imply statistical frequency — which is not the goal of thematic analysis. However, if your university guidelines allow it and you want to show relative theme prominence, a simple bar chart of reference counts per theme can be acceptable.
Do I need to cite Braun and Clarke every time I mention the six-step framework?
You should cite Braun and Clarke (2006) the first time you introduce the framework in your report. After that, you can refer to ‘the Braun and Clarke framework’ or ‘the six-step framework’ without repeating the full citation each time.
Key Takeaways
- A thematic analysis findings report has two sections: the data analysis process and the results
- Use NVivo’s Export List feature to build supporting tables for each stage of your analysis
- Structure each theme with an introduction, a code overview, and participant quotes in italics
- Add at least one visual per theme — hierarchy charts, sunburst charts, or word clouds
- Always cite Braun and Clarke (2006) when first introducing your analytical framework
Need Help Writing Your Findings Report?
If you’re working through reflexive thematic analysis for your dissertation and need expert support, I offer a done-for-you NVivo thematic analysis service that takes your transcripts and delivers a complete, academically sound findings report. You can also book a consulting session if you’d prefer to work through the analysis together. Reach out at bernardmugo@survivingresearch.com — I’m happy to help.