Last Updated on 1 month ago by Grace Nyambura
Thematic Analysis in Microsoft Word and Excel [Free Guide]
No NVivo licence? No problem. It is possible to conduct thematic analysis using only Microsoft Word and Excel — two programs you almost certainly already have. In this guide, I’ll walk you through all eight steps of the process, using a real interview transcript as the worked example throughout.
That said, I’ll also be honest about the limitations. If you have more than five or six participants, or access to a qualitative data analysis tool, I’d strongly recommend using it. I’ll point you to the right resources at the end. But if you’re working with a small dataset and need a free approach right now, this guide gives you everything you need.
The steps follow Braun and Clarke’s six-phase thematic analysis framework — the most widely used approach to thematic analysis in qualitative research — adapted for a Word-and-Excel workflow.
- Thematic Analysis in Microsoft Word and Excel [Free Guide]
- Can You Really Do Thematic Analysis Without Software?
- What You Need Before You Start
- Step 1 – Familiarise Yourself With the Transcripts
- Step 2 – Assign Colour Codes to Interview Questions
- Step 3 – Hand-Code Using Word's Comment Function
- Step 4 – Move Codes and Quotes Into Excel
- Step 5 – Evaluate Questions and Form Preliminary Themes
- Step 6 – Add Descriptions to Your Themes
- Step 7 – Revise and Finalise Your Themes
- Step 8 – Write the Findings Report
- Limitations of Using Word and Excel for Thematic Analysisg
- Frequently Asked Questions
- Key Takeaways
- Ready to Try a More Powerful Tool?
Can You Really Do Thematic Analysis Without Software?
Yes — but with important caveats. Microsoft Word and Excel can handle the core tasks of thematic analysis: familiarising yourself with the data, generating initial codes, grouping codes into themes, and writing up your findings.
However, they struggle with several things that dedicated software handles automatically:
- Tracking codes with shared meaning across multiple transcripts
- Combining codes that belong together
- Identifying the most prominent codes at a glance
- Grouping codes into themes visually
- Visualising the data — charts, word clouds, matrices
For a small study (2–5 participants, shorter interviews), Word and Excel are workable. For anything larger, I’d recommend thematic analysis in NVivo 15 instead.
What You Need Before You Start
- Your interview transcripts as Word (.docx) files
- Microsoft Word (any version with the Comments function)
- Microsoft Excel
- A clear research question your coding will be guided by
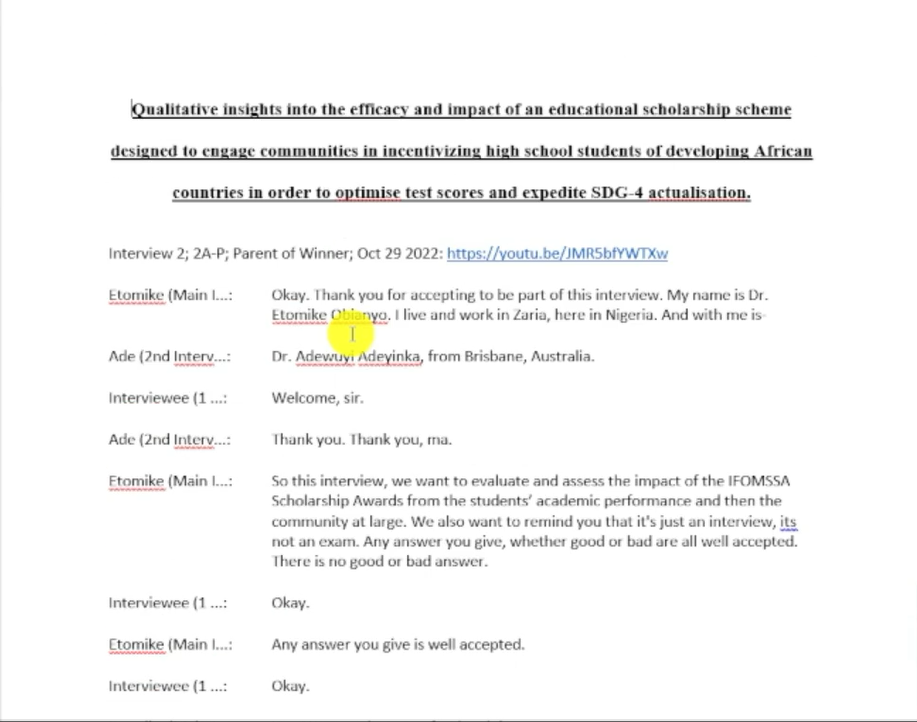
For this guide, I’m using a publicly available transcript from Figshare — a data-sharing platform where researchers share transcripts for practice. The topic is a study on the IFOMSSA educational scholarship scheme in West Africa.
Step 1 – Familiarise Yourself With the Transcripts

Before you touch a highlighter or open a comment, read every transcript in full. Read it the way you’d read a story — not looking for anything specific yet, just absorbing what participants said, how they said it, and what feels significant.
This is Step 1 of Braun and Clarke’s framework and it is non-negotiable. Analysts who skip this step end up with shallow codes because they’re reacting to surface-level statements rather than understanding the data as a whole.
As you read, jot down any initial impressions, surprising statements, or recurring ideas in a separate notes document. These early observations often become your most important codes later.
Step 2 – Assign Colour Codes to Interview Questions

Open your first transcript in Word. Go through it and identify each interview question. Highlight each question in a distinct colour — one colour per question.
For example:
- Maroon — How did you participate in the scholarship programme?
- Red — What do you know generally about the award?
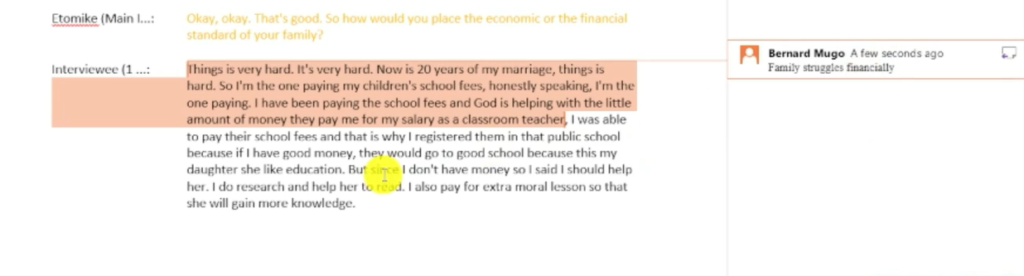
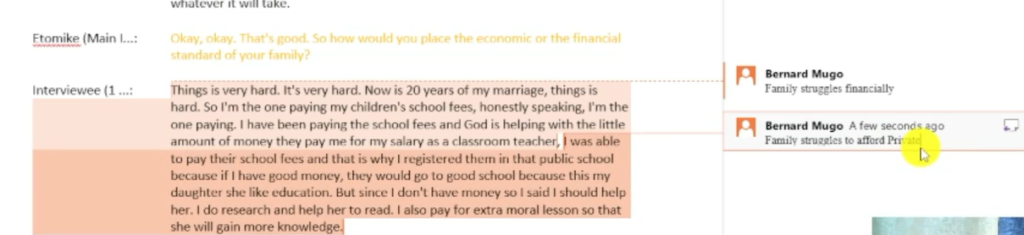
- Yellow — How would you describe your family’s financial situation?
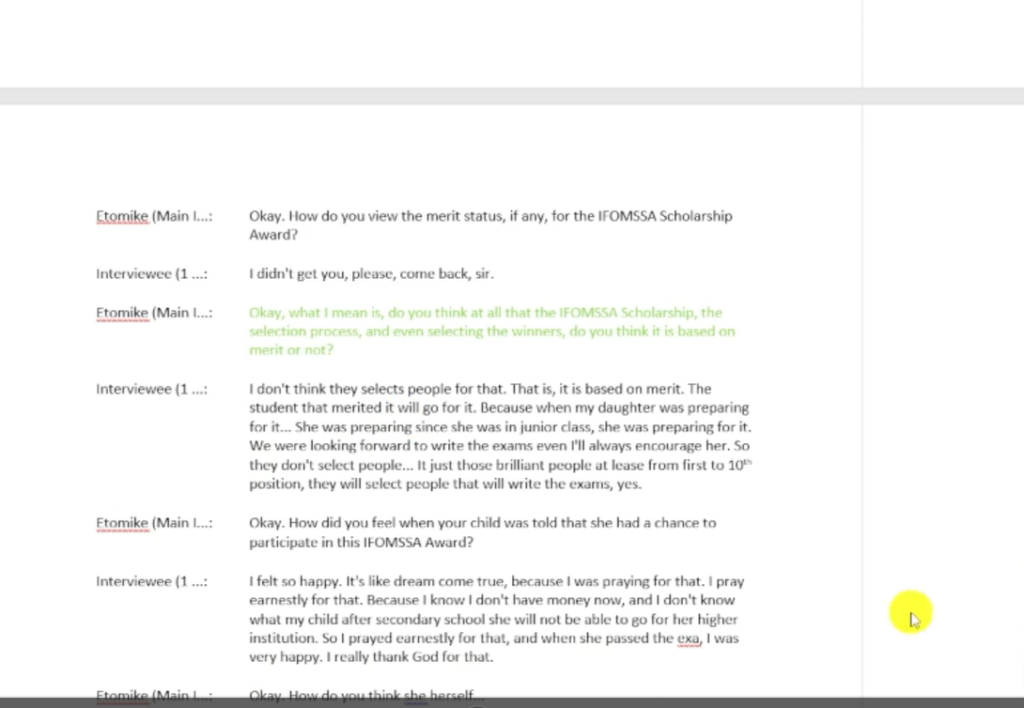
- Light green — Do you think the selection process is merit-based?
- Blue — How did you feel when your child was selected?
Step 3 – Hand-Code Using Word’s Comment Function

This is the core qualitative coding step. For each participant response, read it carefully and assign a code — a short label that captures what the response is saying in relation to your research question.
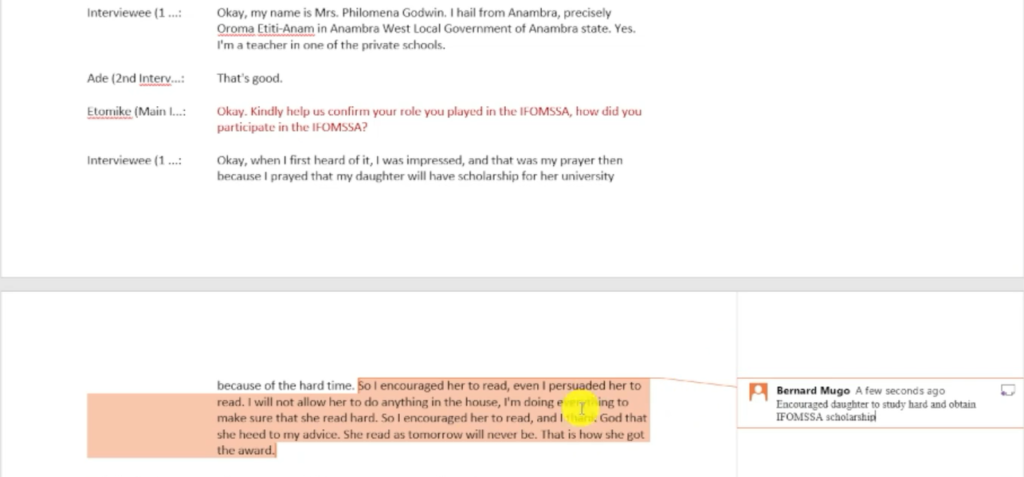
In Word, highlight the relevant passage, right-click, and select New Comment. Type your code directly into the comment box.
Using the IFOMSSA transcript as an example:
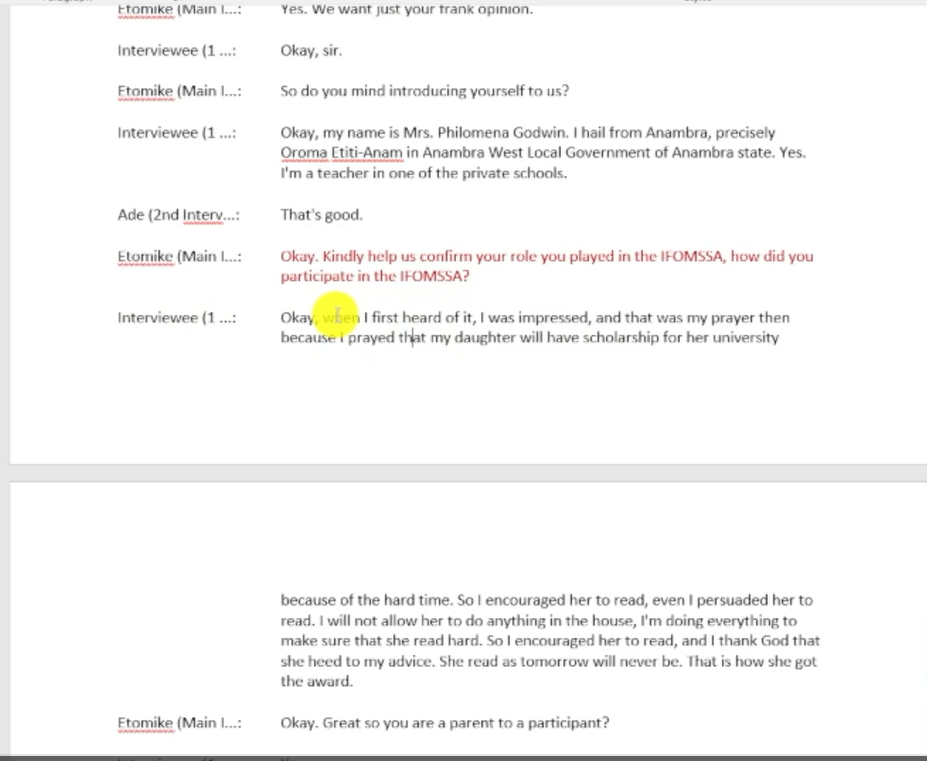
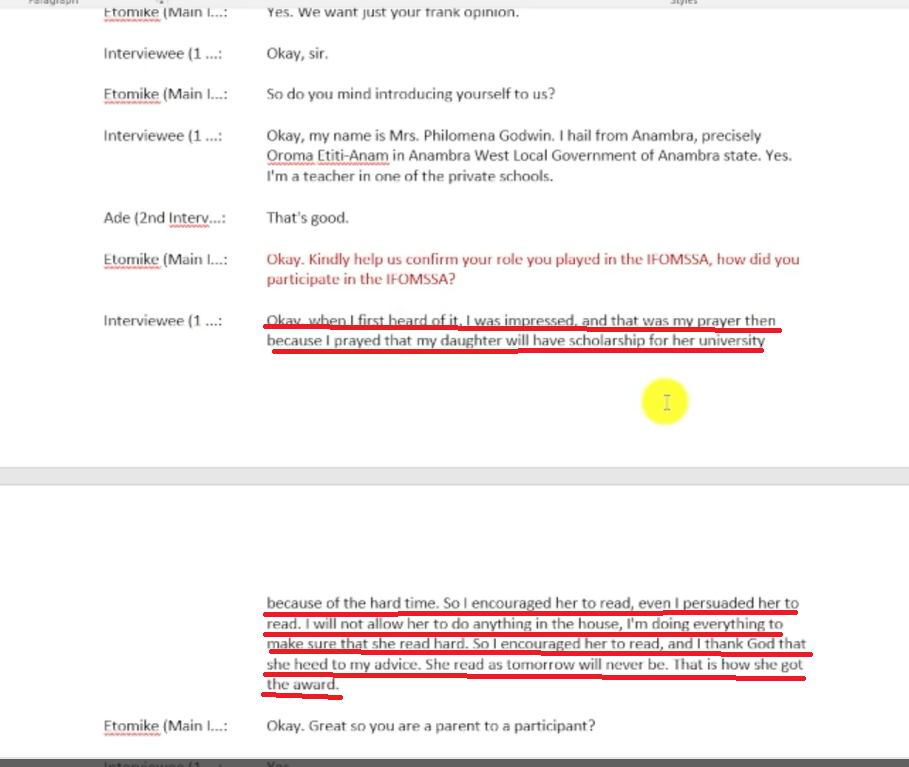
“I was impressed. That was my prayer then, because I prayed that my daughter will have a scholarship for her university… So I encouraged her to read.”
Code assigned: Encouraged daughter to study hard to obtain scholarship
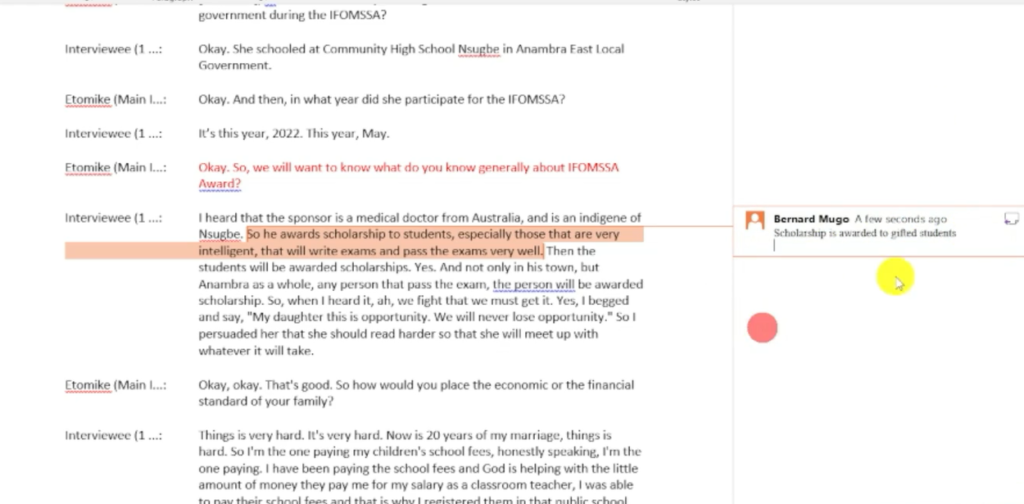
“He awards scholarships to students, especially those that are very intelligent, that will write exams and pass exams very well.”
Code assigned: Scholarship awarded to academically gifted students
A code is a label or interpretive statement for specific information that is important to your research question or objective. Don’t over-think each code at this stage — you’ll refine them later. The goal here is to get all the data labelled, not to have perfect codes.
For a deeper look at how qualitative coding works in a more powerful environment, see my guide on qualitative coding in NVivo.

Step 4 – Move Codes and Quotes Into Excel

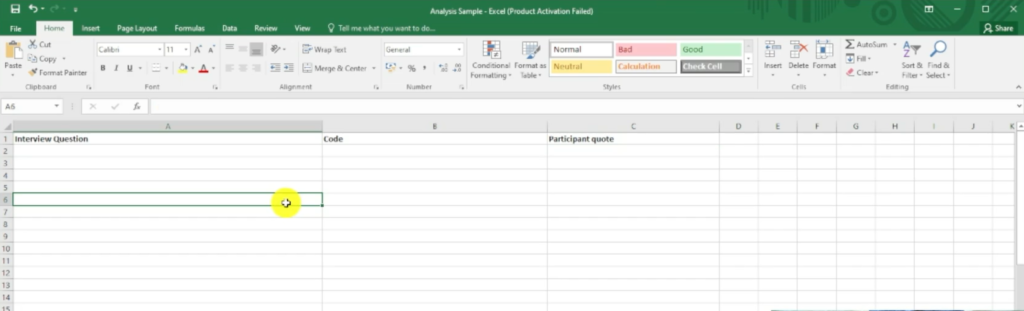
Once you’ve coded all your transcripts in Word, open a new Excel sheet and create three columns:
- Interview Question
- Code
- Participant Quote
Go through your Word document question by question. For each coded passage, copy the question into Column A, the code into Column B, and the relevant participant quote into Column C.
This step is time-consuming — and that’s intentional. Manually transferring everything from Word to Excel forces you to re-engage with every piece of data, which deepens your understanding before you start building themes.
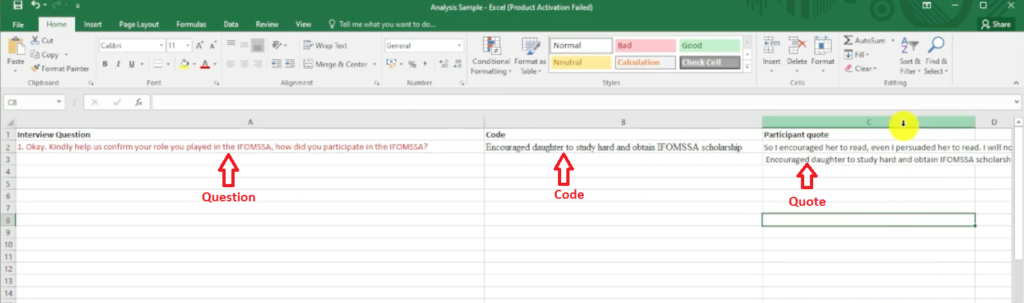
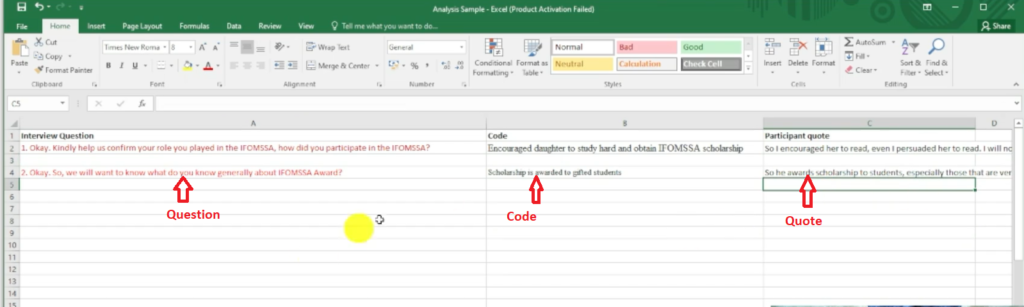
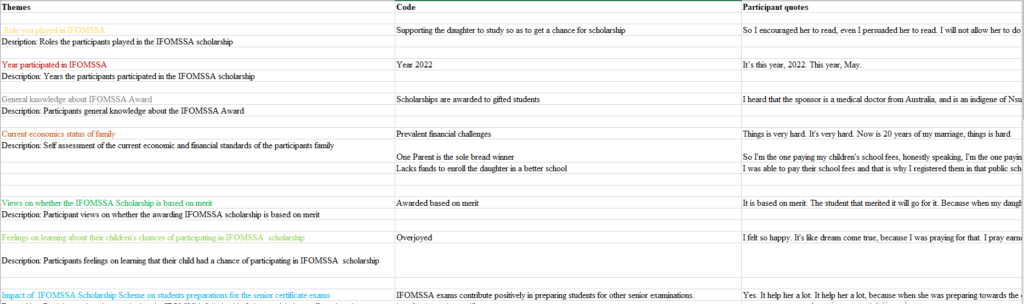
Once all participants are captured, your Excel sheet should show every interview question, every code assigned to it, and the supporting participant quote — all in one place, ready to compare across the dataset.
Step 5 – Evaluate Questions and Form Preliminary Themes

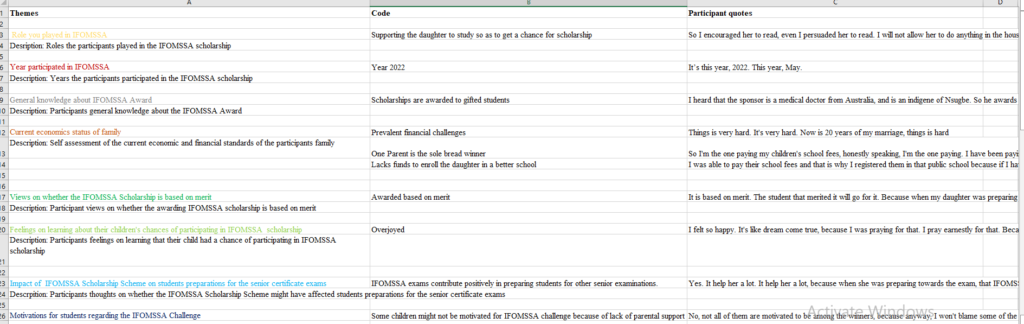
Now open a second Excel sheet. Copy your interview questions, codes, and quotes from Sheet 1 into Sheet 2.
Work through each interview question and ask: what is the underlying topic this question was exploring? Rewrite the question as a theme name that captures that topic.
Examples from the IFOMSSA study:
- “Kindly confirm the role you played in IFOMSSA” → Preliminary Theme: Role Played in IFOMSSA
- “What do you know generally about the IFOMSSA award?” → Preliminary Theme: General Knowledge About the Award
- “How would you place the economic standard of your family?” → Preliminary Theme: Socioeconomic Status of Participants’ Families
These are preliminary themes — rough working titles. Don’t expect them to be perfect yet. Their purpose is to give you a structured starting point for the revision step that follows.
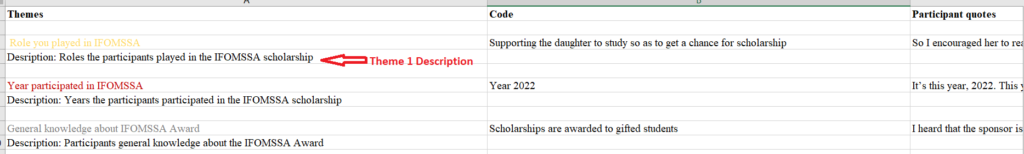
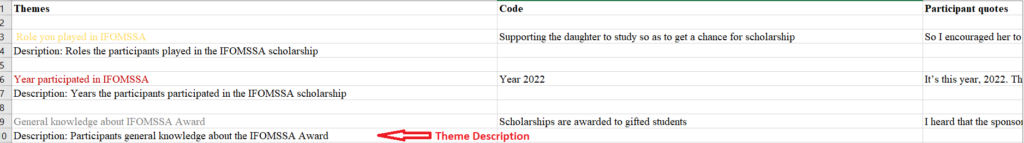
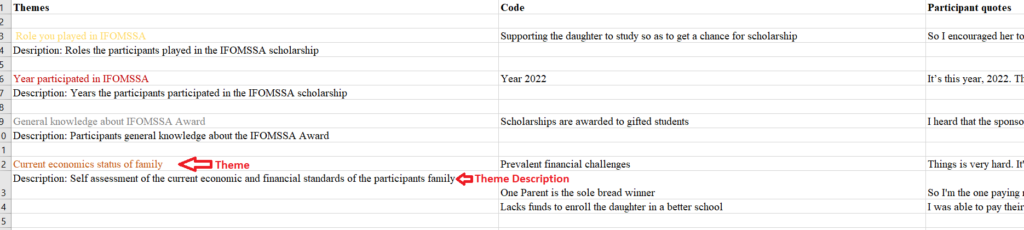
Step 6 – Add Descriptions to Your Themes

Below each preliminary theme in Sheet 2, add a short description — one or two sentences that explain what the theme is about and what kinds of participant experiences or views it captures.
Example:
- Theme: Role Played in IFOMSSA
- Description: This theme captures the different ways in which participants — primarily parents — supported their children’s participation in the IFOMSSA scholarship process.
Step 7 – Revise and Finalise Your Themes

Review all your preliminary themes together. At this stage, ask:
- Do any themes overlap enough that they should be merged?
- Is any theme so broad it actually contains two separate ideas?
- Does every theme have enough supporting codes and quotes from multiple participants?
- Does each theme name stand on its own — would it make sense to someone who hadn’t read your data?
Revise names and descriptions until your final themes feel distinct, well-supported, and meaningful. These are what you’ll write up in your findings chapter.
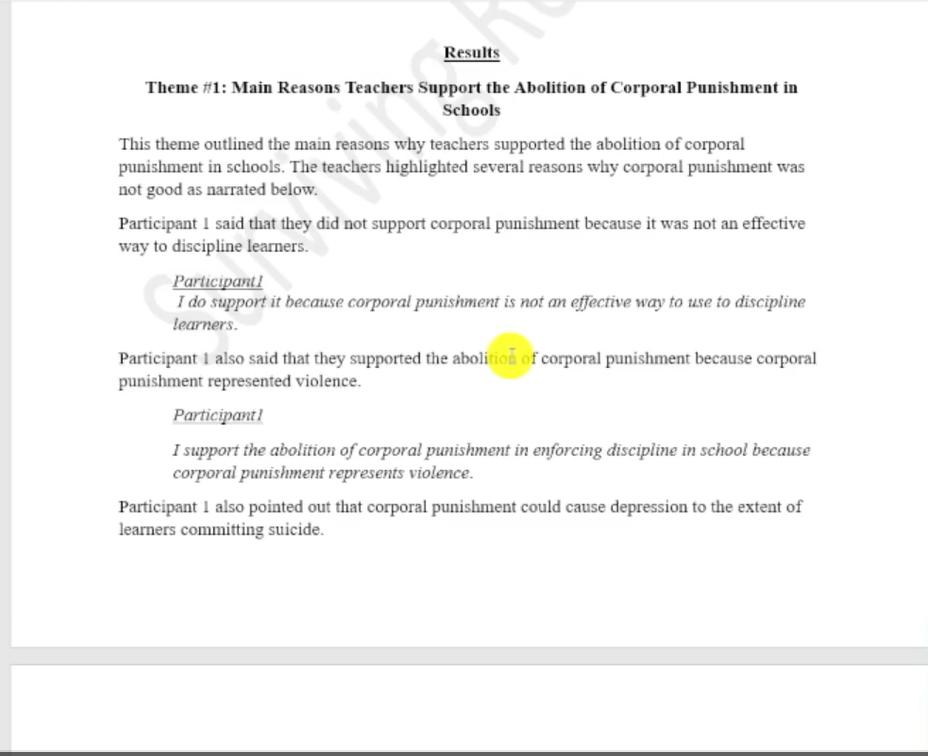
Step 8 – Write the Findings Report

With your final themes, descriptions, codes, and participant quotes all in Excel, you have everything you need to write Chapter 4.
For each theme, follow this structure:
- Introduce the theme. State the theme name and write 2–3 sentences from your description explaining what it covers.
- Describe the pattern. Explain what participants generally said in relation to this theme — the shared experience or view.
- Support with quotes. Embed 2–3 direct participant quotes that illustrate the theme. Use the quotes you captured in Excel.
- Interpret the finding. Connect the theme to your research question — what does this theme tell you?
For a detailed walkthrough of how to structure and write a thematic analysis findings report, see my post on how to report thematic analysis findings in NVivo — the writing principles are identical regardless of which tool you used for the analysis.
Limitations of Using Word and Excel for Thematic Analysisg
I always show researchers this method when they ask for it — but I’m equally direct about where it breaks down:
- It does not scale. Five participants is manageable. Ten or more and your Excel sheet becomes unwieldy and error-prone.
- You cannot easily combine codes. In NVivo or MAXQDA, you can drag and merge codes with shared meaning. In Excel, you have to do this manually and it’s easy to miss connections.
- Themes tend to follow the interview questions. Because you’re colour-coding by question, your themes can end up mapping one-to-one onto the questions — which produces weak, descriptive themes rather than analytical ones.
- No audit trail. Qualitative software logs every coding decision. Word comments can be accidentally deleted and Excel rows can be overwritten without any record.
If any of these limitations apply to your study, the better path is dedicated software. My guide on inductive thematic analysis in NVivo shows you the same eight-step process in an environment built for it — and NVivo’s free trial gives you enough time to work through a small dataset.
Alternatively, if you need the analysis done and don’t have time to learn the software, my done-for-you qualitative analysis service is available for PhD students with tight deadlines.
Frequently Asked Questions
How many participants can I analyse using Word and Excel?
This method is practical for up to five or six participants. Beyond that, the volume of codes and quotes in Excel becomes very difficult to manage and cross-reference reliably.
Can I use Google Docs and Google Sheets instead?
Yes — the comment function in Google Docs works the same way as in Microsoft Word, and Google Sheets can replace Excel. The process is identical.
Do I have to follow Braun and Clarke’s framework?
No, but it’s the most widely used and accepted framework for thematic analysis in social science and health research. If your institution or supervisor has specified a different framework, follow that instead. The Word and Excel method can be adapted to most thematic approaches.
Can I use this method for focus group data?
Yes — the process is the same. The main difference is that you’ll have multiple speakers per transcript. Make sure your transcripts clearly label each speaker so you can attribute quotes accurately.
What if I have more than one researcher coding?
Inter-rater reliability is much harder to manage in Word and Excel than in dedicated software. If your study requires multiple coders, I’d strongly recommend using NVivo or MAXQDA, which have built-in inter-rater tools.
Key Takeaways
- Thematic analysis in Microsoft Word and Excel is possible — but best suited to small datasets of 5 or fewer participants
- Colour-code your questions in Word to stay organised across the transcript
- Use the Comment function to generate initial codes without leaving your transcript
- Transfer everything to Excel — question, code, and participant quote — before building themes
- Revise preliminary themes until each one is distinct, meaningful, and well-supported by quotes
- For larger studies or better analytical rigour, use dedicated software — thematic analysis in NVivo 15 is the natural next step
Ready to Try a More Powerful Tool?
If you’re working to a deadline and need the analysis done for you, my done-for-you qualitative analysis service is available for PhD students. Send me your transcripts and research questions — I handle the coding, themes, and a structured findings report you can write up immediately.
