
Last Updated on 3 months ago by Bernard Mugo
How to Report NVivo Findings: A Step-by-Step Guide
A strong qualitative findings report turns hours of NVivo coding into a document your reader can actually use. If you’ve finished your thematic analysis and you’re staring at a project full of themes, subthemes, and coded references wondering what comes next, this guide breaks the process into four steps: describing your analysis process, discussing your themes, backing them up with participant quotes, and presenting visuals. By the end, you’ll know exactly what to pull out of NVivo and how to structure it.
- How to Report NVivo Findings: A Step-by-Step Guide
- What Is a Qualitative Findings Report?
- Step 1: Describe Your Data Analysis Process
- Step 2: Discuss Your Themes and Subthemes
- Step 3: Support Your Themes with Participant Quotes
- Step 4: Add Visuals — Hierarchy Charts and Mind Maps
- Common Mistakes to Avoid When Reporting NVivo Findings
- Frequently Asked Questions
- Key Takeaways
- Get Hands-On Help with Your NVivo Findings Report
What Is a Qualitative Findings Report?
A qualitative findings report is the section of your dissertation, thesis, or journal article where you present what your data analysis actually revealed. It has two main parts: a description of your data analysis process, and a discussion of the themes and subthemes that emerged from it, supported by direct participant quotes and, where useful, visuals like hierarchy charts and mind maps.
Most dissertations and journal articles present this findings report as its own dedicated chapter or section, separate from the discussion that follows it. Readers, and examiners, expect it to move logically from process to theme to evidence, so getting the structure right matters as much as the content itself.
Step 1: Describe Your Data Analysis Process
The first section of your findings report should explain, in plain terms, the steps you took to move from raw transcripts to final themes. If you used an inductive approach, this usually means walking through the six-step thematic analysis framework popularized by
Braun and Clarke’s 2006 thematic analysis framework, which remains the most widely cited approach to thematic analysis in qualitative research:
- Familiarizing yourself with the data (reading and re-reading transcripts)
- Generating initial codes from the data
- Searching for themes among the codes
- Reviewing the themes against the coded extracts and full dataset
- Defining and naming each theme
- Producing the report
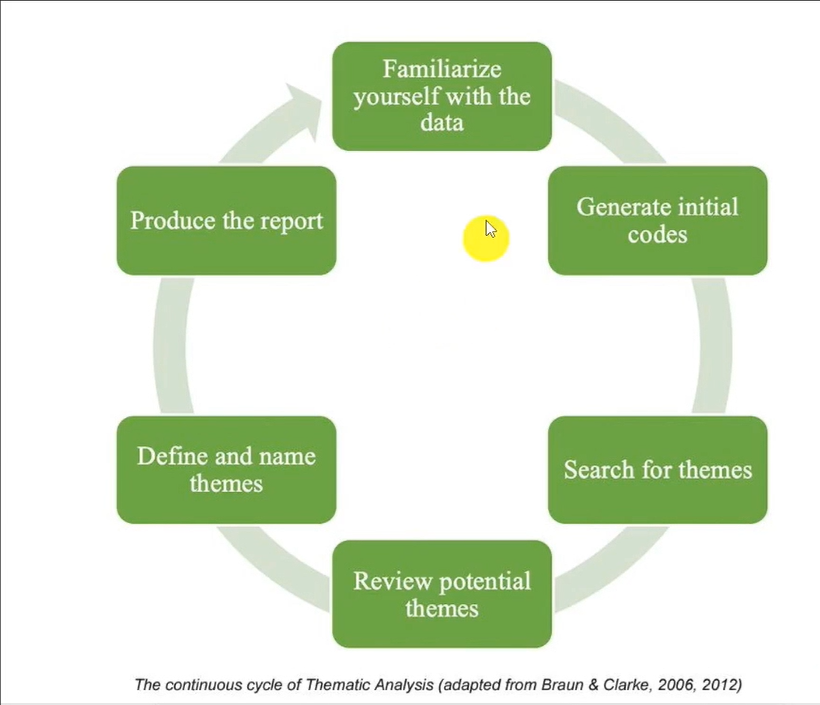
The Braun and Clarke Six Step Framework
Exporting Your Code List in NVivo
Once your themes are finalized in NVivo, export a clean list of them for your report:
7.Select all your coded themes (Ctrl+A on your themes/nodes)
8.Go to Export > Export List
9.Save the list — this gives you a clean export of your final themes with reference counts
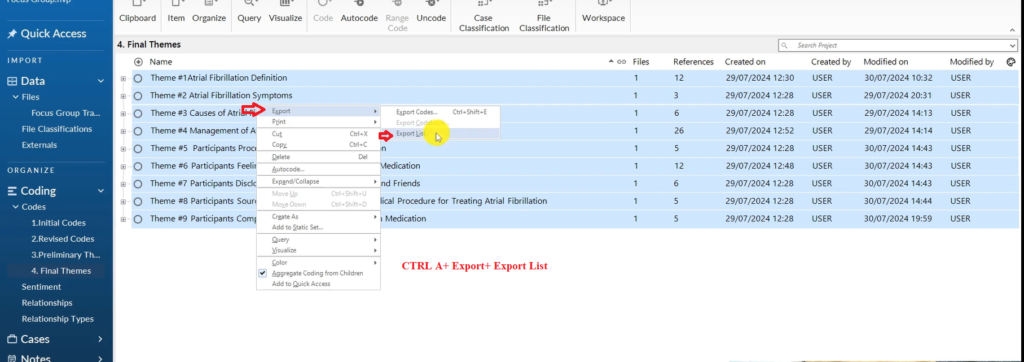
The Process of Exporting the Code List in Nvivo
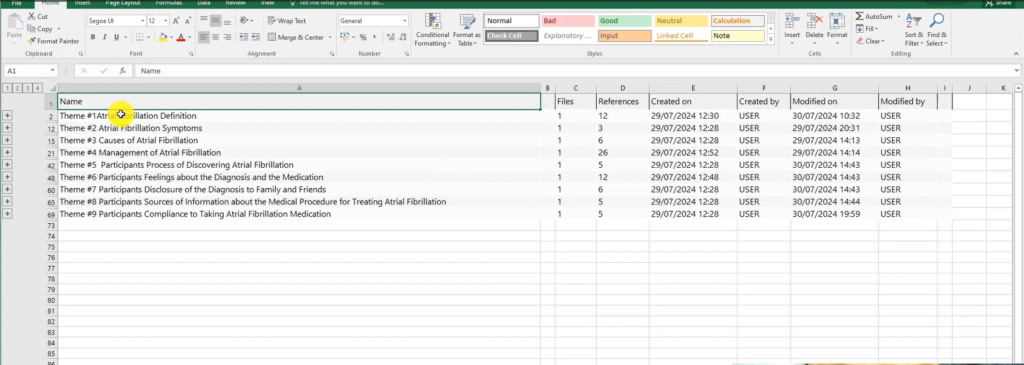
The List of Final Themes
Exporting a Codebook in NVivo
Next, export a full codebook, which documents each theme, subtheme, and their definitions:
- From your complete NVivo project, go to Share > Export > Export Codebook
- Choose your preferred format (Word or Excel work well for reports)
- Review the exported codebook for accuracy before pasting excerpts into your report
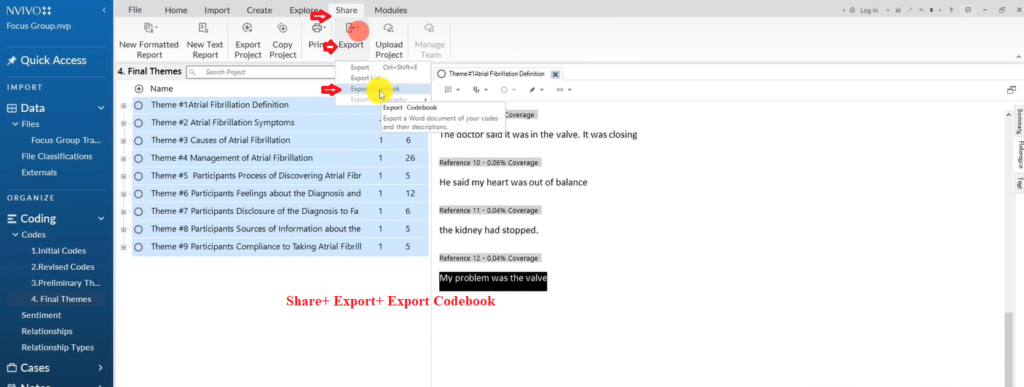
The Process of Exporting the Codebook

A Codebook
Step 2: Discuss Your Themes and Subthemes
After describing your process, move into discussing what you actually found. For each theme, explain what it means and how it relates to your research question, then introduce its subthemes the same way.
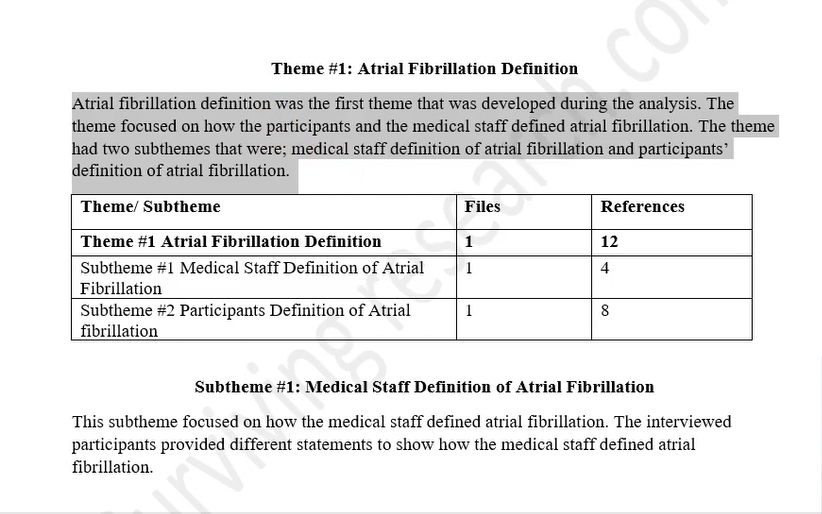
A Discussion of a Theme
Keep each theme section self-contained — a reader (or an AI summarization tool) should be able to understand the theme from that section alone, without needing the rest of the chapter.
Step 3: Support Your Themes with Participant Quotes
After explaining each theme and its codes, back them up with the participants’ own words. These direct quotes are your evidence, and they’re usually formatted in italics and clearly attributed to a participant or pseudonym.
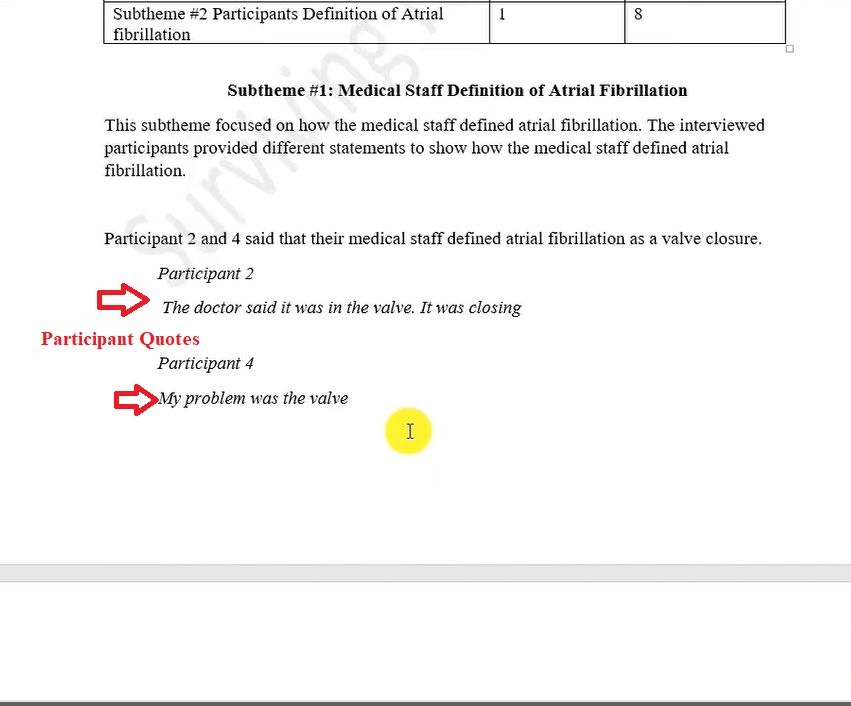
Participant Quotes
Step 4: Add Visuals — Hierarchy Charts and Mind Maps
Visuals make your findings report easier to follow, especially in a long results chapter. Two NVivo visuals work particularly well:
Mind maps: show how a theme connects to its subthemes and related codes visually.
Hierarchy charts: show the relative size (by number of references) of themes and codes at a glance.
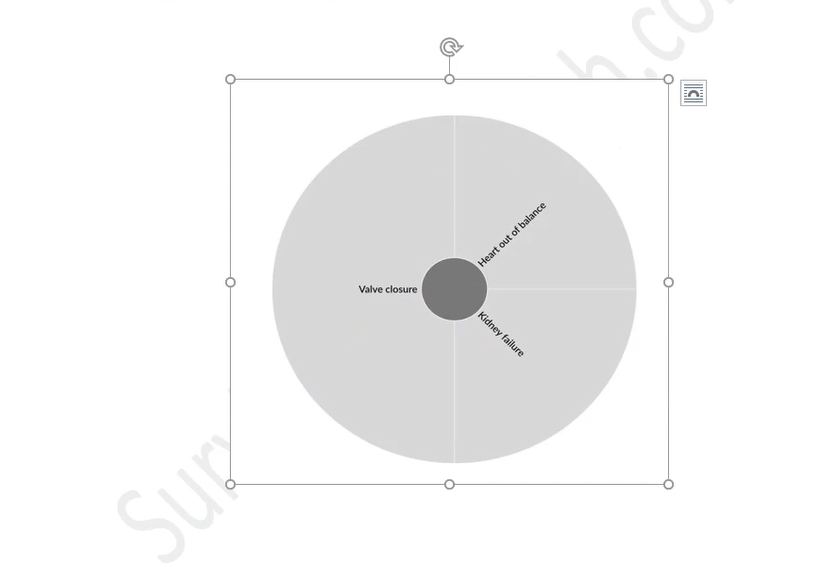
Hierarchy chart showing NVivo-coded symptoms
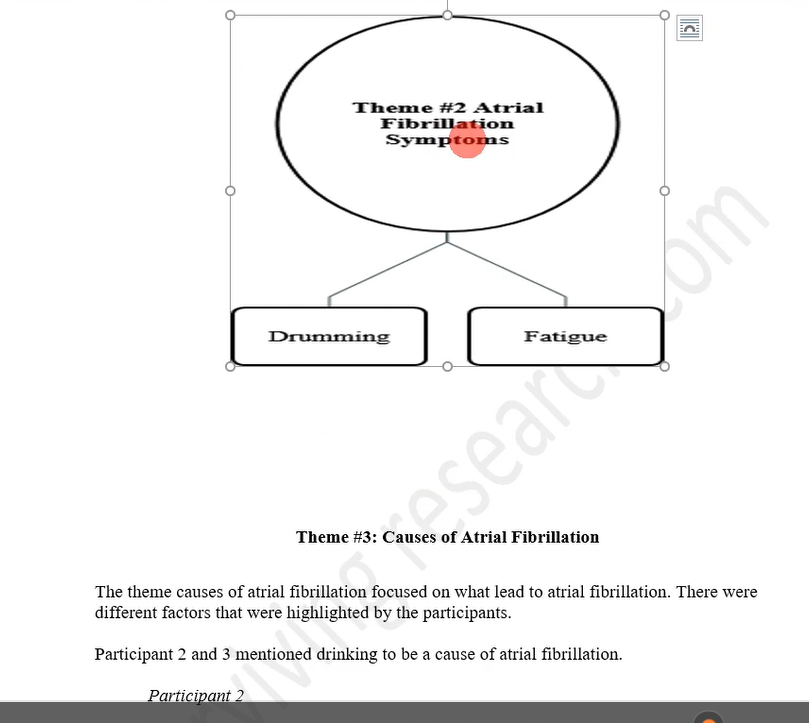
Mind map illustrating a theme with subthemes
To see nine different ways to build these visuals, watch 9 Ways to Visualize in NVivo — it covers hierarchy charts, mind maps, and several other options directly inside NVivo.
Common Mistakes to Avoid When Reporting NVivo Findings
A few recurring mistakes tend to weaken otherwise solid findings reports. Watch for these as you write:
- Describing NVivo instead of your data: your process section should explain what you did with your data, not how NVivo’s interface works. Save software mechanics for a methods appendix.
- Presenting themes without evidence: a theme name and definition alone isn’t a finding. Every theme needs at least one supporting participant quote.
- Treating the codebook as the report: your exported codebook is a working document, not a substitute for narrative discussion. Use it as a reference table, not the report itself.
- Overusing visuals: hierarchy charts and mind maps should illustrate a point you’ve already made in text, not replace the explanation entirely.
- Inconsistent terminology: if you call something a “theme” in one section, don’t relabel it a “category” later. Keep your terms consistent with your methodology chapter.
Frequently Asked Questions
How long should a qualitative findings report be?
There’s no fixed word count, but most dissertation findings chapters run 3,000–8,000 words depending on the number of themes and how much quote evidence you include. Focus on depth per theme rather than hitting a target length.
Should I write my findings report in first person?
Most qualitative methodologies, including thematic analysis, accept and even encourage first-person voice (“I identified three subthemes…”) since the researcher is understood to be actively interpreting the data. Check your institution’s style guide to confirm.
What’s the difference between the findings chapter and the discussion chapter?
The findings chapter presents what you found — themes, subthemes, and supporting quotes. The discussion chapter interprets those findings against your literature review and research questions, and considers their broader implications.
Do I need to export a codebook from NVivo, or can I build the tables manually?
Exporting is faster and less error-prone than retyping definitions and reference counts by hand. NVivo’s export also keeps your codebook synchronized with your actual coded data, so if you revise a theme late in your analysis, your report tables stay accurate.
Key Takeaways
- Structure your findings report in two parts: your analysis process, then your themes.
- Export your code list and codebook directly from NVivo rather than retyping them.
- Support every theme with direct, italicized participant quotes.
- Use hierarchy charts and mind maps to make dense findings easier to follow.
- Keep each theme section self-contained so it reads clearly on its own.
Get Hands-On Help with Your NVivo Findings Report
If you’re feeling stuck — whether it’s moving from codes to themes, organizing your NVivo project, or writing up your findings — I offer two services designed specifically for PhD students and researchers:
Done-for-You Qualitative Analysis: I handle the full coding and thematic analysis process for you, using NVivo, and deliver a findings report ready for Chapter 4 of your dissertation.
One-on-One NVivo Consulting: We work through your analysis together via Zoom or Microsoft Teams, and I guide you step by step through your specific dataset.