Last Updated on 2 months ago by Grace Nyambura
Reporting thematic analysis findings is the final — and often the most intimidating — step in your qualitative research journey. You have your codes. You have your themes. Now you need to turn all of that into a structured findings chapter your supervisor can read and approve.
In my last two articles in this series, we covered interview coding in MAXQDA and developing themes in MAXQDA. This article brings everything together: how to write up and report your thematic analysis findings using MAXQDA, from exporting your codebook to presenting your final narrative with quotes and visuals.
| Quick Answer: To report thematic analysis findings in MAXQDA, export your code system as a Word codebook, use it to build a data analysis process section, retrieve participant quotes from your MAXQDA project, and present your themes as main headings with supporting narratives and evidence. The steps below walk through this exactly. |
- What Does Reporting Thematic Analysis Findings Mean?
- Step 1 — Review the Braun & Clarke Framework Before You Write
- Step 2 — Export and Fix Your MAXQDA Code System
- Step 3 — Write the Data Analysis Process Section
- Step 4 — Retrieve Quotes Directly from MAXQDA
- Step 5 — Present Your Findings with Themes as Headings
- Step 6 — Add Visuals to Strengthen Your Report
- Frequently Asked Questions
- Key Takeaways
What Does Reporting Thematic Analysis Findings Mean?
Reporting thematic analysis findings means writing a structured chapter — usually your findings or results chapter — that explains what themes emerged from your data, how those themes were developed, and what your participants actually said to support each one.
For most PhD students, this chapter has two main parts:
- The data analysis process — a description of the steps you followed (using Braun and Clarke’s six-step framework in most cases)
- The findings — your themes presented as headings, with descriptions, tables, and direct participant quotes
MAXQDA makes both parts easier because your codes, frequencies, and quotes are all stored in one place and can be exported in different formats. You can read more about MAXQDA’s reporting capabilities at the MAXQDA official documentation.
Step 1 — Review the Braun & Clarke Framework Before You Write
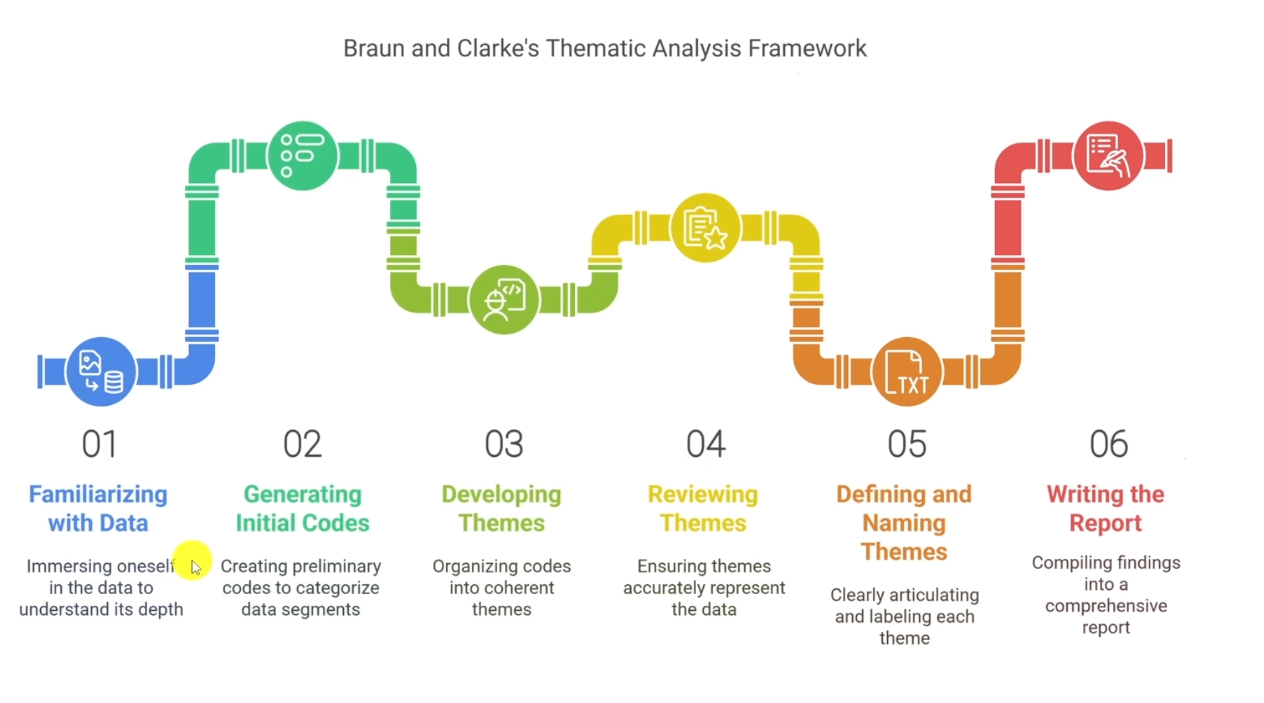
Before you write a single sentence, go back to the Braun and Clarke (2006) six-step thematic analysis framework and confirm you have completed every stage:
- Familiarising yourself with the data
- Generating initial codes
- Searching for themes
- Reviewing themes
- Defining and naming themes
- Writing the report ← you are here
Each of these steps needs to be briefly described in your data analysis process section, along with citations. If you are not yet at step 6, go back and complete the earlier stages first. Trying to write up findings before your themes are properly named is the most common mistake I see PhD students make.
Step 2 — Export and Fix Your MAXQDA Code System
Your first action inside MAXQDA is to export the code system. This becomes your codebook — and every table in your findings report will be drawn from it.
How to Export Your Codebook from MAXQDA
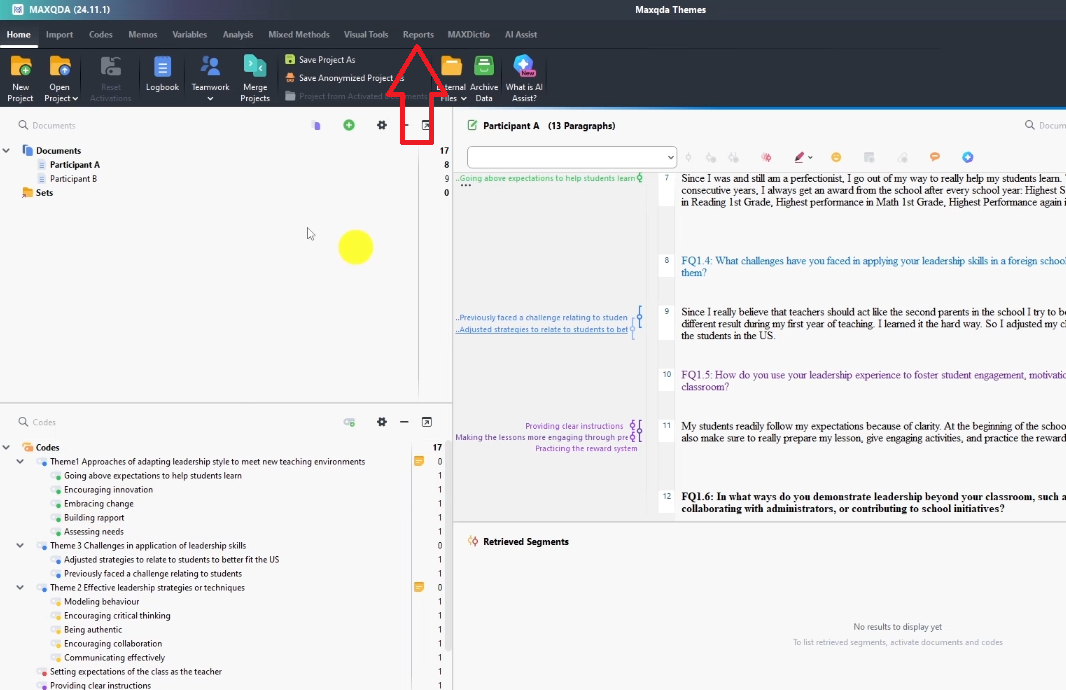
- Open your MAXQDA project file
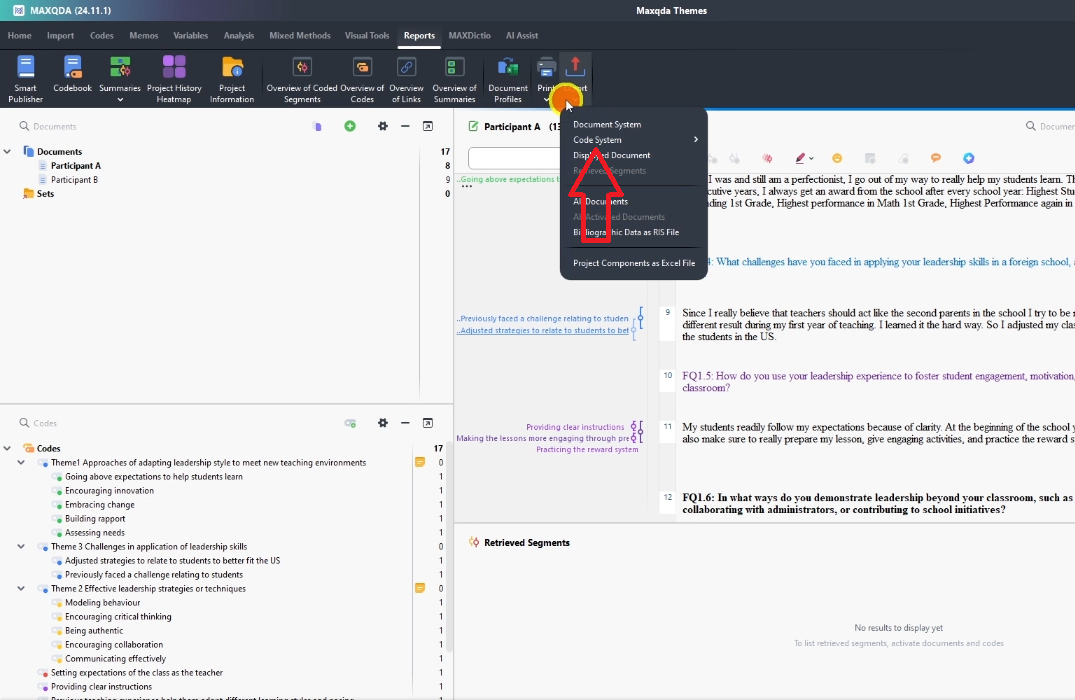
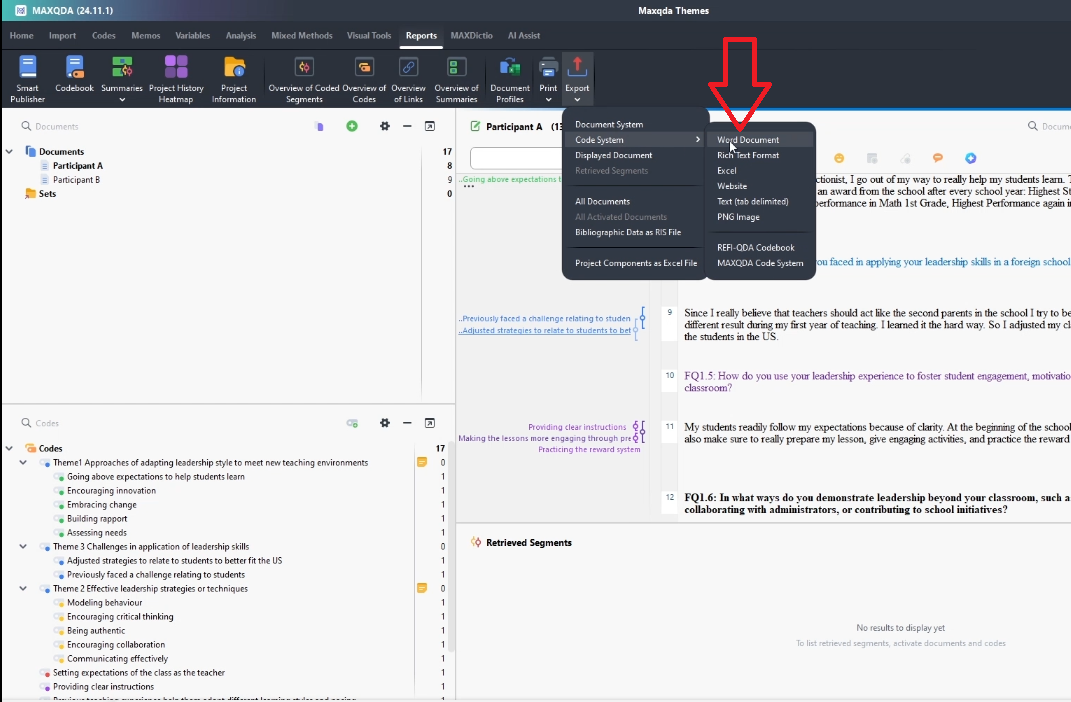
- Click Reports in the top menu
- Select Export Code System
- Choose Word Document as your format
- Check the box to include memos — your descriptions will appear alongside each code
- Click OK
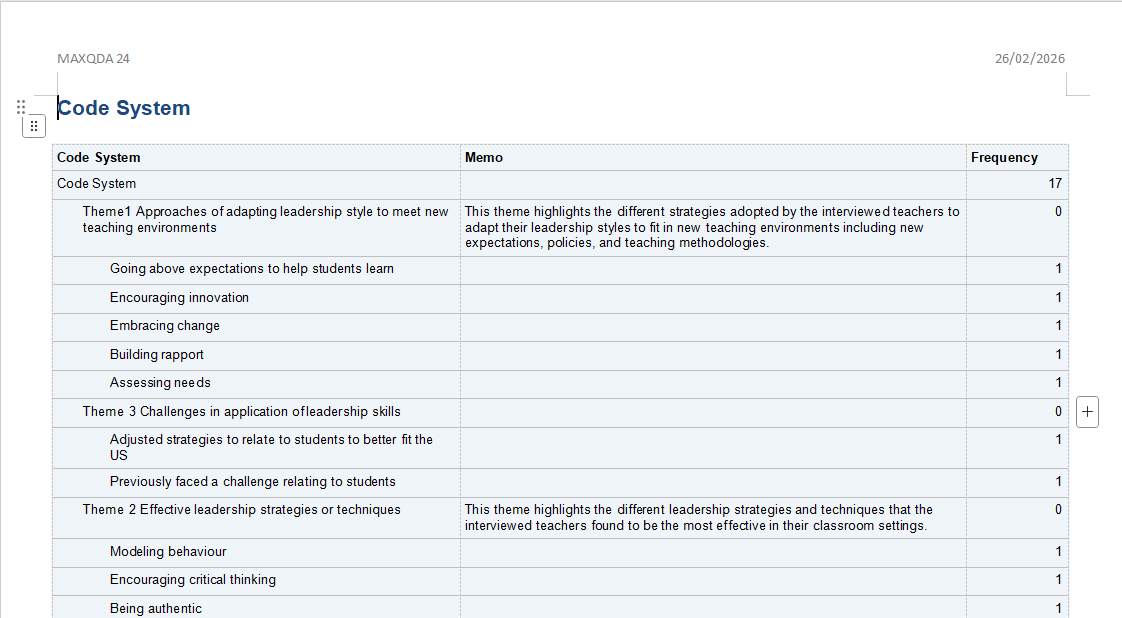
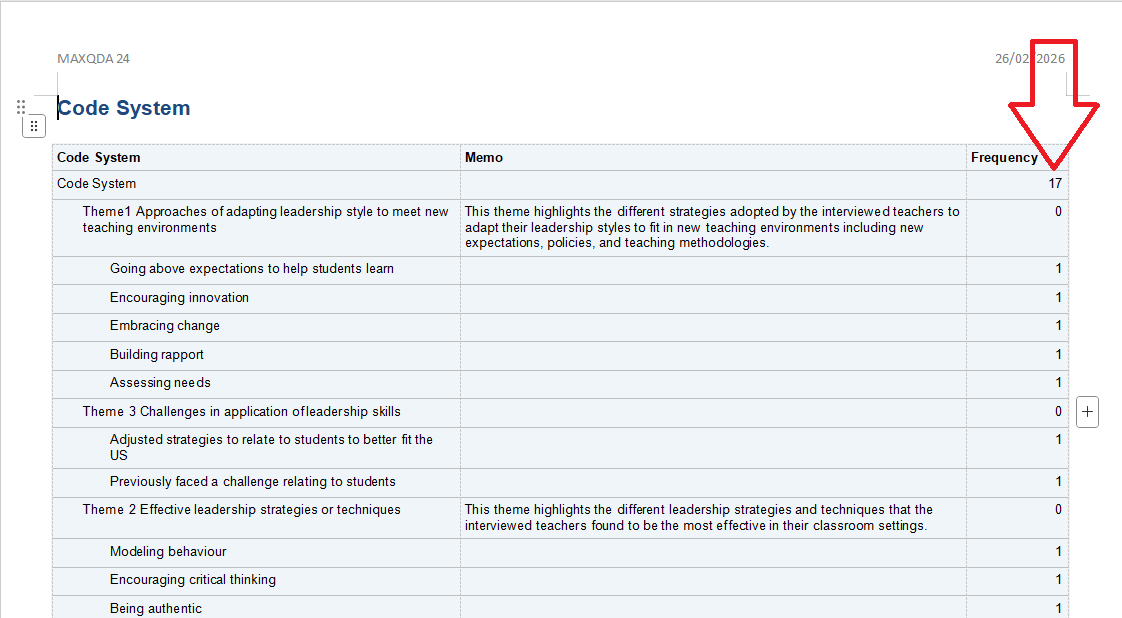
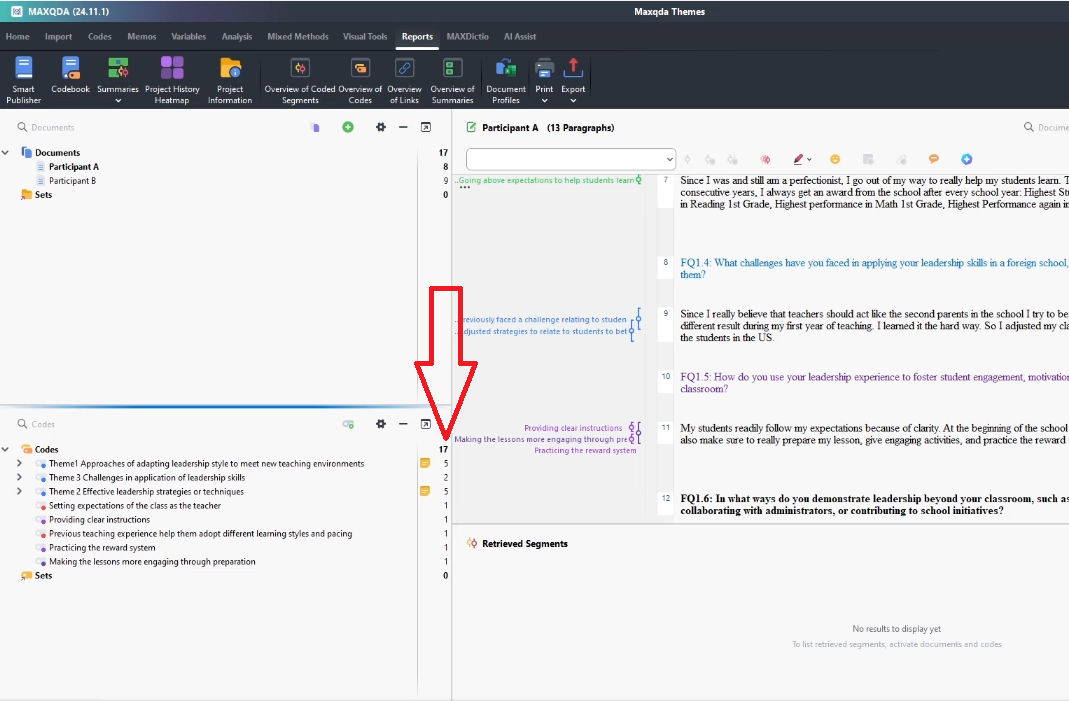
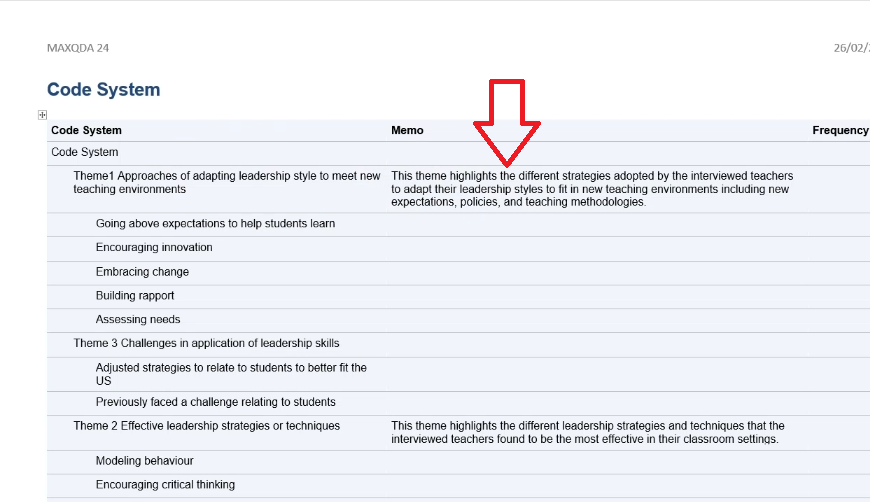
MAXQDA generates a Word document with your full coding structure: themes, codes, descriptions, and frequency numbers. Before using it, fix one thing: the numbers MAXQDA exports are not totals — they are the count of coded segments per code. Confirm this in your project window, then correct any confusion before using these numbers in tables.
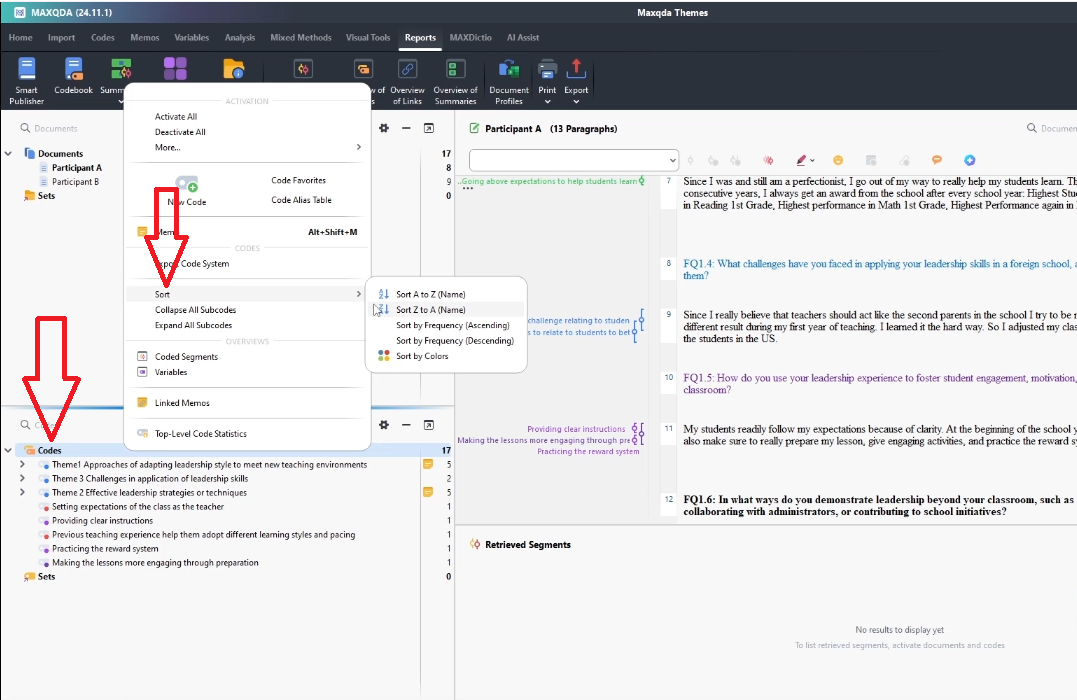
One more step before exporting: go to Codes → Sort A to Z so your themes appear alphabetically in the codebook. This makes your findings chapter easier to navigate for your reader.
Step 3 — Write the Data Analysis Process Section
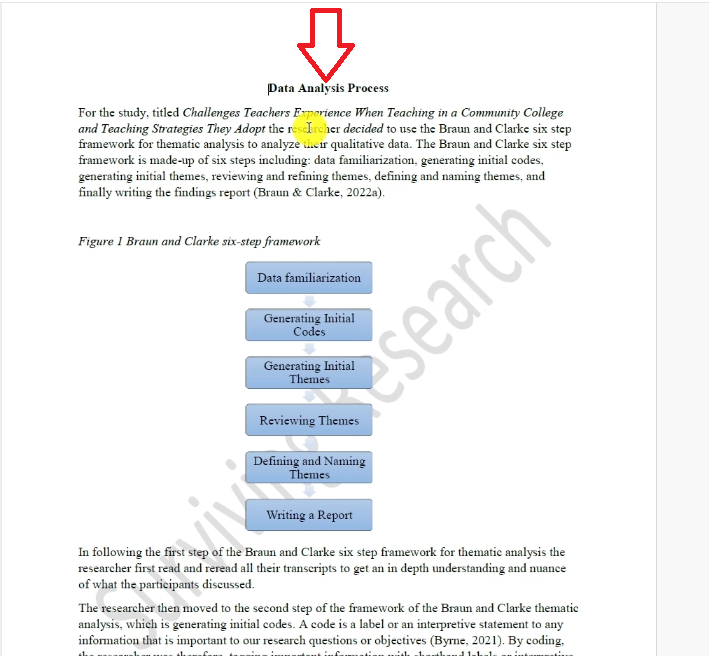
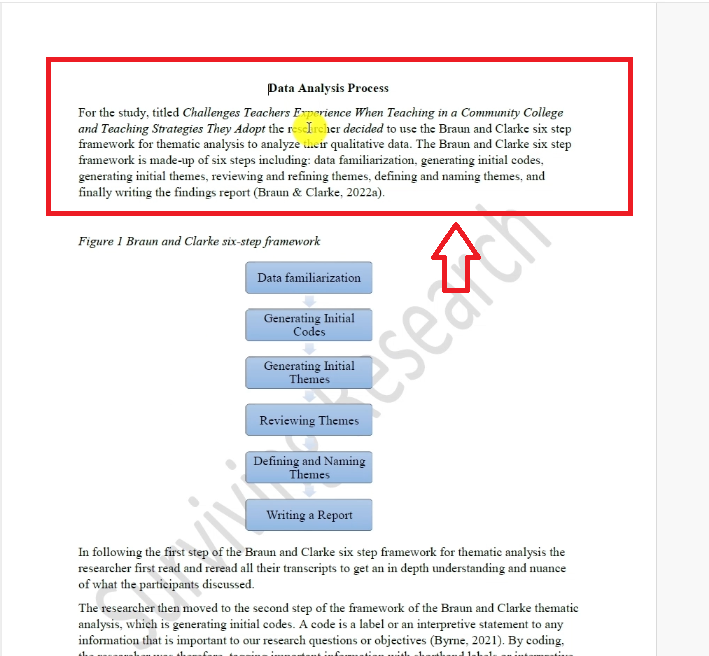
The first substantive section of your findings chapter is the data analysis process. This is where you tell your reader exactly how you analysed your data.
Here is what to include:
- State the analytical approach you used — e.g. inductive thematic analysis following Braun and Clarke (2006)
- Describe how you familiarised yourself with the data (transcription, reading, note-taking)
- Explain how you generated initial codes — include a sample table of 5–10 initial codes from your MAXQDA file
- Describe how you moved from codes to preliminary themes
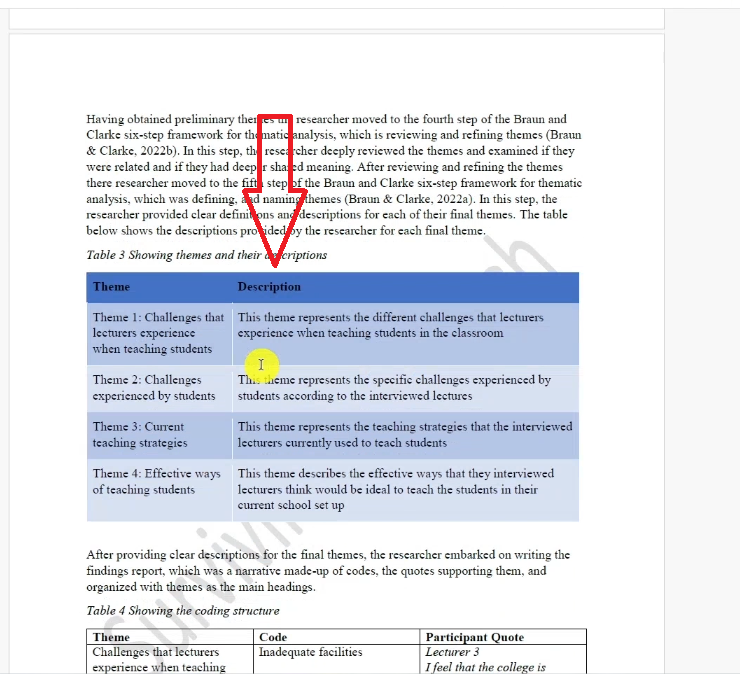
- List your final themes with a brief description of each — a table works well here
- Add a coding structure table: themes in column 1, codes in column 2, number of quotes in column 3
Write everything in first person (‘I followed…’, ‘I identified…’) and include APA 7 citations wherever you reference Braun and Clarke or any other methodological source. The frequency numbers from MAXQDA go directly into the quote-frequency column of your coding structure table.
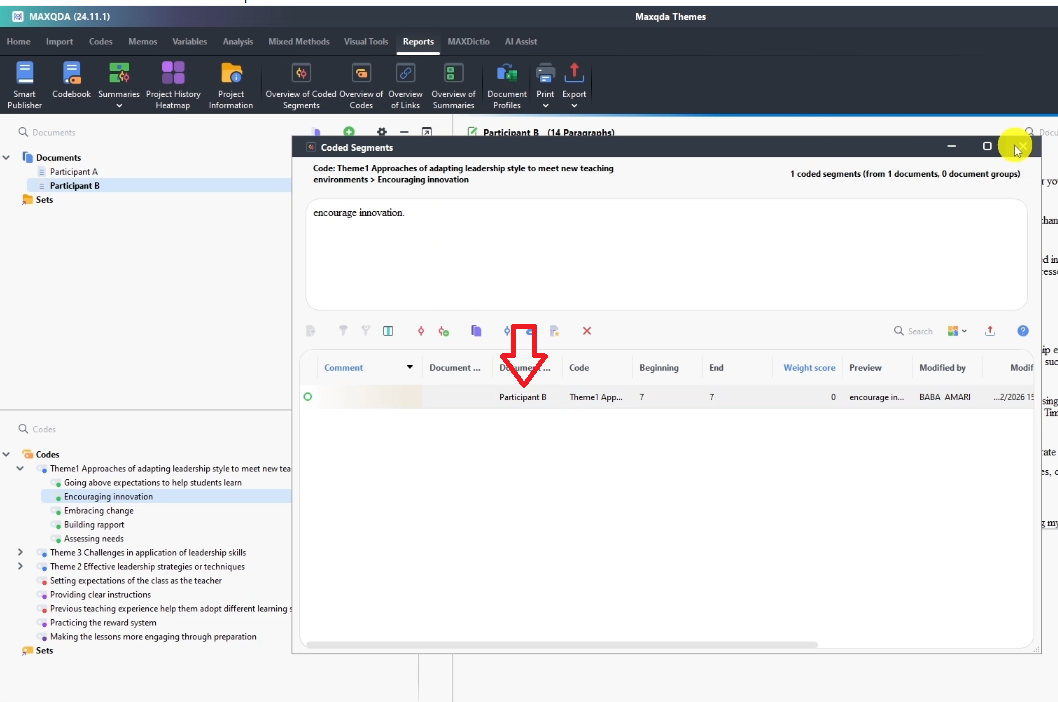
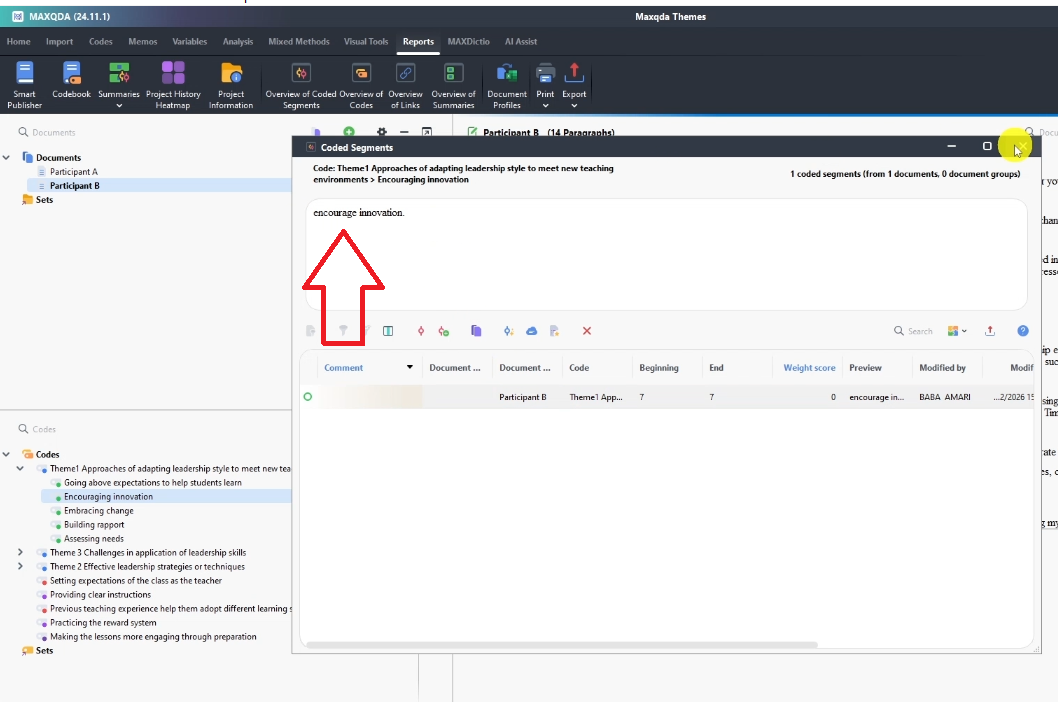
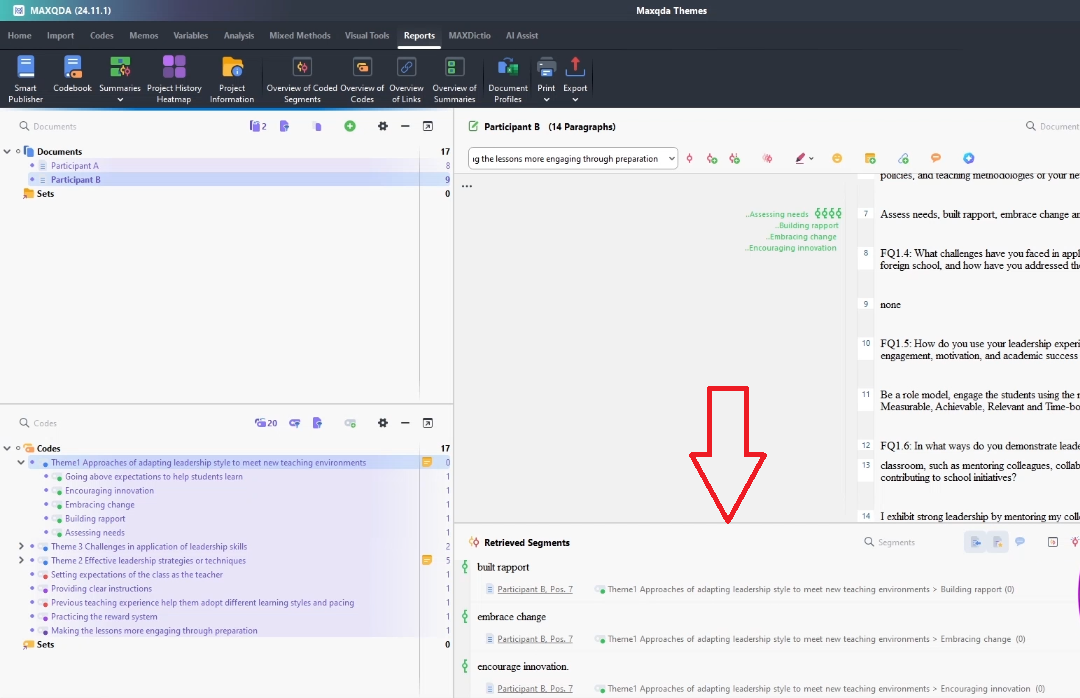
Step 4 — Retrieve Quotes Directly from MAXQDA
Every theme in your findings chapter needs to be supported by direct participant quotes. MAXQDA gives you two ways to retrieve them.
Method 1: Double-click on a code
- In the Code System panel, double-click the code you want
- Click on the relevant transcript in the Document Browser
- The coded segment — your quote — will be highlighted in the text
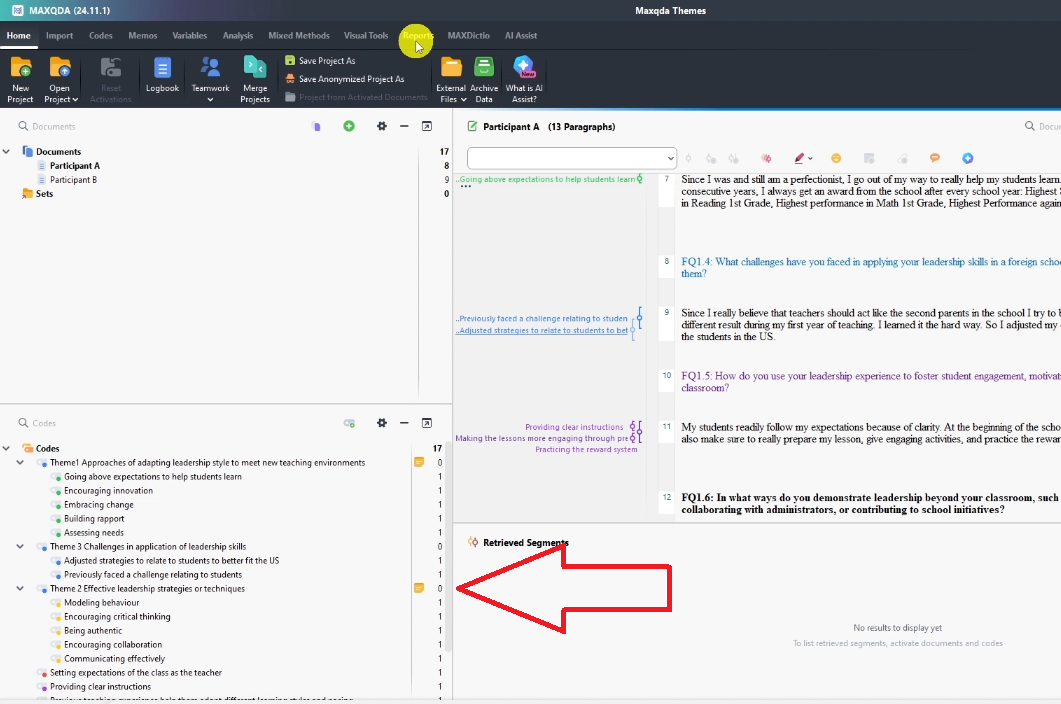
Using Retrieved Segments to Export All Quotes at Once
This is the faster method when you have many codes:
- In the Code System panel, select all codes (or just the ones you need)
- Click Activate on your selections
- Go to Retrieved Segments — all matching quotes will appear
- Click Export → choose Excel
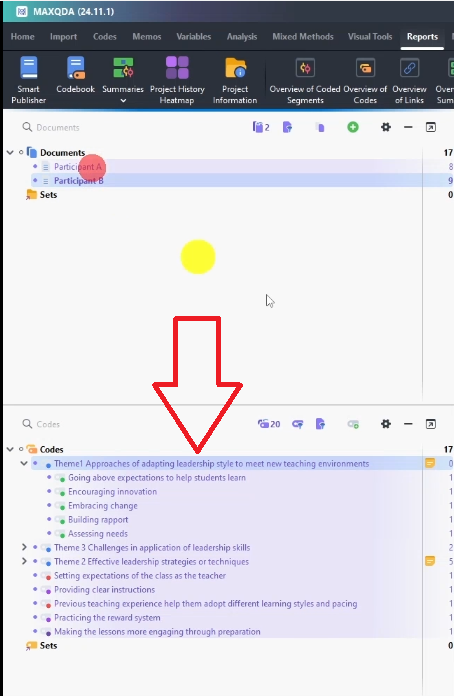
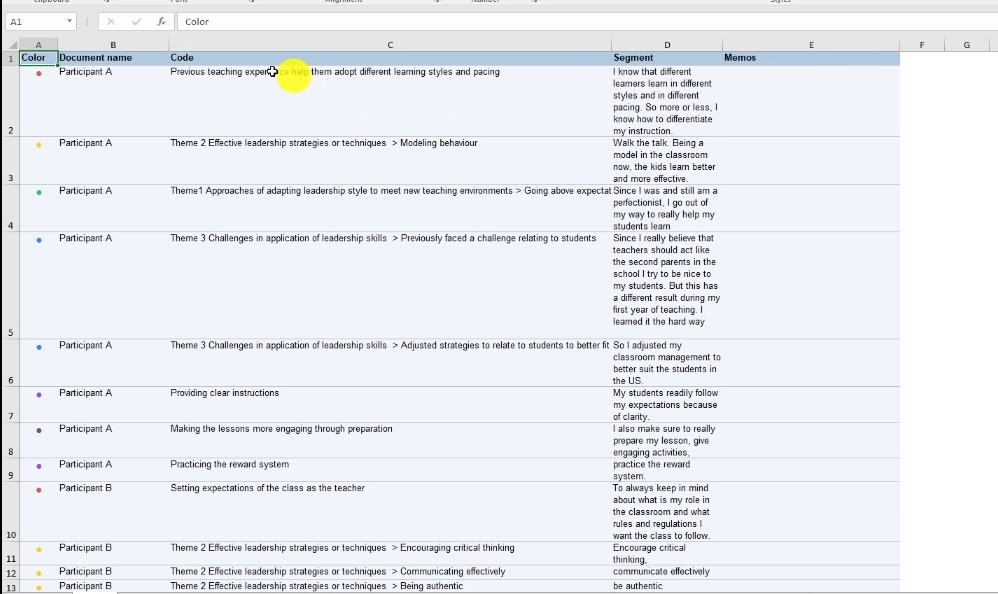
You now have a spreadsheet with every quote, the code it belongs to, and the participant it came from. This makes it easy to copy and paste quotes directly into your findings chapter. For a broader overview of how thematic analysis methodology works, Scribbr’s guide to thematic analysis is a well-structured resource widely used by PhD students.
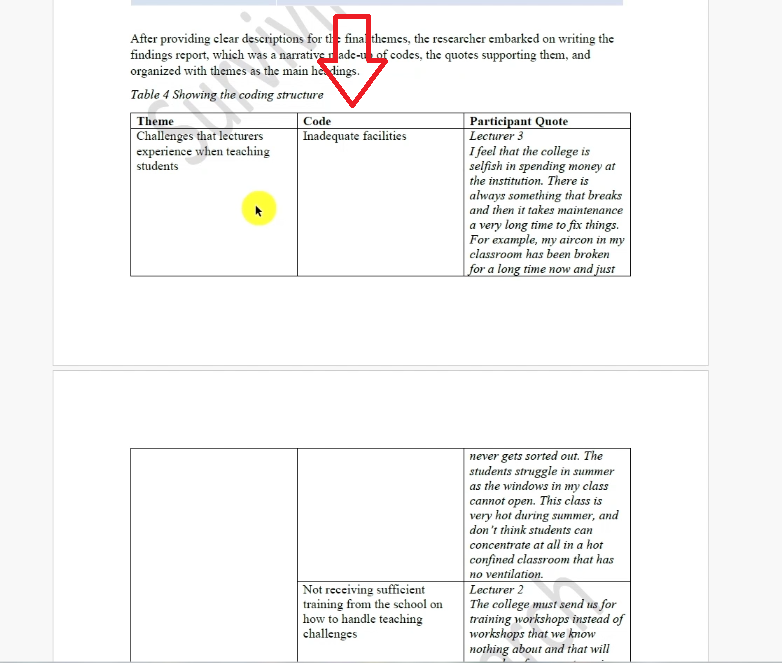
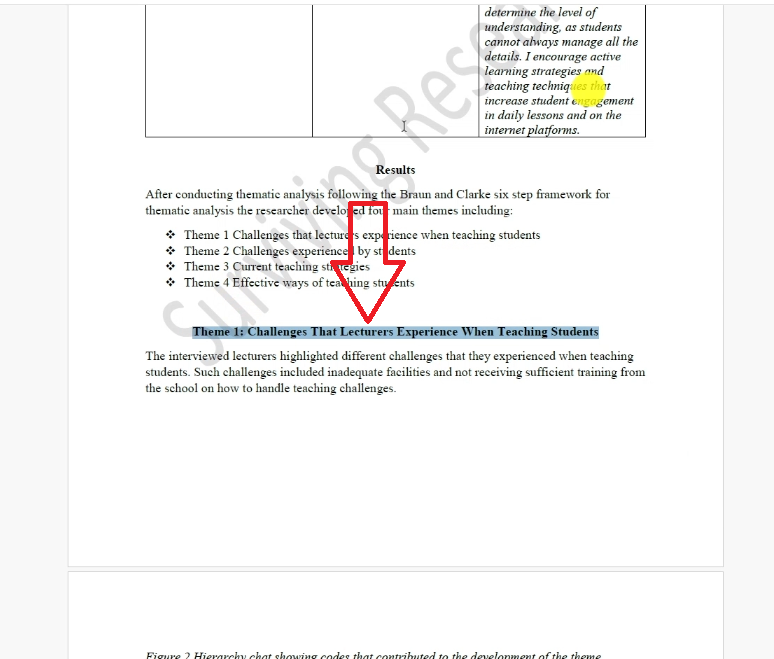
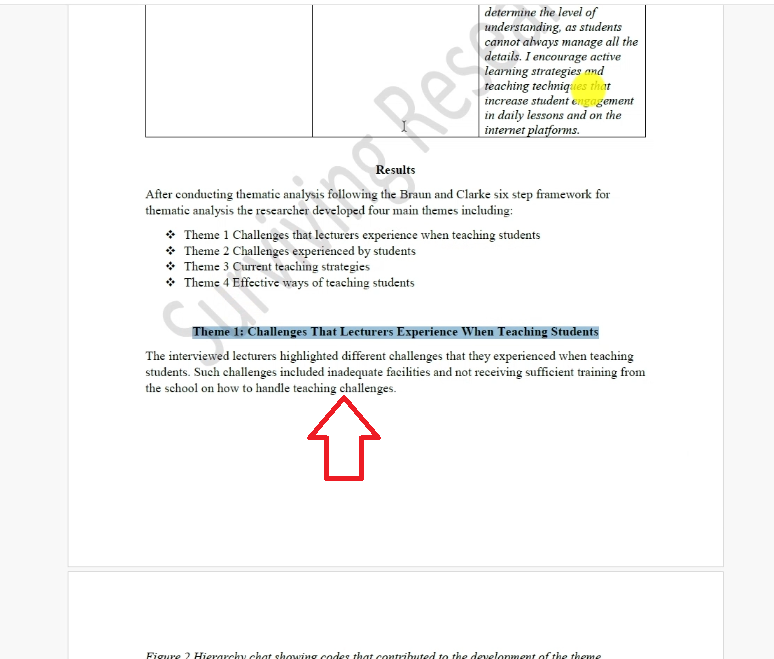
Step 5 — Present Your Findings with Themes as Headings
Once you have your quotes and your codebook, you can write the findings section itself. Here is the structure that works:
- Use each theme as a main heading (H2 in Word)
- Start with a theme description: 2–3 sentences explaining what this theme is about and what it means for your study
- Write a narrative: explain how this theme emerged and what your participants were experiencing
- Include supporting quotes: at least 2–3 direct quotes per theme, attributed to individual participants (e.g. Participant A, Participant B)
- Add visuals if needed: a table showing codes within the theme, or a word cloud from MAXQDA
The narrative is where most students struggle. A common mistake is simply listing quotes without analysis. Your job is to interpret the quotes — explain why they matter, what they reveal about your research question, and how they connect to the theme you described.
Step 6 — Add Visuals to Strengthen Your Report
MAXQDA has built-in visual tools that make your findings chapter more compelling. The most useful is the word cloud.
To create a word cloud in MAXQDA:
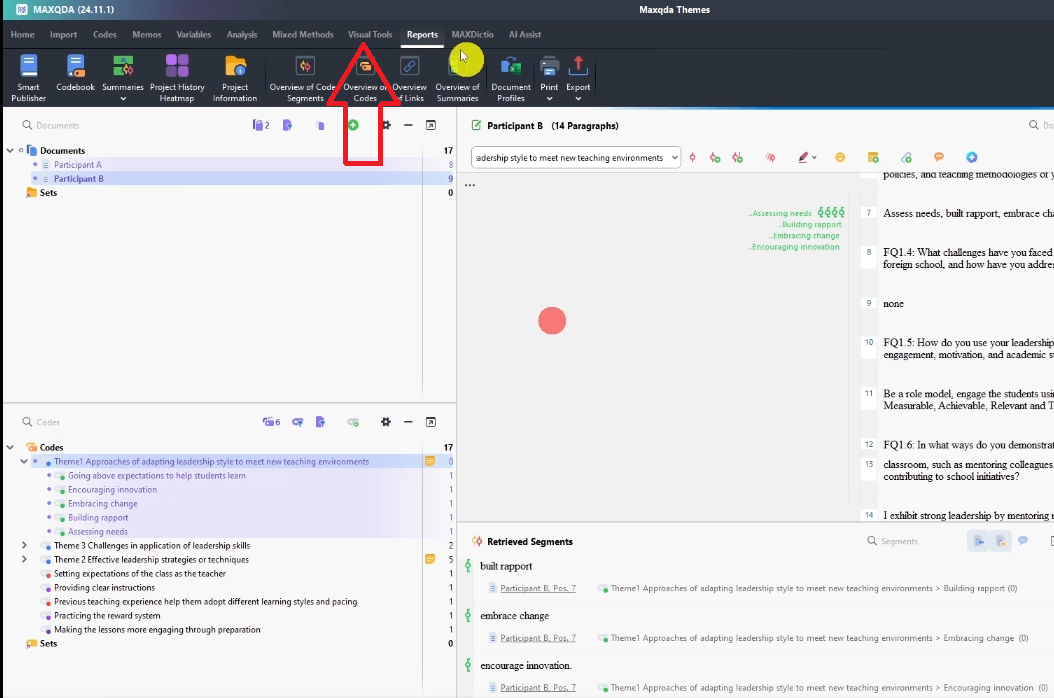
- Click on one of your themes in the Code System panel
- Go to Visual Tools in the top menu
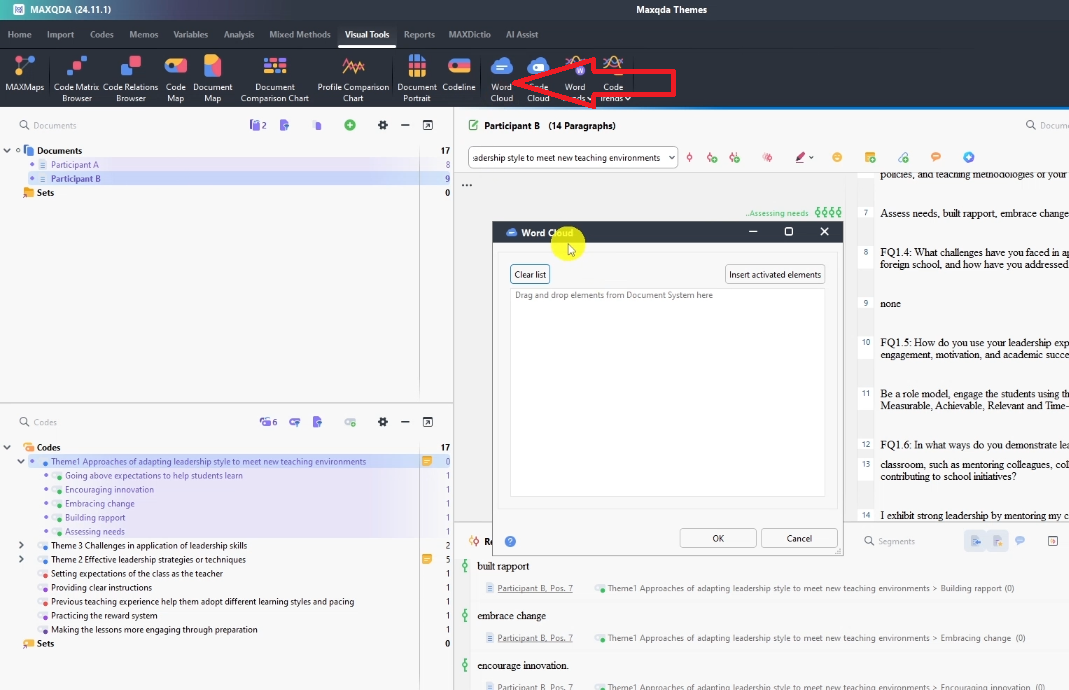
- Select Word Cloud
- Click Insert Activated Elements and click OK
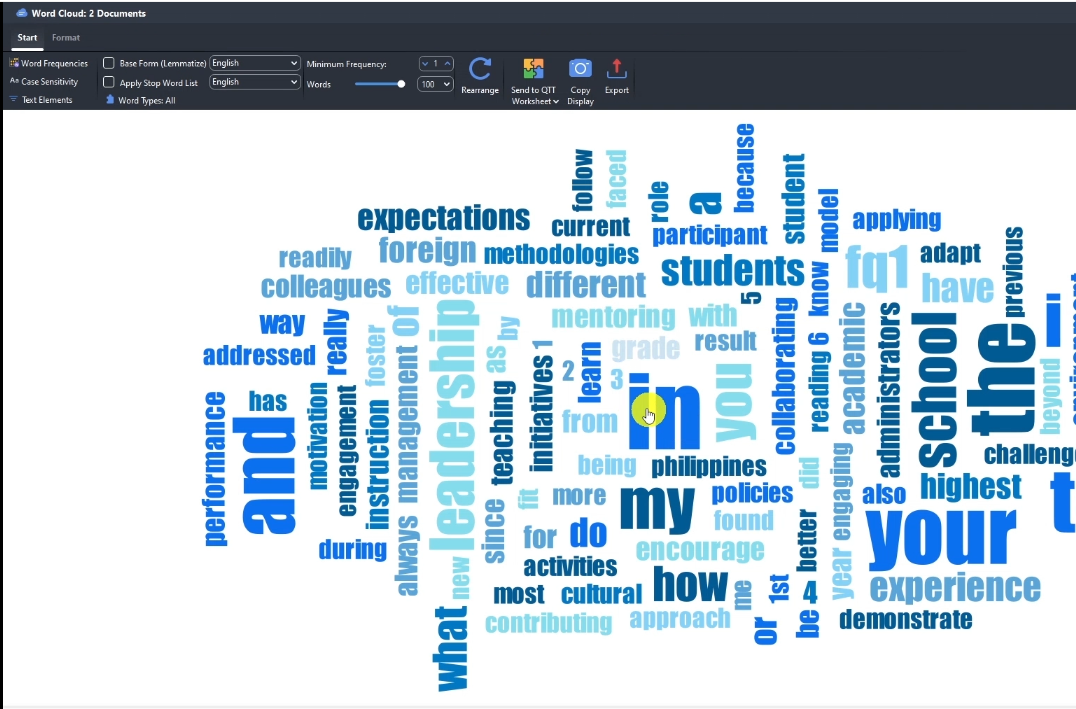
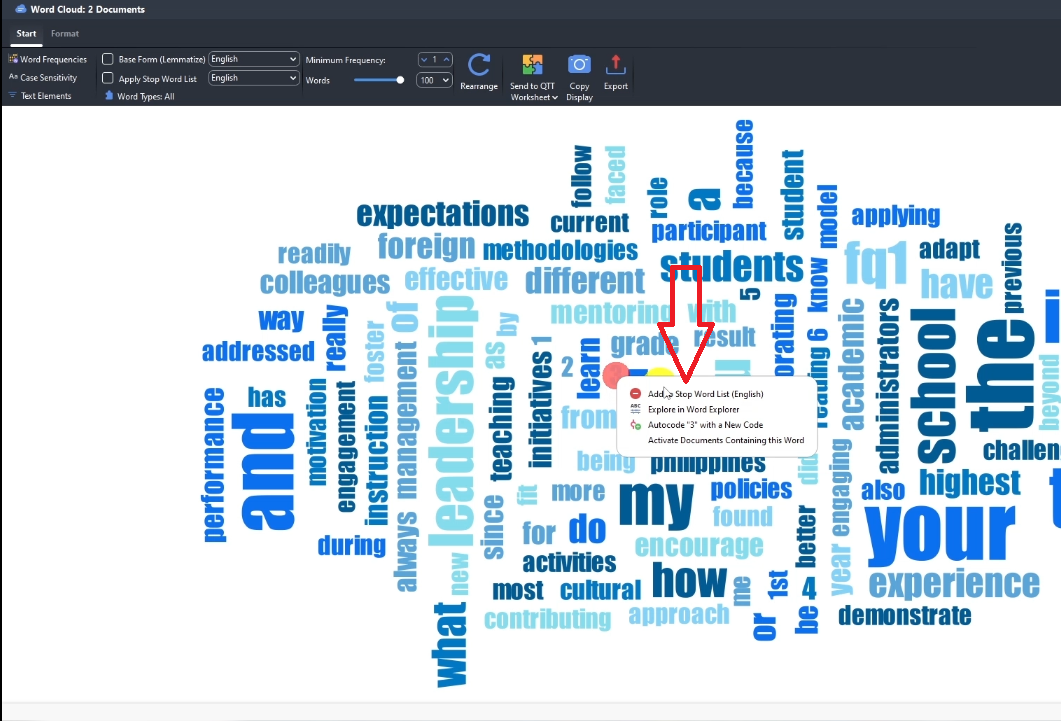
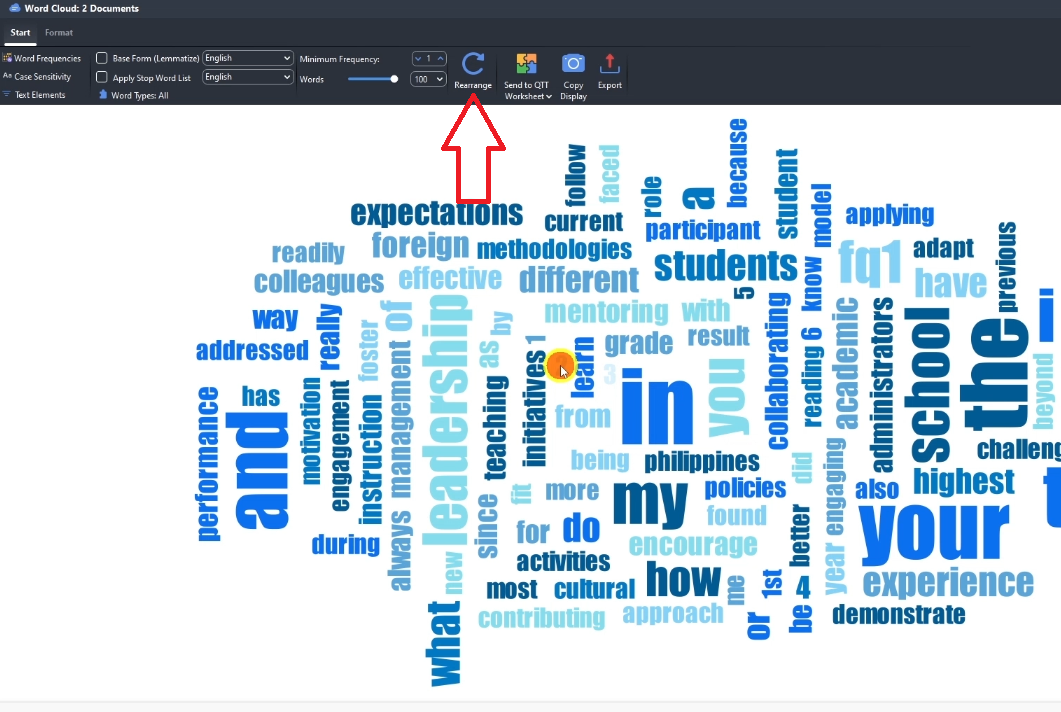
To clean the word cloud: right-click any unwanted word → Add to Stop Word List, then click Rearrange. Export it as an image and insert it into your findings chapter as a visual summary of the theme.
Coding structure tables — showing themes, codes, and quote frequencies at a glance — are also very effective in PhD dissertations
For guidance on how qualitative findings should be structured to meet academic standards, the SAGE Research Methods platform has peer-reviewed resources that align well with what supervisors expect.
Frequently Asked Questions
How long should my thematic analysis findings chapter be?
It depends on your study, but most PhD thematic analysis findings chapters run 4,000–8,000 words. Aim for at least 3 themes with 500–800 words each, plus the data analysis process section.
Do I have to follow Braun and Clarke in MAXQDA?
No. MAXQDA is a tool, not a methodology. You can use Braun and Clarke’s framework, Saldana’s coding manual, or another approach. MAXQDA simply stores your codes and retrieves your data. The methodology you follow is documented in your write-up, not in the software.
What is the difference between a codebook and a findings chapter?
The codebook is an internal working document that lists your codes and themes with descriptions. The findings chapter is what you submit to your supervisor — it presents your results in narrative form with evidence. The codebook feeds the findings chapter; it is not submitted on its own.
How do I cite MAXQDA in my dissertation?
Use the software citation: VERBI Software. (2021). MAXQDA 2022 [computer software]. VERBI Software. Available from maxqda.com — adjust the year to match your version. Place this in your data analysis process section where you describe the tools used.
Can I use screenshots from MAXQDA in my dissertation?
Yes. Screenshots of your code system, retrieved segments, or word cloud can be included as figures. Label them Figure 1, Figure 2, etc., and add a descriptive caption below each one.
Key Takeaways
Reporting thematic analysis findings in MAXQDA follows a clear six-step sequence:
- Export your code system as a Word codebook before you start writing
- Write your data analysis process section first — describe every step you took with citations
- Build your coding structure table using frequency numbers from MAXQDA
- Retrieve participant quotes via double-click or the Retrieved Segments Excel export
- Present themes as H2 headings, each with a description, narrative, and supporting quotes
- Add word clouds or coding tables from MAXQDA to provide visual evidence
This is the third post in the MAXQDA series. Start from the beginning with interview coding in MAXQDA, move through developing themes in MAXQDA, or take the full journey with the complete MAXQDA qualitative analysis tutorial.
| Get Expert Help with Your Qualitative Analysis |
| If your findings chapter is holding up your PhD, you do not have to figure it out alone. My team at Surviving Research offers a done-for-you thematic analysis service — full MAXQDA analysis, themes, codebook, and write-up support, delivered to you. We have helped nearly 500 PhD students complete their dissertations and graduate. Book a consultation here. |
![How to Code Qualitative Data in MAXQDA [Step-by-Step Guide]](https://survivingresearch.com/wp-content/uploads/2024/08/Maxqda-Tutorial.webp)
![Is AI Ethical for Qualitative Data Analysis? [Tested]](https://survivingresearch.com/wp-content/uploads/2025/04/Can-I-use-AI-to-do-qualitative-coding-ethically.jpg)
Pingback: Interview Coding in MAXQDA: Step-by-Step Beginner Guide -