Last Updated on 2 months ago by Grace Nyambura
One of the most powerful — and most underused — features in NVivo is the word cloud. After you’ve completed your thematic analysis, a word cloud gives you an instant visual summary of the most frequently occurring words within any theme, helping you see patterns at a glance and produce compelling visuals for your findings chapter.
In this guide, I’ll show you exactly how to create, clean, and export a word cloud in NVivo after conducting thematic analysis — step by step, with no prior experience needed.
Quick summary: An NVivo word cloud is a visual representation of word frequency within your coded data. The larger the word appears, the more frequently it occurred across your transcripts within that theme or code.

What Is a Word Cloud in NVivo?
An NVivo word cloud is a visualization tool that displays the most frequently used words in your qualitative data. Words that appear more often across your transcripts show up larger, giving you an immediate visual sense of what dominated your participants’ responses within a given theme.
Word clouds are particularly useful in qualitative research for two reasons. First, they help you quickly validate that your theme is capturing what you intended — if unexpected words dominate, it may signal a coding issue. Second, they produce professional-looking visuals you can insert directly into your dissertation’s findings chapter.
According to Scribbr’s guide to qualitative data analysis, visualizations like word clouds are increasingly expected in PhD-level qualitative research as a way of presenting data transparently. For full documentation on NVivo’s visualization tools, visit the official NVivo resource hub at Lumivero.
Step 1 — Open Your Theme in NVivo
Before generating a word cloud, make sure you have completed your thematic analysis and your codes and themes are organized in NVivo. If you haven’t done this yet, start with the step-by-step guide to Braun and Clarke’s thematic analysis in NVivo before continuing here.
Once your themes are ready:
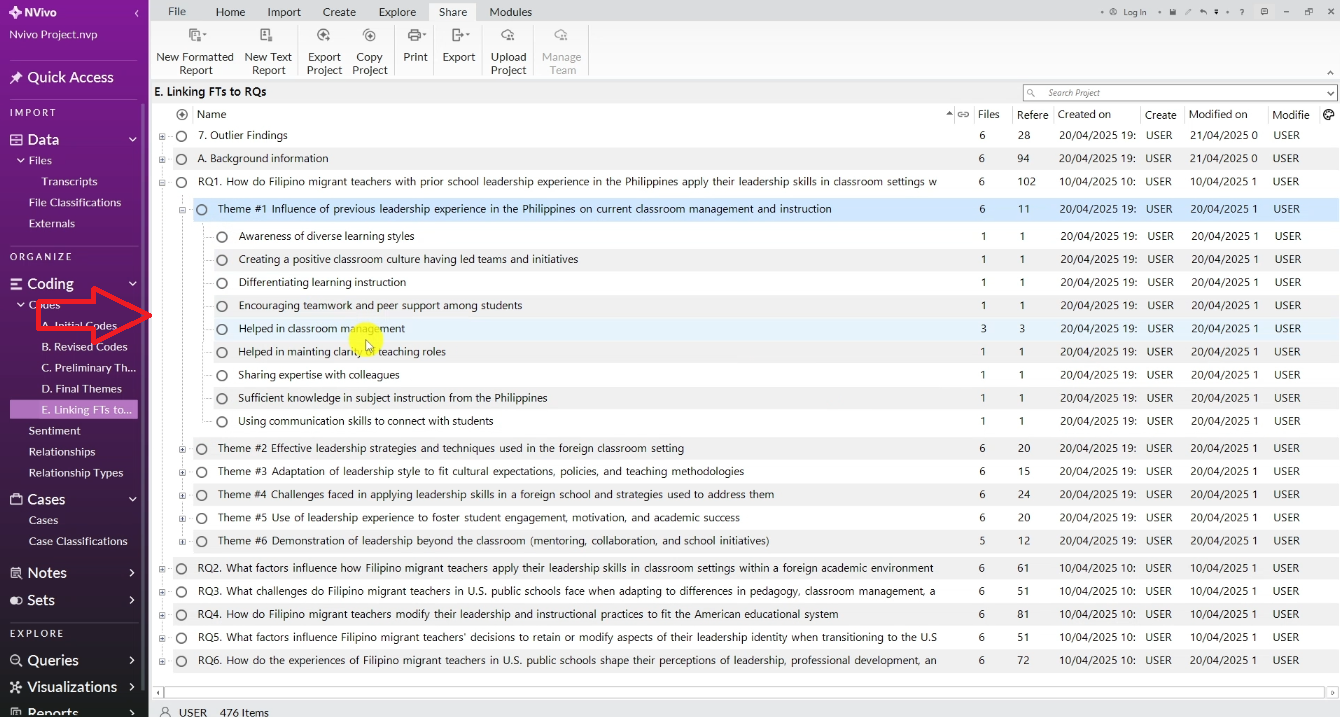
- Go to your Codes or Themes section in the left panel
- Locate the theme you want to visualize — for example, ‘Effective Leadership Strategies and Techniques Used in Foreign Classroom Settings’
- Right-click on that theme
Step 2 — Generate the Word Cloud
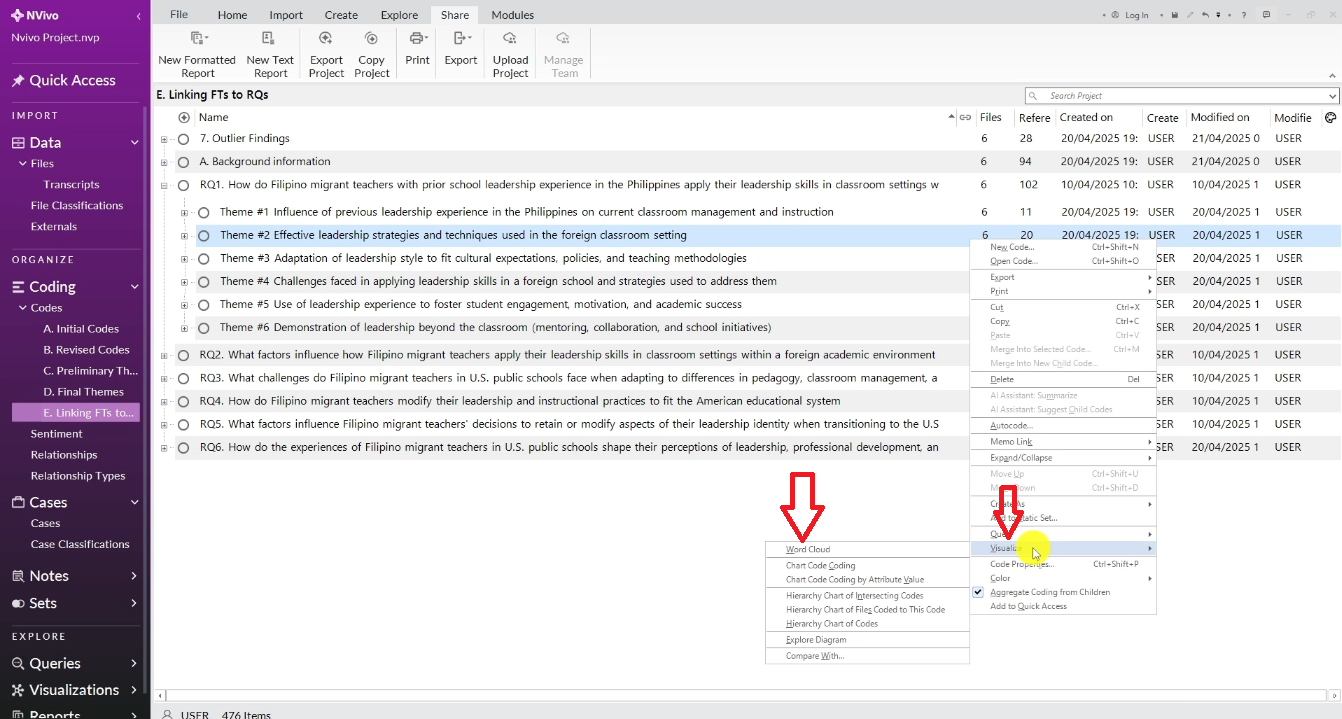
From the right-click menu:
- Select Visualize
- Click Word Cloud
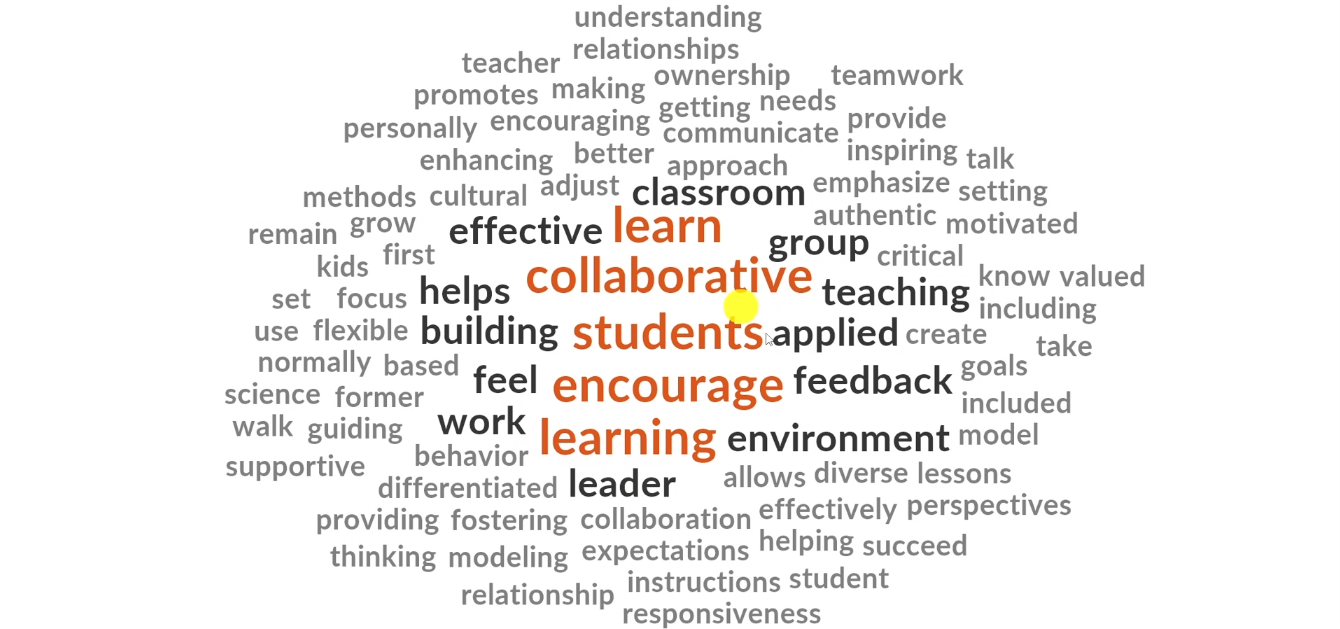
NVivo will instantly generate a word cloud based on all coded data within that theme. The words that appeared most frequently across your participants’ responses will appear largest in the cloud.
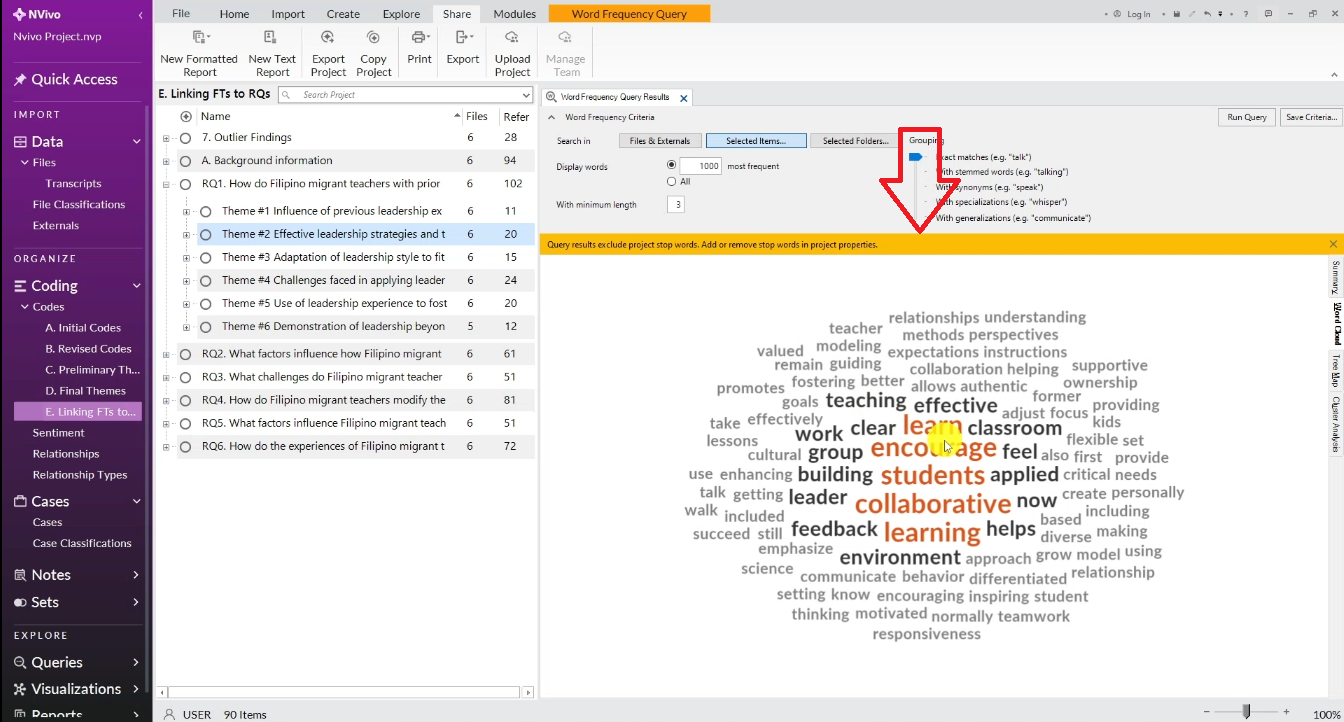
At this stage, your word cloud is functional but may include filler words like ‘also’, ‘now’, ‘still’, or ‘one’ that don’t add analytical value. That’s where the stop words feature comes in.
Step 3 — Clean Your Word Cloud Using Stop Words
Stop words are common words you want to exclude because they appear frequently but carry no meaningful information. NVivo makes it easy to remove them one by one.
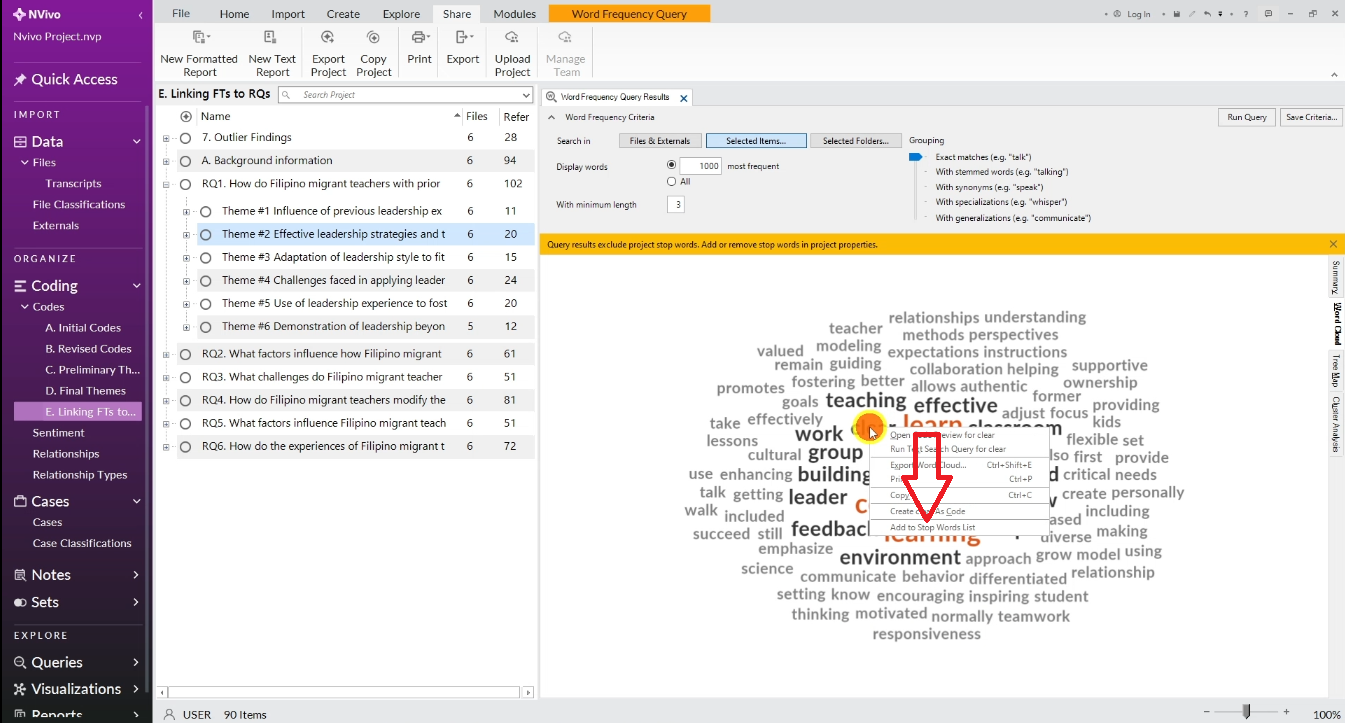
For each word you want to remove:
- Click on the word in the word cloud to select it
- Right-click and choose Add to Stop Words List
- Click OK
- Repeat for every filler word you want to remove
Common words to add to your stop words list: also, now, still, one, just, like, well, can, will, that, this, every, said, even.
There is no limit to how many words you can remove — keep going until only analytically meaningful words remain.
Step 4 — Re-Run the Query and Export
After adding all your stop words:
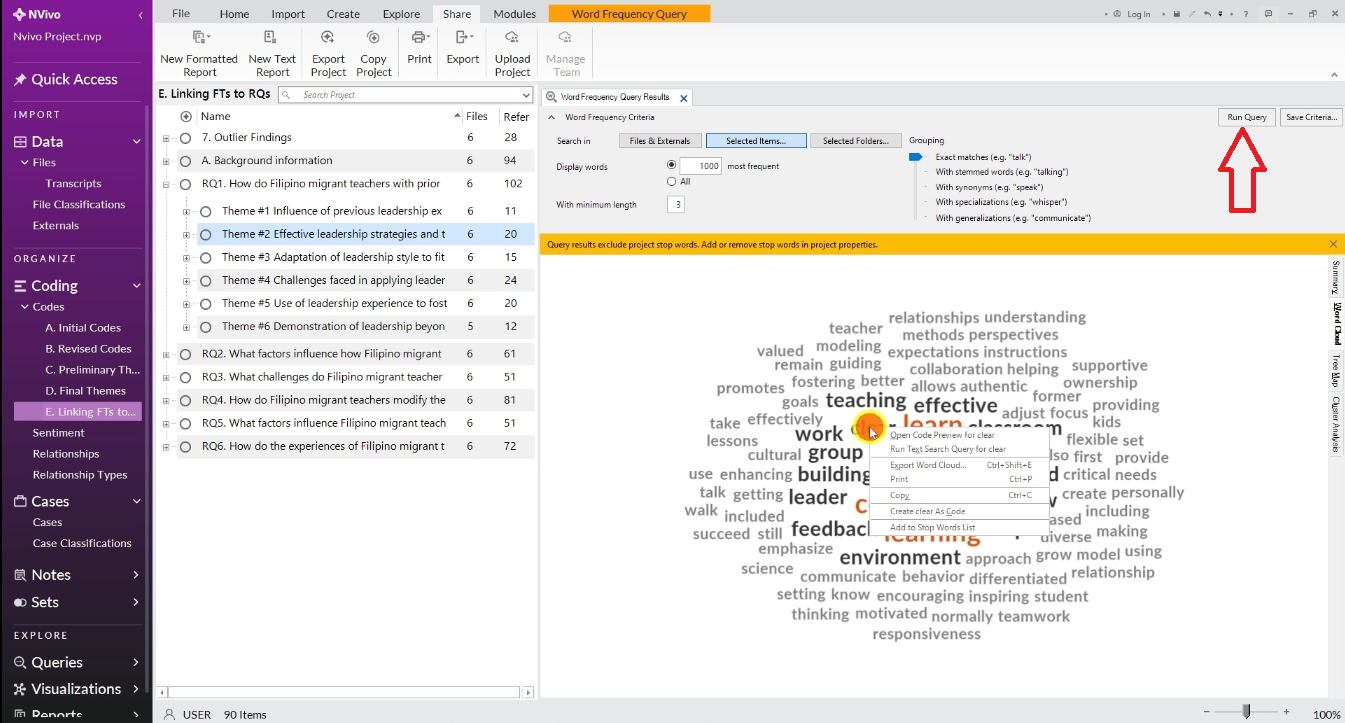
- Click Run Query to regenerate the word cloud with stop words removed
- Give NVivo a moment to process and refresh
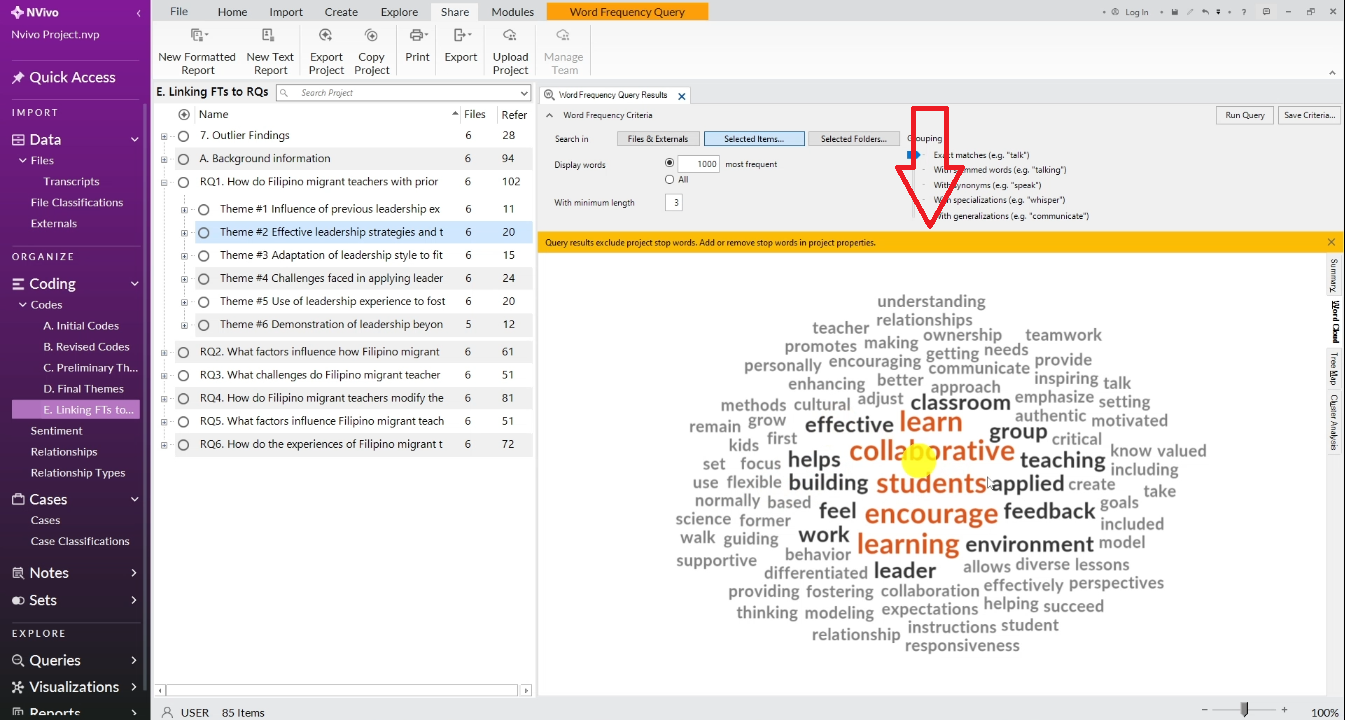
- Review the updated cloud — removed words will no longer appear
- Right-click anywhere on the word cloud
- Select Export Word Cloud
- Save as JPEG or PNG
Your word cloud is now saved as an image you can insert directly into your dissertation, a PowerPoint presentation, or a conference poster.
How to Use Your Word Cloud in Your Findings Chapter
Once exported, your NVivo word cloud can be used in several powerful ways in your dissertation’s findings chapter.
As a Theme Introduction Visual
Place the word cloud at the start of each theme section to give readers an immediate visual overview before presenting your coded findings. Label it clearly: ‘Figure 4.1: Word Cloud for Theme 2 — Effective Leadership Strategies’.
As a Supporting Figure
Reference it directly in your text: ‘As illustrated in Figure 4.1, the most prominent terms within Theme 2 were collaboration, mentoring, and support, reflecting participants’ emphasis on peer-based learning.’
As a Comparison Tool
Generate word clouds for multiple themes side by side to show how participant language shifted across different themes. This demonstrates the distinctiveness of each theme to your examiner.
According to the Grad Coach’s guide to writing a findings chapter, visuals like word clouds strengthen qualitative findings by making abstract patterns concrete and accessible to examiners. For academic grounding, Braun and Clarke’s foundational thematic analysis paper (2006) remains the standard reference for how frequency patterns support theme development.
Common Mistakes to Avoid
Not Cleaning the Stop Words List
A word cloud full of ‘and’, ‘the’, and ‘also’ looks unprofessional and doesn’t reflect your analysis. Always clean it before exporting — your examiner will notice.
Using the Word Cloud as Your Only Visualization
Word clouds are a great starting point, but combine them with NVivo project maps for a fuller picture of how themes and participants connect. Check out how to build an NVivo project map after thematic analysis for the next step.
Not Labelling the Figure
Always add a figure number and caption in your dissertation. Unlabelled visuals look like afterthoughts. Use the format: ‘Figure 4.X: Word Cloud for Theme X — [Theme Name]’.
Final Thoughts
Creating a word cloud in NVivo after thematic analysis takes less than five minutes, but the visual it produces can significantly strengthen how your findings are presented. It shows your examiner that you’ve used your analysis software to its full potential and that your themes are grounded in real patterns from your data.
Once your word clouds are done, the next step is writing up your findings. Read the guide on how to report findings after conducting thematic analysis in NVivo for a complete walkthrough of turning your NVivo visualizations into a polished findings chapter.
Need help with your qualitative data analysis? I offer a done-for-you qualitative data analysis service that includes coding, theme development, and visualization — all in NVivo, with a step-by-step walkthrough video so you understand exactly what was done.