If N-Vivo feels overwhelming and you’re not sure how to analyze your interviews properly, this article is for you.
In this full course tutorial, I’ll take you through the entire qualitative analysis process in N-Vivo, we’ll go from:
- raw transcripts
- coding interviews
- developing themes
- reporting findings
- visualizing results clearly and professionally
By the end, you’ll know exactly how to use NVivo for your thesis or dissertation.
My name is Bernard Mugo. I like to refer to myself simply as an academic.

In the past four years, I’ve helped more than 600 PhD students analyze qualitative data and finally complete their thesis or dissertations, in the course of helping such a large number of students have gained invaluable experience in the best practices that you can use to perform qualitative analysis of your interviews and be able to retrieve quality findings.
Qualitative Coding of interviews with Nvivo
One of the most important skills that we have to master when we want to analyze qualitative data is generating qualitative codes or what we call coding in qualitative analysis.
Introduction to Coding
Coding is the process of tagging important quotes from your original data and interpreting such data in a way that we can combine those codes to form themes in a later stage.
Example of Codes
Now I’ll begin this article by showing an example of some codes I generated in one of my previous articles.
Remember I get all these transcripts from a website called fig-share.
You can see in the comments I was coding manually.
We can code manually or we can code in-Vivo.
But before we introduce in-vivo, let’s just read some codes I had generated.
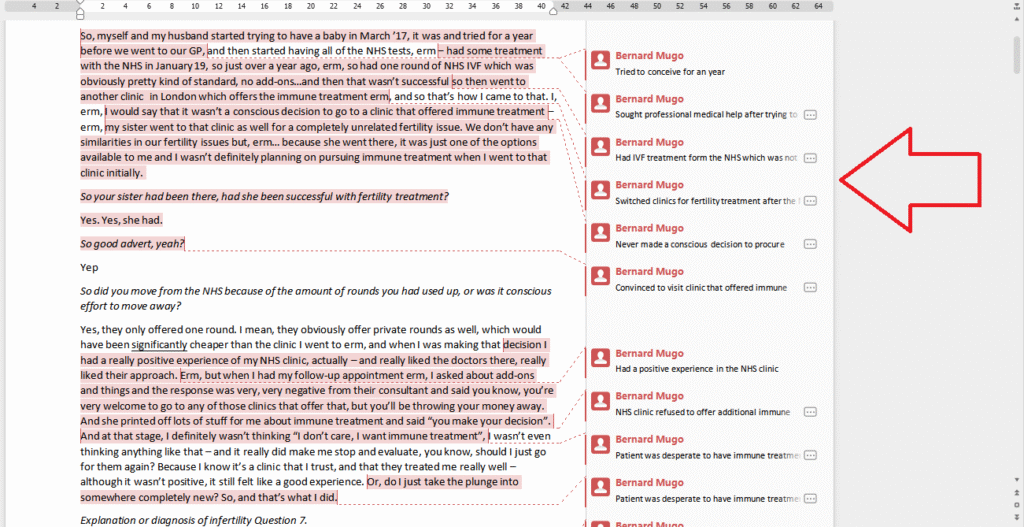
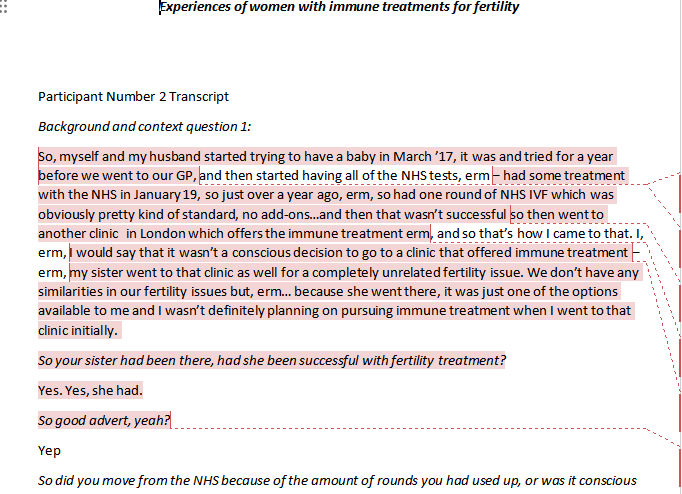
This was a transcript about experiences of women with immune treatments for fertility.
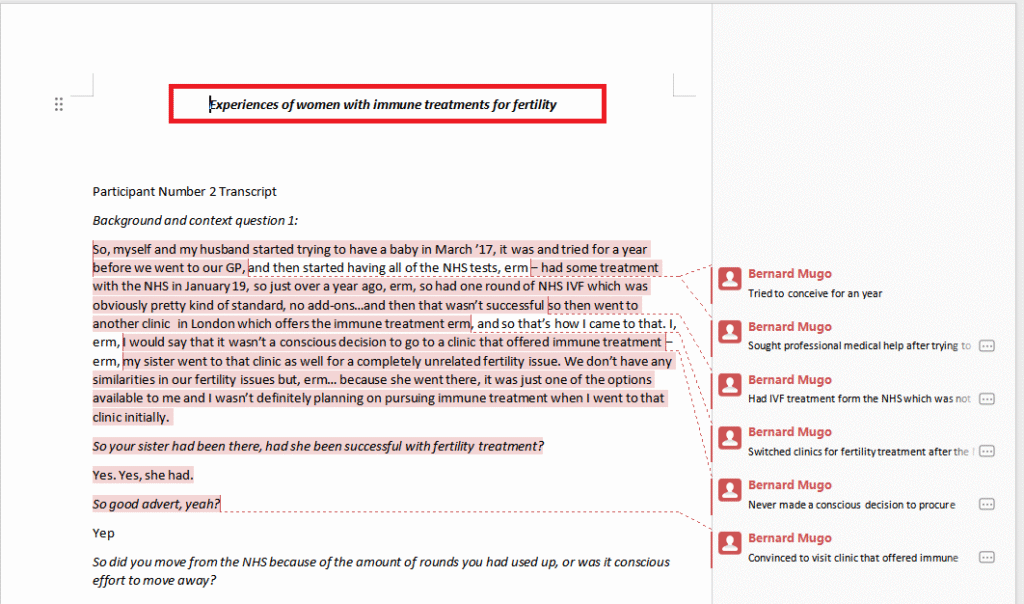
Let me read this paragraph and see the codes I generated.
So myself and my husband started trying to have a baby in March 17th, it was and tried for a year before we went to our GP and then started having all of the NHS tests.
Has some treatment with NHS in January 19 so just over a year ago.
So had one round of N-H-S I-V-F, which was obviously pretty kind of standard, no adults, and then that wasn’t successful, so then went to another clinic in London, which of has immune treatment. And so that’s how I came to that. I would say that it wasn’t a conscious decision to go to a clinic that offered immune treatment.
My sister went to that clinic as well for a completely unrelated fertility issue. We don’t have any similarities in our fertility issues, but because she went there, it was just one of the options available to me and I wasn’t definitely planning on pursuing immune treatment when I went to that clinic initially.
let’s see the codes that we have for that.
The first one is, so myself and my husband started trying to have a baby in March 17, and I tried for a year before we went to our GP.
so tried to conceive for a year is the code.
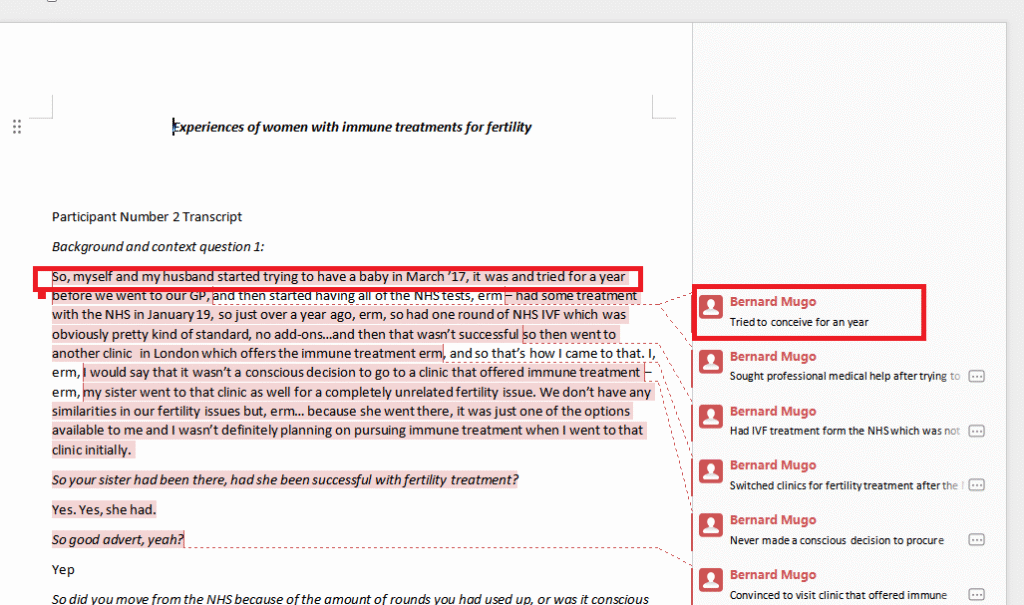
That’s the code that I attached to this statement.
Another code that I had was, then went to another clinic in London which offers immune treatment.
so my code was switched clinics for fertility treatment.
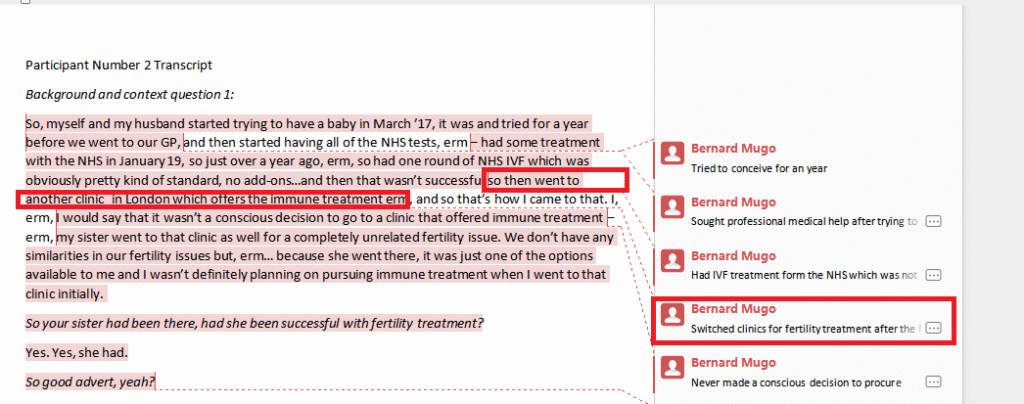
You can see I’m trying to interpret what this person is saying, that is what coding is about. I’m generally tagging important codes with either short labels or interpreting segments that are important to the original objective of this researcher.
That’s just an example
Coming up with Codes in N-Vivo
I would like us to do some coding together in N-Vivo.
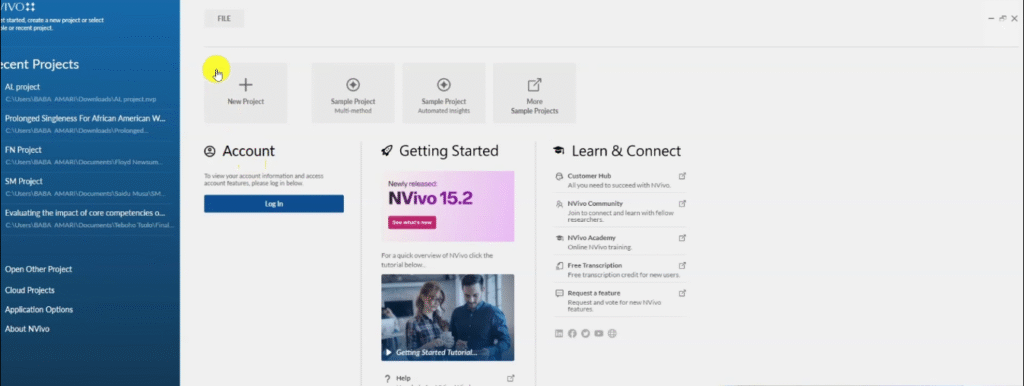
So the first thing that I’m going to do is to open N-Vivo.
Right now I am using N-Vivo 15 which is the latest version in 2025.
Probably there will be other versions in the future, but the basics of coding are still the same.
The study title for this tutorial is opinions of physiotherapist at the university teaching hospital on assessing psychological well-being of patients with stroke.

And I have three transcripts that we are going to do some coding in.
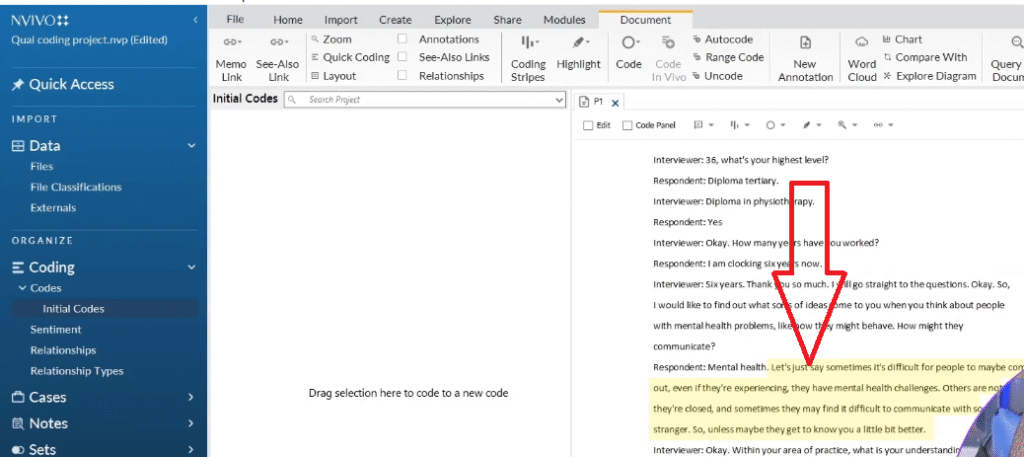
When you open N-Vivo the first thing that you see is this welcoming menu.
When you click on new projects we can name our project, I want to call this just a random name “Qual coding projects”.
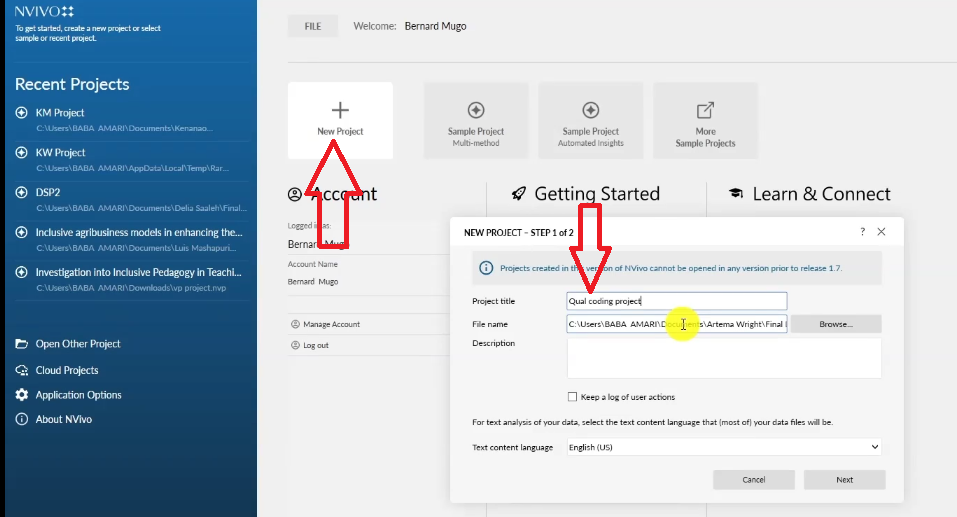
You can name it the way you want.
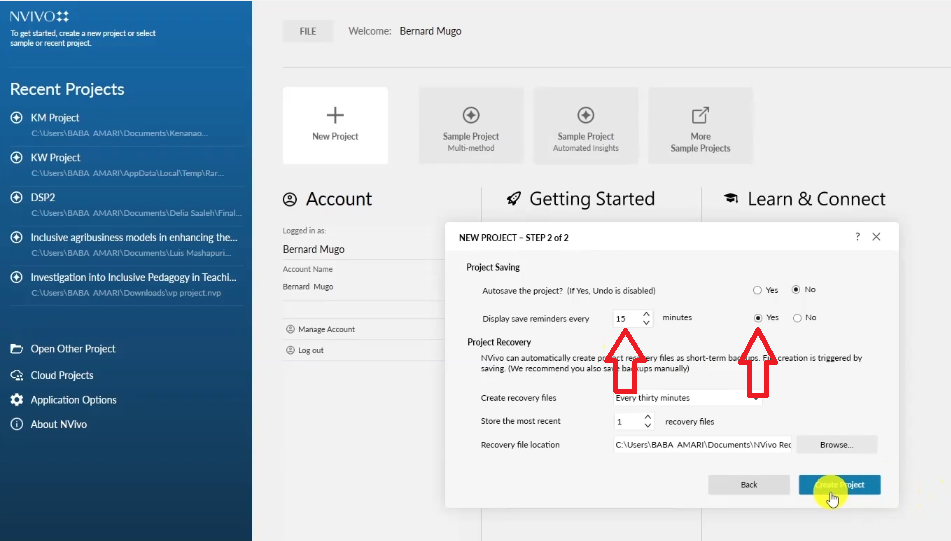
Then create project, of course we do not want to save, we displace reminder every 15 minutes then we create the project.
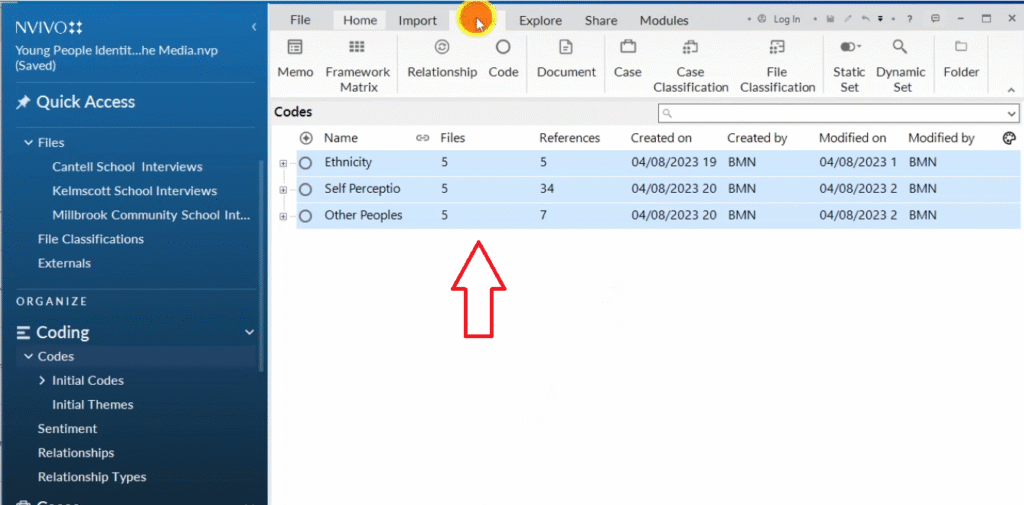
In N-Vivo, when conducting thematic analysis we only use the basic menus files and codes.
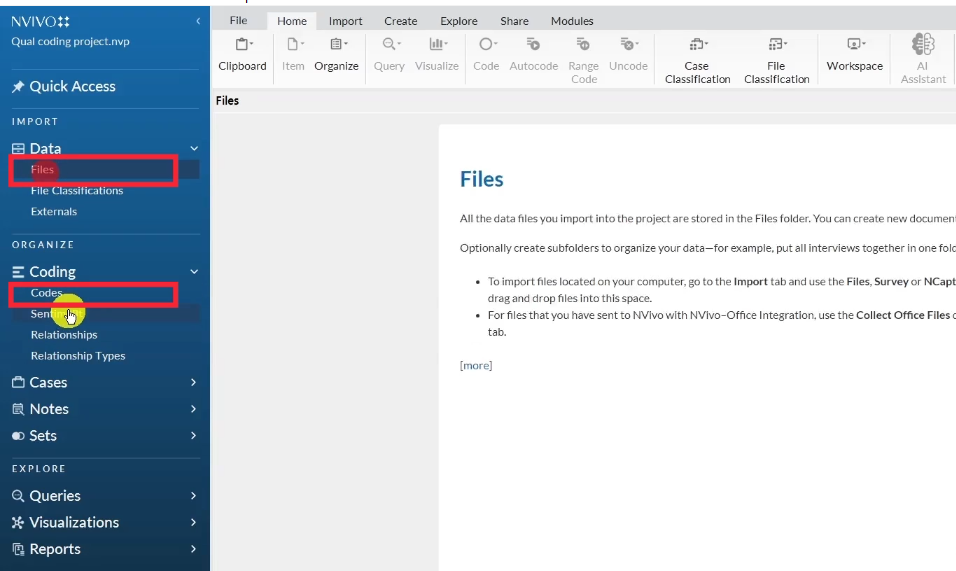
To upload the transcripts go to files then drag and drop the transcripts in the files section.

That is one way of importing.
Another way of importing is going to import.
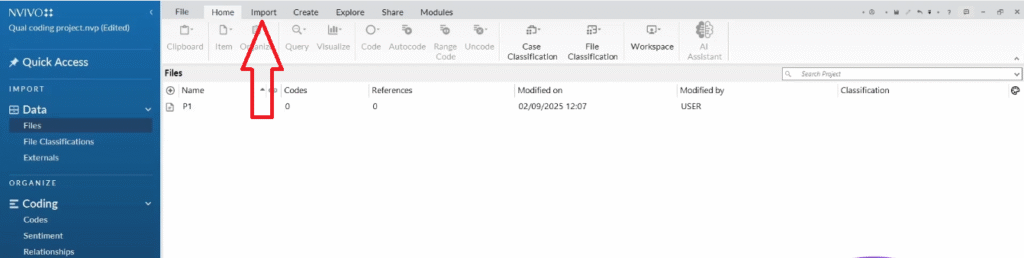
Then going to files then finding our files.

And then importing our files in there.
That’s another way of importing.
So how do we do coding?
The first thing that I like to do is be organized.
So in the code section, I like to create a folder called initial codes.
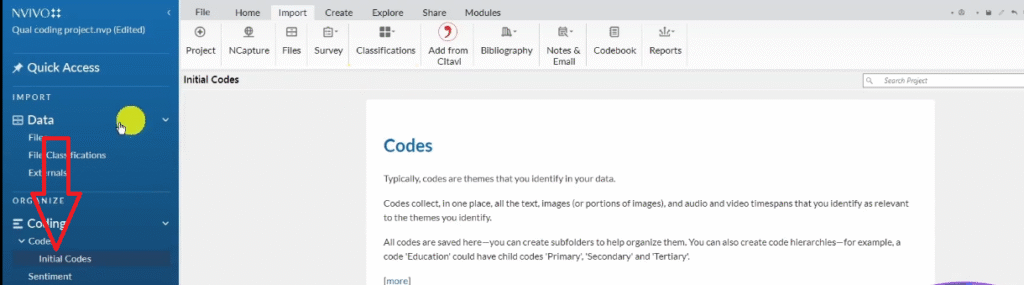
It’s not a must, but I like tracking my work because we are doing initial coding.
Then later we should go and combine codes based on shared meaning to form themes.
I go and open one of my transcripts by double clicking on it and then we start coding.

Now to code what do we need to do?
We need to understand the main issue that we wanna analyze.
Here we’re looking at opinions of physiotherapists at a university teaching hospital on assessing the psychological wellbeing of patients with stroke.
Ideally these interviews are about the psychological helpings of patients with stroke.
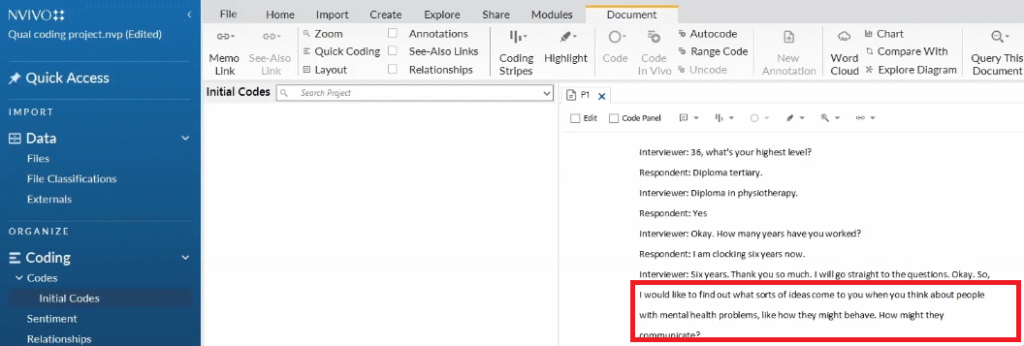
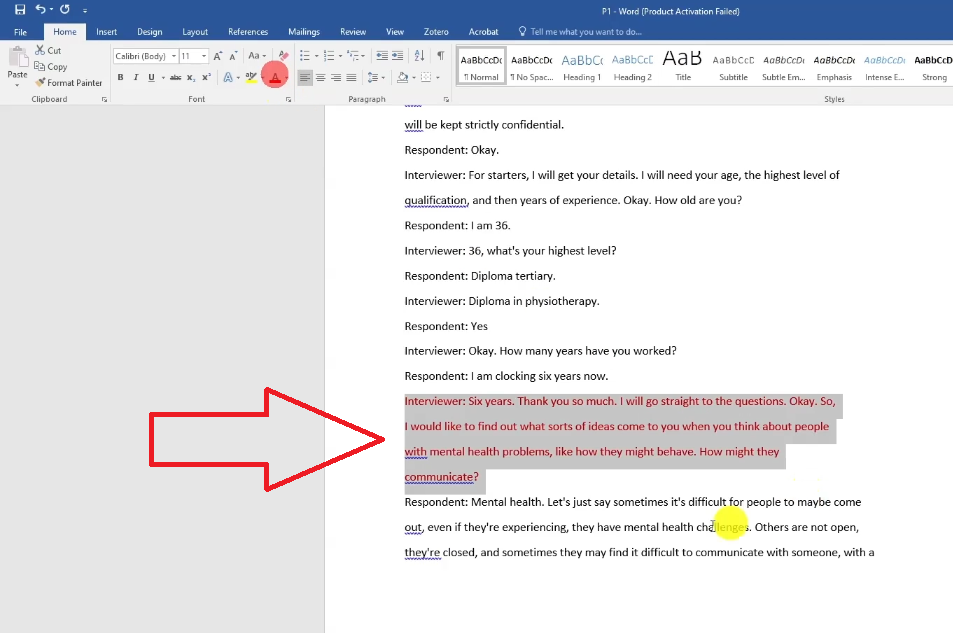
So interviewer, I would like to try to find out what sorts of ideas that come to you when you think about people with mental health problems, like how might they communicate?
The question will help us a lot in knowing how to code because we are trying to interpret the responses.
Those are what we call codes.
And in some instances I like using either color codes or to think of the questions as containers.
Let me show you what I mean.
If you go to the original question and start marking questions with a certain color so as to know where they come from.
For example I can tag that question as red.
Then I can tag this other with green.
Then I can tag these other with blue and so on and so forth.
Let’s go and do the coding now and then tag those codes with that color.
Sometimes when you are coding it’s good to read the whole paragraph before you begin generating codes.
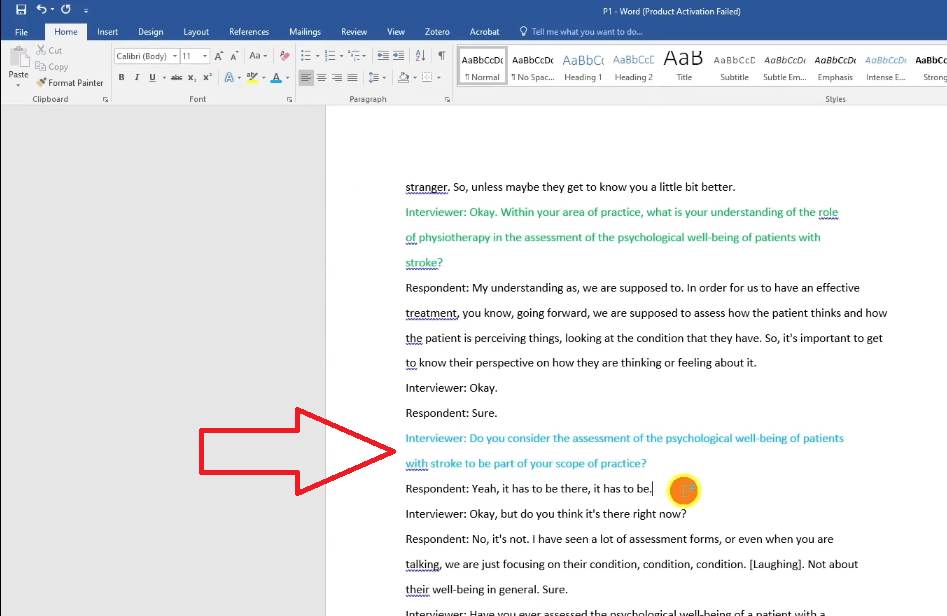
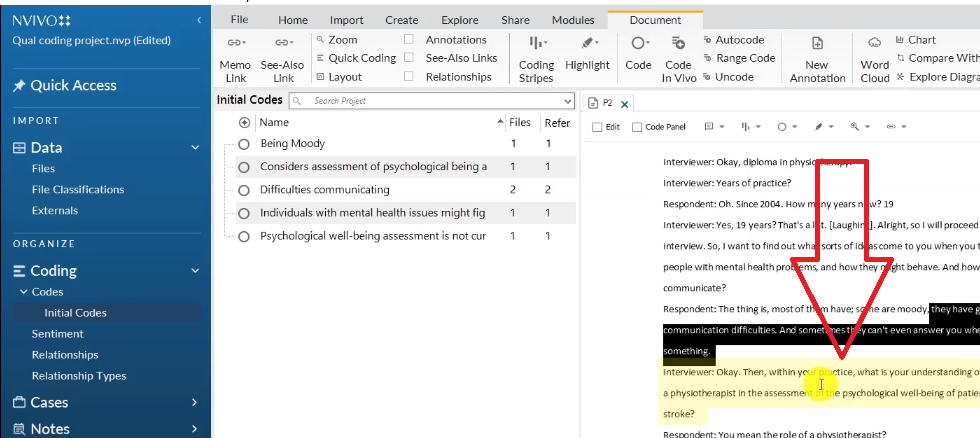
It’s difficult for people to maybe come out even if they’re experiencing they have mental health challenges others are not open they are closed and sometimes they may find it difficult to communicate with someone and with a stranger so unless maybe they get to know you a little better.
The question remember was What sorts of ideas come to you when you think about people with mental health problems, like how they might behave how they might communicate?
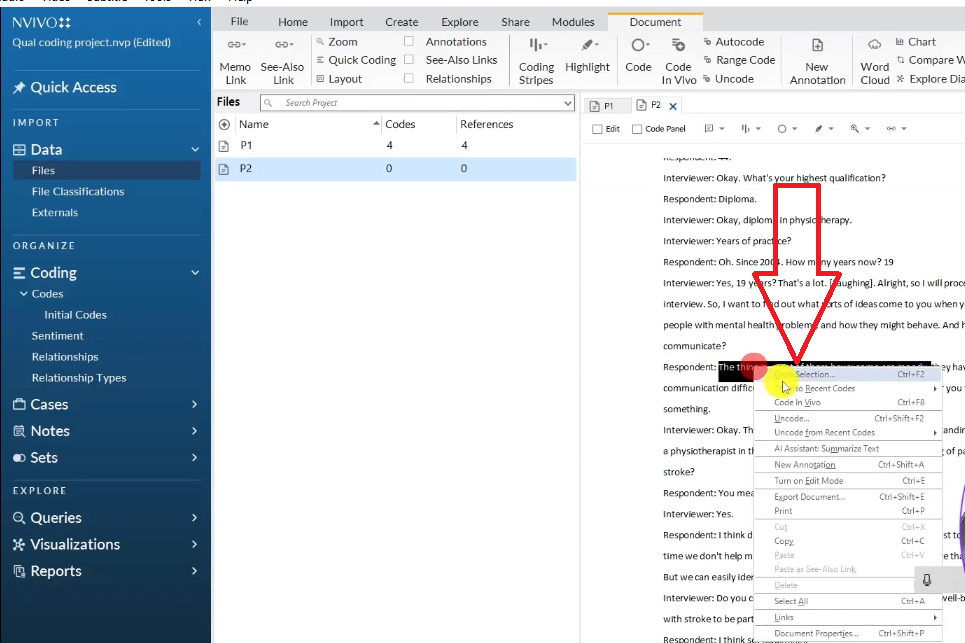
This response says that Patients might find it difficult to seek help when they have mental health issues highlight that.
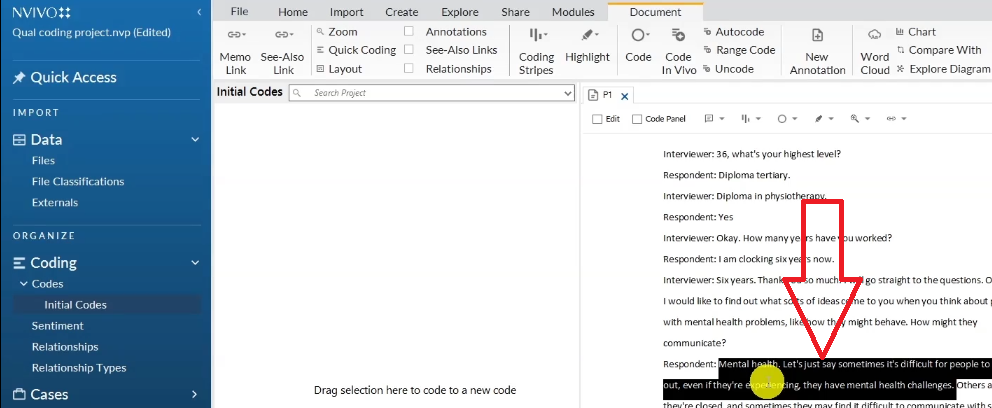
Right click select code selection.
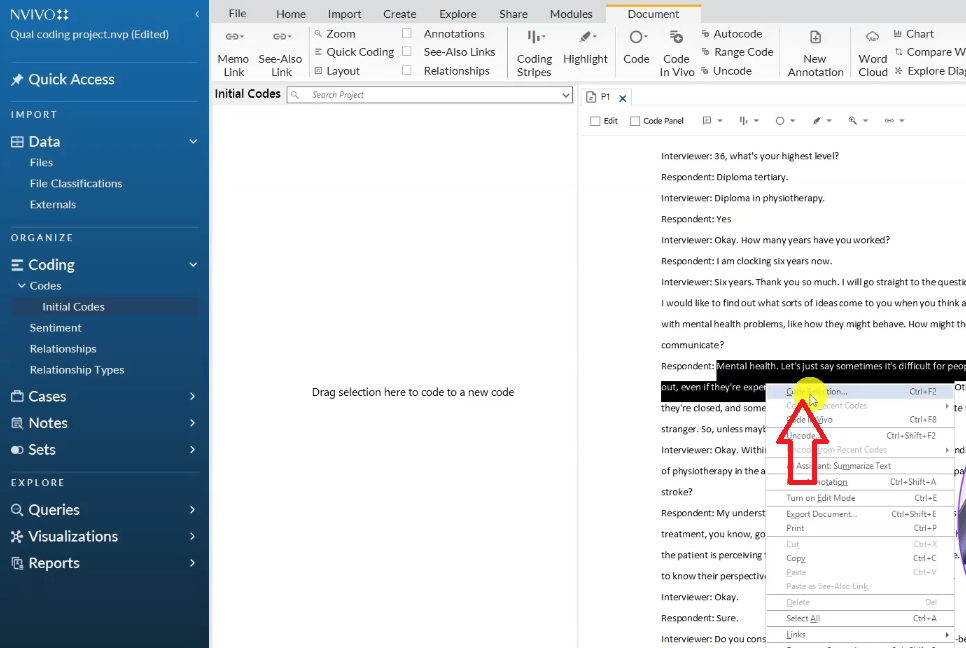
Go to initial codes then top level codes.
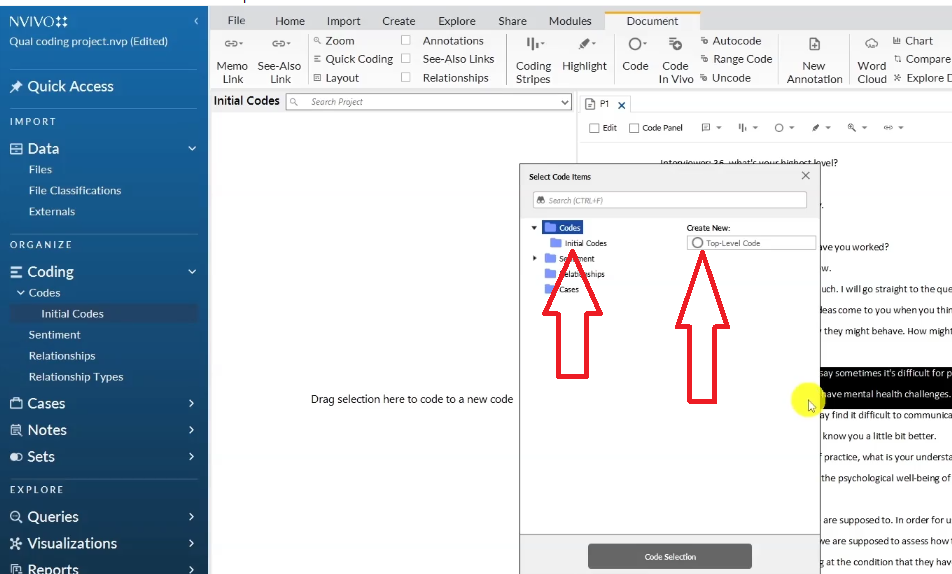
Then say individuals with mental health issues might find it difficult to seek for help.
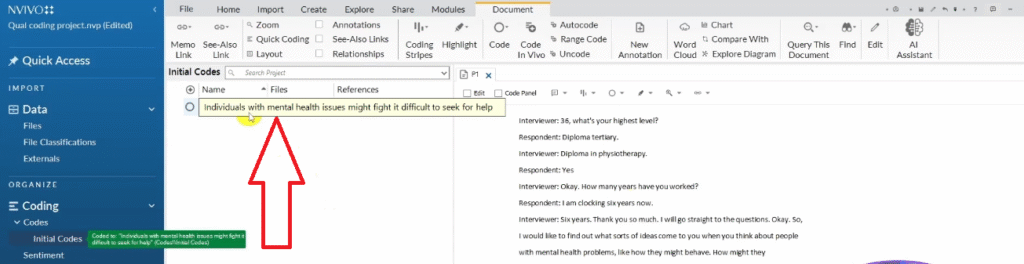
That’s my first code it is so long.
Sometimes codes can be long or they can be very concise.
But I don’t over obsess on making codes be concise at the first time because we can always come and revise them.
Then others are not open they are closed and sometimes they may find it difficult to communicate with someone.
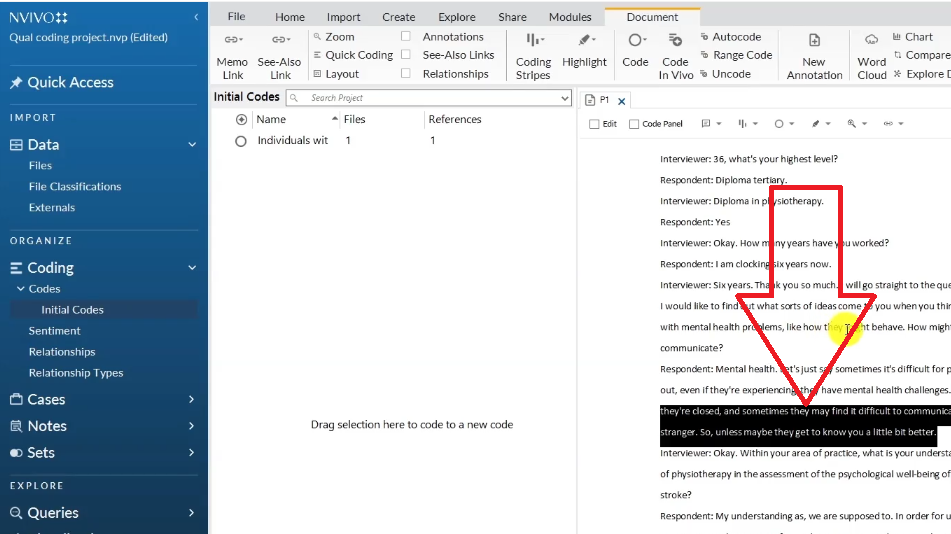
The question was how they might behave, how they might communicate.
So difficulties communicating.
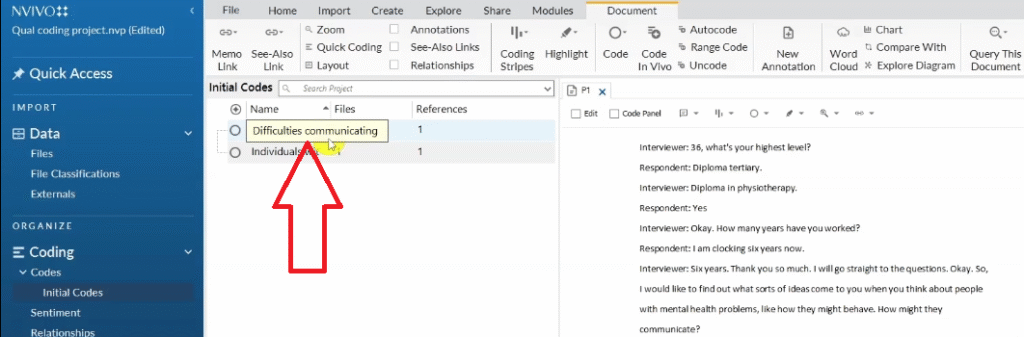
Because this person is simply saying people in mental health might find it difficult to communicate.
Remember to color code the codes.
I right click then go to color you can mark red.

And another one here you can see we mark it as red.
We want to know where they came from originally.
Let me go back to the transcript and get more quotes.
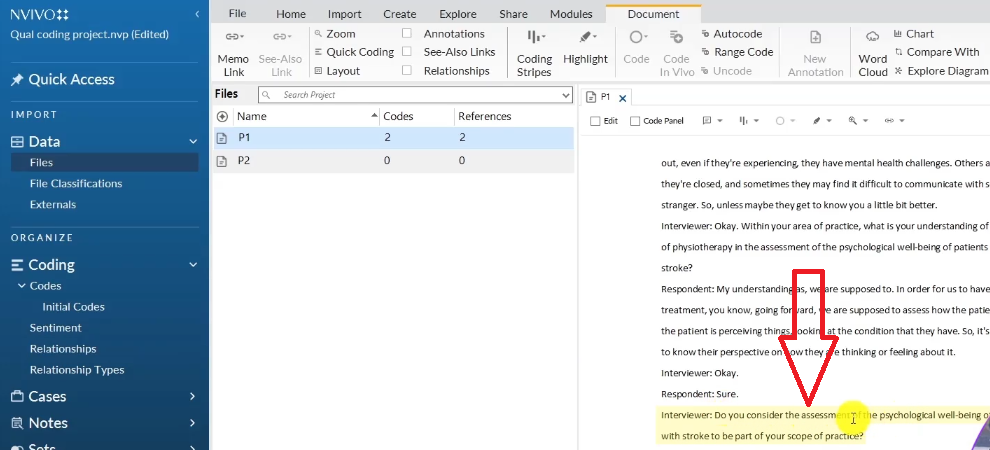
Do you consider the assessment of psychological well-being of patients with stroke to be part of your scope of practice?
Yes it has to be there it has to be.
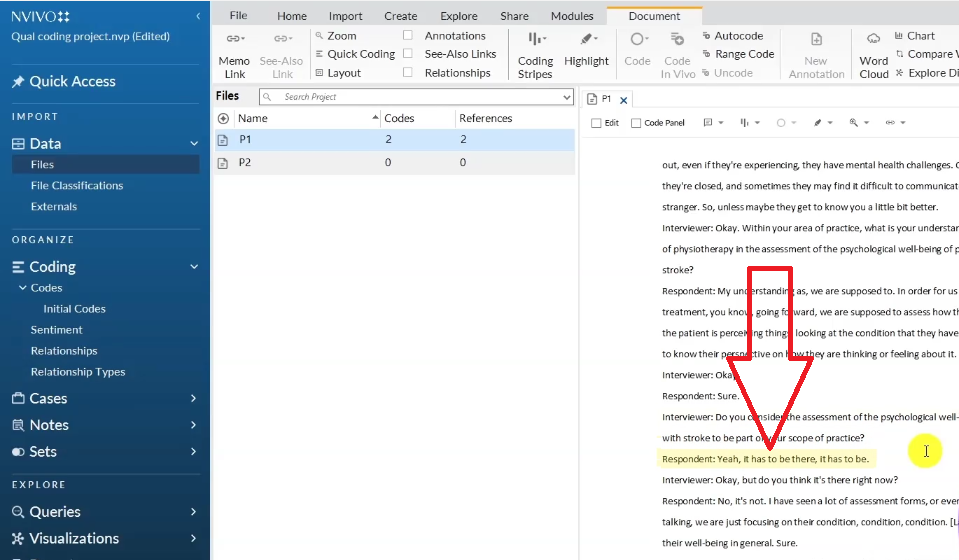
So this person considers the assessment of psychological wellbeing of patients with stroke to be part of their scope of practice let me code that.
Right click.
Go to code selection.
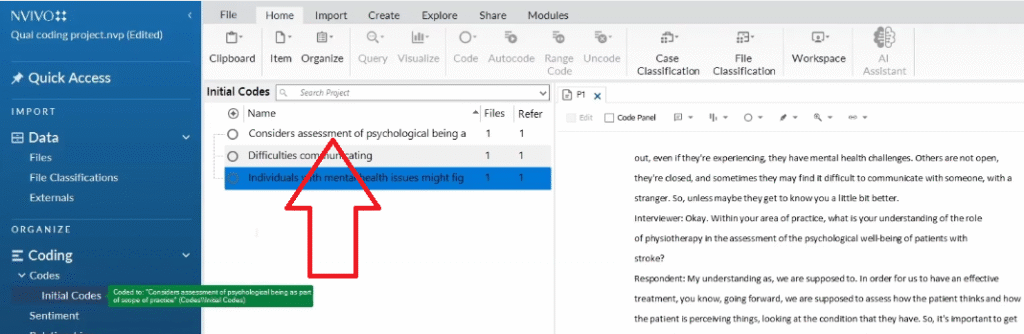
Then say considers assessment of psychological being as part of scope of practice.
That is another code for another question and probably if you remembermy original transcript the color for that is green.
But you do think it’s there right now.

Then this person says no it’s not I have seen a lot of assessment forms or even when you are talking we are just focusing on their condition, condition, condition, not about their well-being in general.
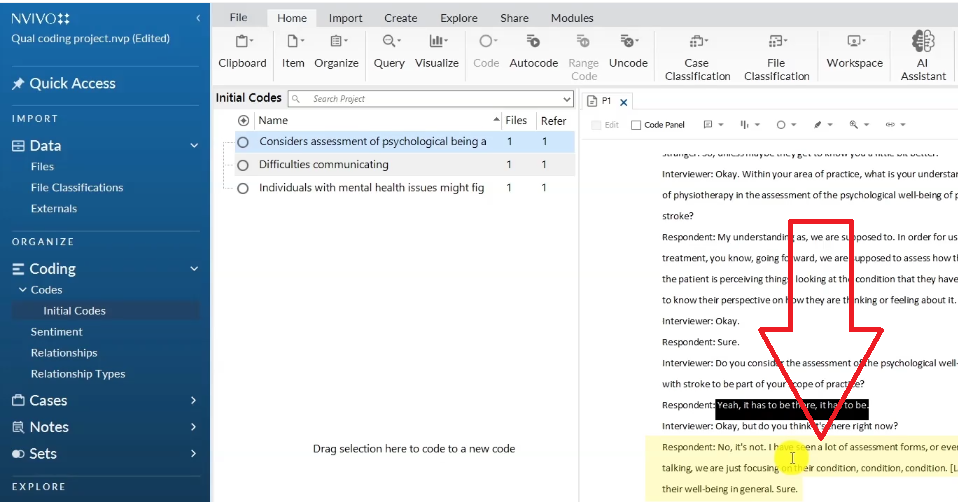
Let me code that section as psychological well-being assessment is not currently provided to stroke patients.

That’s what that person is saying that they have not seen stroke patients receiving any form of psychological wellbeing treatment currently.
And basically this is how we generate codes.
There are ways of remaining organized throughout the whole coding process which I have covered in other articles I’m going to link below but generally for this article we want to just get the codes.
That is for the first transcript, if I click on this highlight button and click on all coding you can see the areas I’m coding .
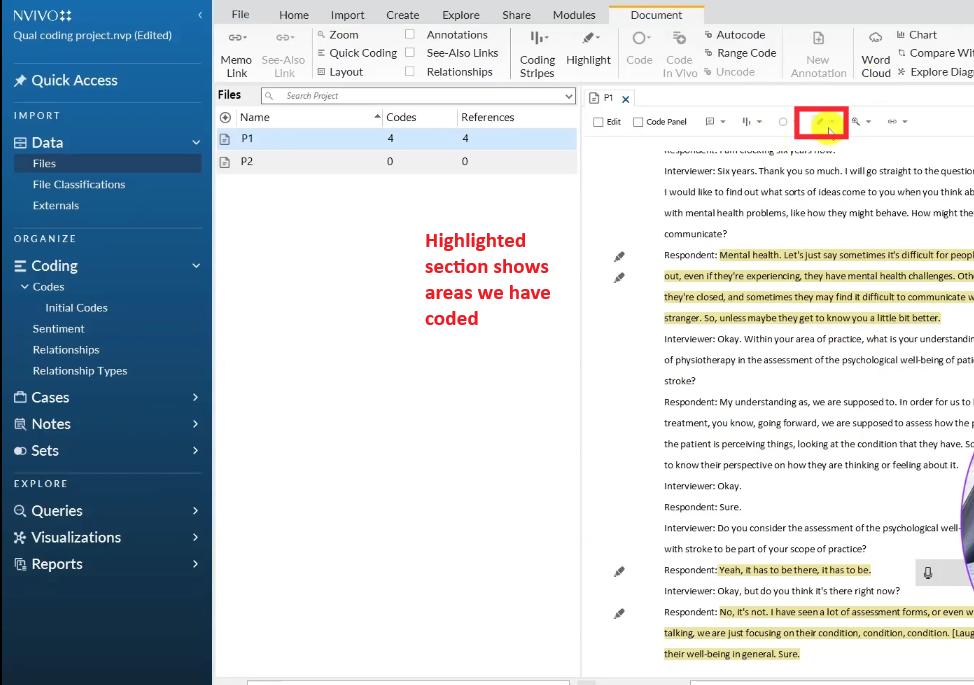
We only code sections that are important to our research objectives and we never code sections that we think are not being important to our research questions.
Basically that’s how we know what to code and what not code in these transcripts.
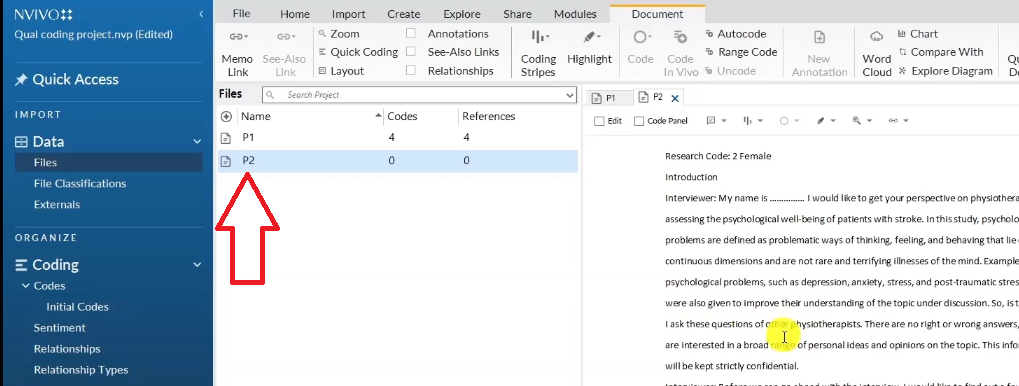
So if I click on the second participant and do the same coding for the first section, I’ll proceed with the interview.
I want to find out what sorts of ideas come to you when you think about people with mental health problems, how they might behave and how they might communicate.
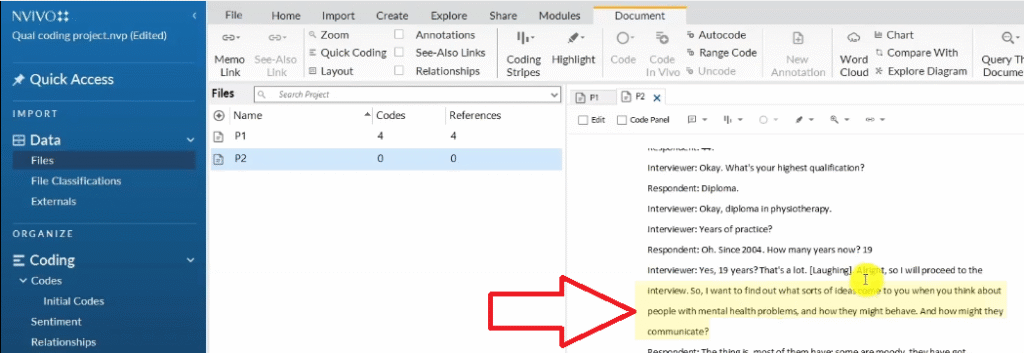
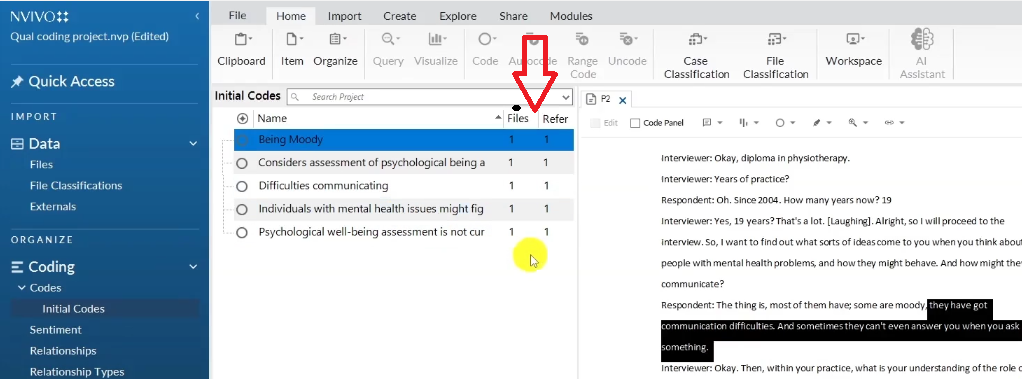
The thing is most of them have some are moody, they have got communication difficulties and some can’t even answer you when you ask something.
So being moody is one code.
We highlight, we got to initial codes, top level codes, Being moody.
So being moody is another code and then remember that’s related to the first question in the first transcript if you remember the color code for that is red.
I want to mark being moody as red.

Why should we mark the codes like this?
Because we want to know where they came from later because we are going to combine the codes together to form themes.
Let’s keep going.
They have got communication difficulties.

Remember we had a code from the other transcript where the person talked about difficulties in communication.

This is why we use N-Vivo to conduct coding.
So when we have quotes from two different participants that talk about the same thing, we simply highlight drag and drop the quote inside the code.
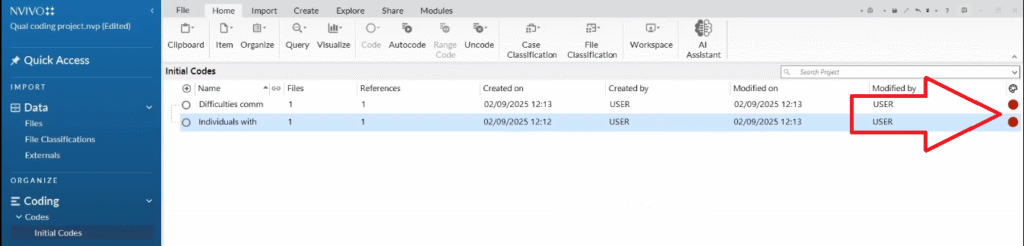
See the numbers are one file and one reference.
So drag and drop the quote to the code and the numbers will change to two files and two references.
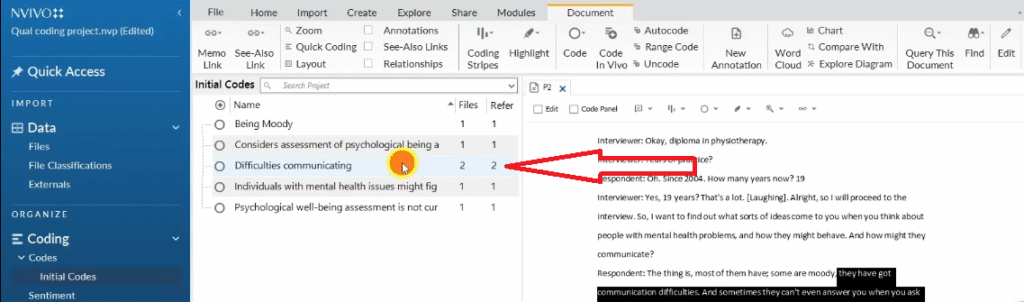
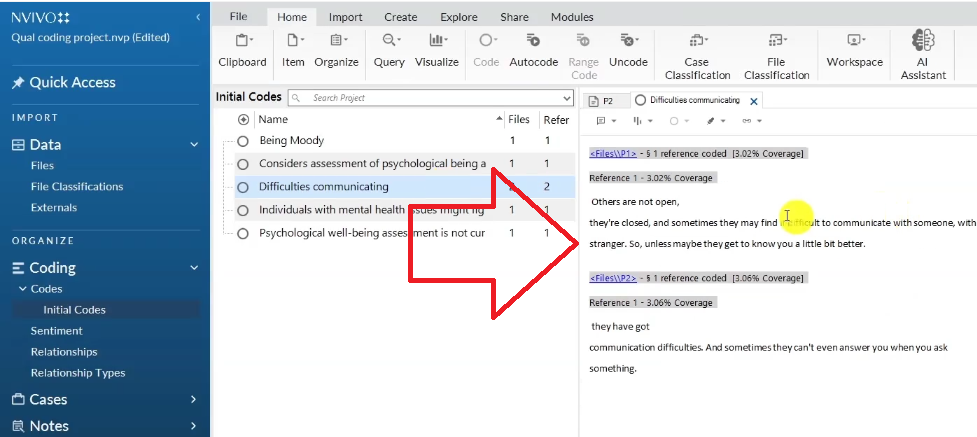
If you double click on this, you will see that there are two quotes that are interpreted through the same code and that explains why we have two files and two references.
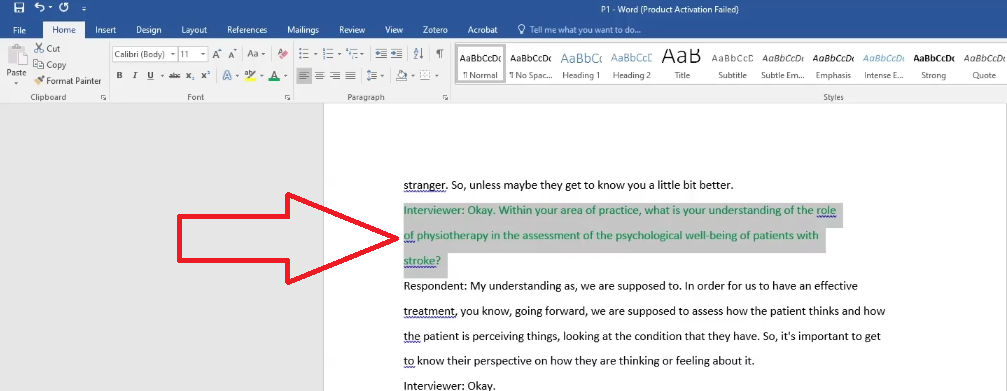
Then within your practice what is your understanding of the role of physiotherapies in assessment of psychological well-being of patients in stroke?
You mean the role of physiotherapist?
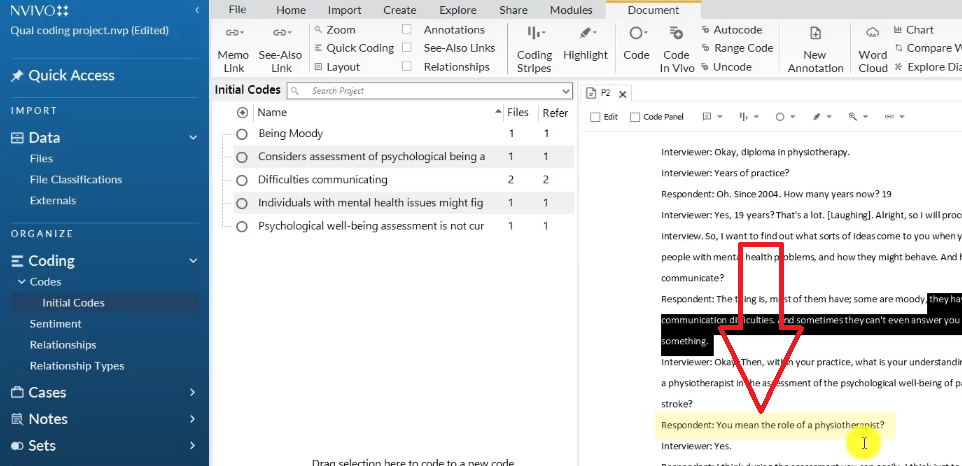
I think during assessment you can easily just to identify most of the time we don’t help much counseling patients just we don’t have the knowledge yet, but we can easily identify that the patient’s needs psychological evaluation .
So this person is saying the physiotherapy can assess whether stroke patients need psychological evaluation.
Let me code that directly.
Physiotherapists can determine whether stroke patients need psychological evaluation.

That’s another code generally that’s how we code.
As we are coding you can see the files and the references are being tabulated by N-Vivo.
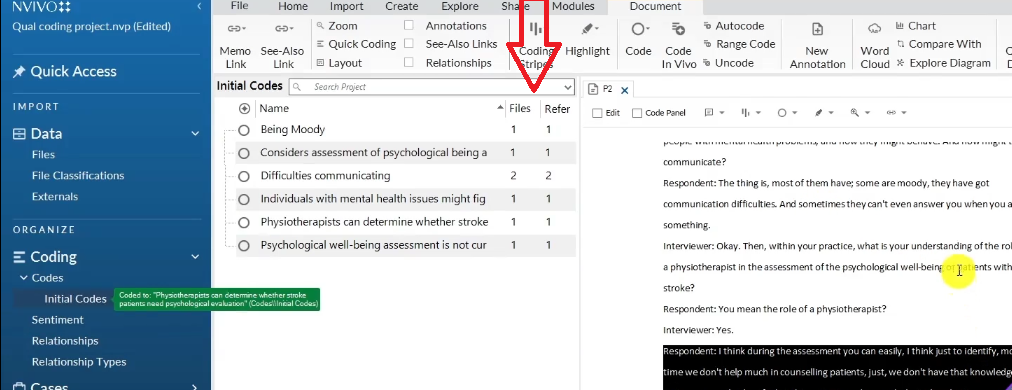
That means N-Vivo tracks down everything we are coding and also captures the quotes.
So these are the quotes that we will use to support our findings report.
Another thing is if you look at these two participants you can see N-Vivo is also counting the codes.
If we could have done the whole transcript probably we could have 50 codes.
But in this article I just wanted to introduce you to coding and give you some tips.
The main thing that we should consider when we are coding is to have an objective mind and to only code sections that are important to our research objectives and to make sure that our codes are interpretive.
We are not summarizing, we are coding, we are tagging information with concise labels we have to combine the labels later which are referred to as codes based on shared meaning to form themes.
Basically that’s how qualitative coding is done.
remember that we code transcript by transcript, once you start going transcript by transcript, you start getting more codes.
We do not code just a section.
This is how we can perform qualitative coding using N-Vivo.
How to get Themes in Qualitative Data Analysis
Introduction
In my past articles, I explained how to perform qualitative coding either through the use of Microsoft Word or through the use of qualitative data analysis software such as Nvivo.
After coding, we need to move to getting themes.
If you look at the Braun and Clark six step framework for thematic analysis, getting themes is the third step which comes after familiarizing the data and generating initial codes.

Description of Themes
How to get themes after qualitative coding
Let’s see how we can get themes after doing the initial coding.
For this article, I’m going to use an example of a study, teachers challenge in executing alternatives to corporal punishment in secondary schools.
Previously I analysed transcripts related to this data and I came up with some codes.
And now based on the interview questions, if I open them, these are the interview questions that are being asked in the transcripts.

Interview Questions
I went in and started coding and the codes; I tagged the codes with different colours based on the original questions they came from.
If a code came from question number one, for instance, it was red, question number two, it was blue, question number three, it was purple and so on and so forth.

Colour Coded Codes
I tagged these codes in different colours to just have a way of looking at codes together so that we can generate themes as I’m going to show you.
Back on this project, you can see the initial codes after analysing the files.

Initial Codes Generated after Thematic Analysis
You can see the transcripts here in the file section. We have interview one and interview two.
Transcripts in the Files Section
These two are the ones I analysed to get initial codes.
If you read my previous article,Qualitative Coding in Nvivo you’ll see the process of coding.
And ideally, we are using the Braun and Clarke six step framework for thematic analysis. Let me show you the Braun and Clarke.

The Braun and Clarke Six Step Framework for Thematic Analysis
What we do first is we familiarize the data. Then we get initial codes as I’ve shown in my previous articles.
Now we are looking for themes.
This article is about looking for themes.
Again, let’s go to the codes, as I was coding, I was using colour codes to mark the codes that might be related.
The process of moving from codes to themes involves looking for a shared pattern of meaning among the codes.
So, the first thing that I’m going to do, I’m going to go to the code section in Nvivo and create a folder called preliminary themes.

The Preliminary Theme Folder is Created
And then, I’m going to copy all initial codes in the preliminary theme folder.
Now from this folder called preliminary themes, we are going to start looking at different codes to look for a pattern of shared meaning so that we can form our preliminary themes.
For instance, the codes in dark red represent a particular theme.

Codes Colour Coded Dark Red
The theme that comes up from the codes in red teacher’s view on the effectiveness of corporal punishment.
I’m going to scroll down, come to the blank space, right click, create new code and call this, now this is not a code as you’ll see later, teachers’ views on the effectiveness of corporal punishment and click okay.

The Theme Teachers’ View on the Effectiveness of Corporal Punishment is Created
This is a theme now.
So, what do I do? I drag all the codes related to teacher’s view on the effectiveness of corporal punishment. The codes that are related to the theme are in red.
Remember, we first look at the codes, look for a pattern of shared meaning, created this theme, and now we are going to drag the different codes about teacher’s views on the effectiveness of corporal punishment inside that preliminary theme.
If you check the theme teachers view on the effectiveness of corporal punishment you can see its codes.

The Theme Teachers’ View on the Effectiveness of Corporal Punishment with its Codes
Teacher’s views on the effectiveness of corporal punishment.
I can also add a full description of what this theme means, or what this theme represents based on the shared meaning of the different codes.
I can say that this theme represents the views of different teachers on how effective corporal punishment is in disciplining learners that’s the first preliminary theme.

The Description of Theme 1
Let’s look at another theme that comes out from all these codes.
Remember I had already tagged the codes with different colours based on the questions that these codes came from in the interview guide.
When I was coding, I was making sure, for instance, all codes from question one are blue in colour, as I previously explained. All codes from question two are purple, and so on and so forth.
For instance, here we have codes that came from the same question.
If you look at the codes with the colour code dark blue, they form a theme.

Codes Colour Coded Dark Blue
The theme is common cases of indiscipline in school, okay?
I can right click in the blank space and say common cases of indiscipline in school.

The Theme Common Cases of Indiscipline in School
And I can write a description for this.
This theme represents the different cases of indiscipline in school. That teachers encounter in school. Okay.

The Description of Theme 2
Remember for every theme you have to put a description.
After I create the theme, I then go and drag all the codes with the dark blue colour code into the theme.
And that’s how we form the second theme.
Let’s look at another theme that we can see it’s more prominent.
If you look at the two codes colour coded light blue, they form the theme causes of learners’ indiscipline.

Codes Colour Coded Light Blue
I can right click, and call these causes of indiscipline among learners.

The Theme Causes of Indiscipline among Learners is Created
We can add a description these are the different causes of indiscipline according to teachers.

The Description of Theme 3
Let’s look at some other kind of theme.
If you look at the codes in purple.

Codes Colour Coded Purple
They form the theme; strategies teachers use to discipline learners in schools.

The Theme Strategies Teachers use to Discipline Learners in Schools is Created
The theme description is these are the different strategies that teachers use to discipline learners in public schools.

The Description of Theme 4
We drag and drop the code in purple to the theme strategies that teachers use to discipline learners in public schools.
And you see, we have another theme there.
Those are some ways to come up with themes.
There are other codes with a brown colour.

Code Colour Coded Brown
If you look at the codes, they form the theme stakeholders involved in disciplining learners.

The Theme Stakeholders Involved in Disciplining Learners is Created
The theme description is these are the different stakeholders who are involved in disciplining learners in public schools. Click OK.

The Description of Theme 5
I will then drag and drop all the codes in brown to the theme stakeholders involved in disciplining learners.
I have shown you examples of how to develop themes and we have five themes.

The Five Themes
And that’s basically how you get themes by looking at your initial codes, look for a pattern of shared meaning, then combining the codes with shared meaning together.
We can always come and get sub themes in some instances, but this is how we get themes directly from initial codes.
We combine them based on shared meaning to get final themes.
How to Report Findings after Performing Data Analysis with N-Vivo
Introduction
You’ve reached a point where you’ve analysed your data, for instance, through the use of the Braun and Clarke six step framework for thematic analysis.

The Braun and Clarke Six Step Framework
You have followed through all these steps, and now you have something like this in your work.

Themes Formed after Thematic Analysis
You have themes.
So how do we get all this information out of Nvivo to findings report that is a written document like this.

A Findings Report
Now, the first thing that you have to do when reporting your findings after conducting qualitative data analysis is to highlight the steps that you use to analyse the data.
This is called the data analysis process, the first section of the report.

The Data Analysis Process
The data analysis process will simply include describing the steps you took to analyse the data or to go from raw data to having themes.
In most of the instances where I’m using the inductive approach to thematic analysis, I will describe the six steps of thematic analysis as prescribed by Braun and Clarke.
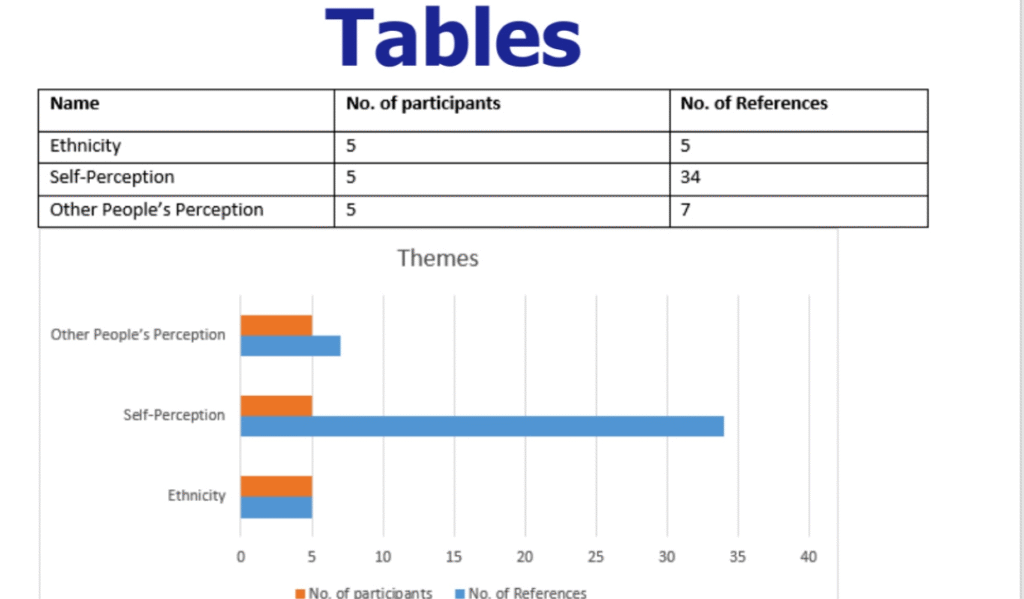
The findings report also contains some tables like this.

Tables in a Findings Report
Where do we get all these?
Exporting Data from N-Vivo
After we finish analysing our data in Nvivo, and we get our themes, we can press Control A on our data, go to export and export list.
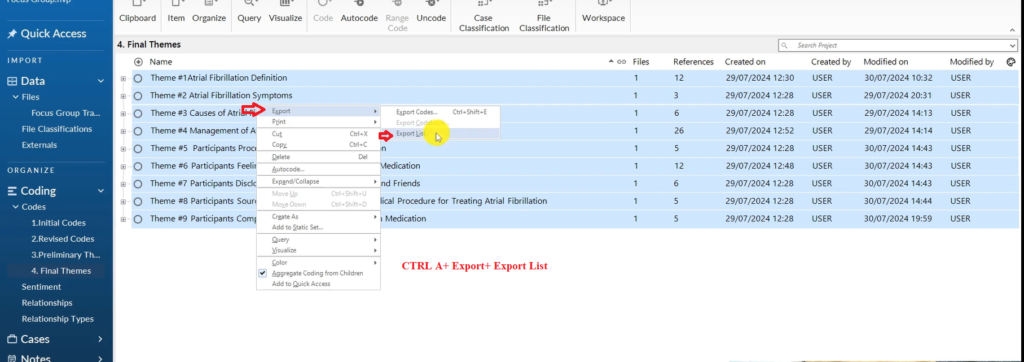
The Process of Exporting the Code List in Nvivo
What this does is, it gives us a list of final themes.

The List of Final Themes
And then, I can go to my complete Nvivo, and go to share, export, export codebook, and I can export a codebook here.

The Process of Exporting the Codebook
This is the code book.

A Codebook
The codebook contains the theme and their definitions. It also contains the subthemes and their definition and the codes.
Basically, those are some tables of our coding structure that we can extract in Nvivo, so that we can use those tables in the first section of our data analysis report where we explain our data analysis process.
Process of Reporting Findings
After we explain our data analysis process, we start discussing the findings.
To discuss the findings, you just need to explain what themes and subthemes mean.
For example, for the first theme, will discuss it as shown below.

A Discussion of a Theme
After explaining each theme, we then go and discuss the codes and provide the participants quotes. This are what the participant said as evidence to the codes.
The quotes are shown below and are usually in italics.

Participant Quotes
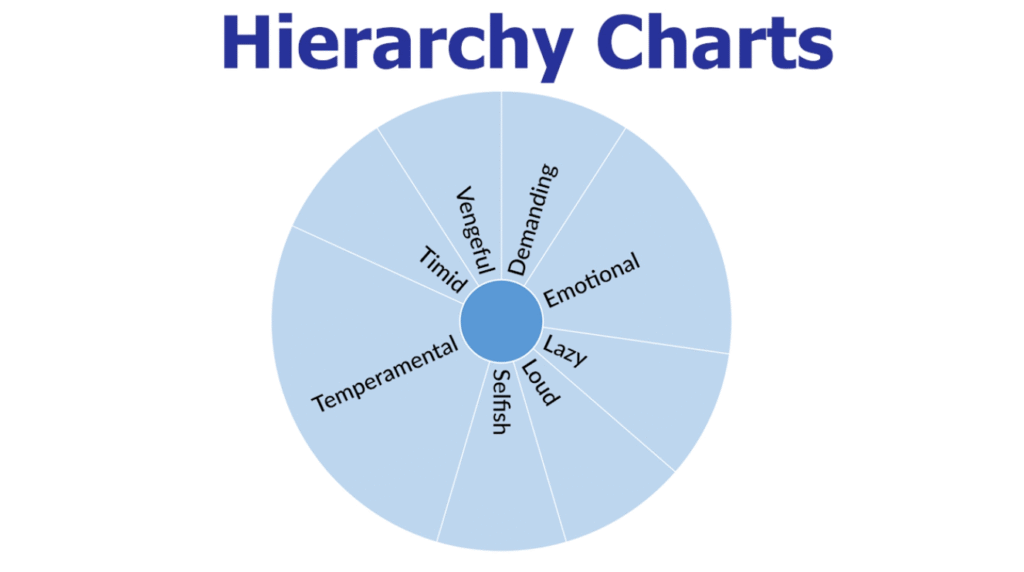
In findings report, we also have some visuals like this.

A Hierarchy Chart
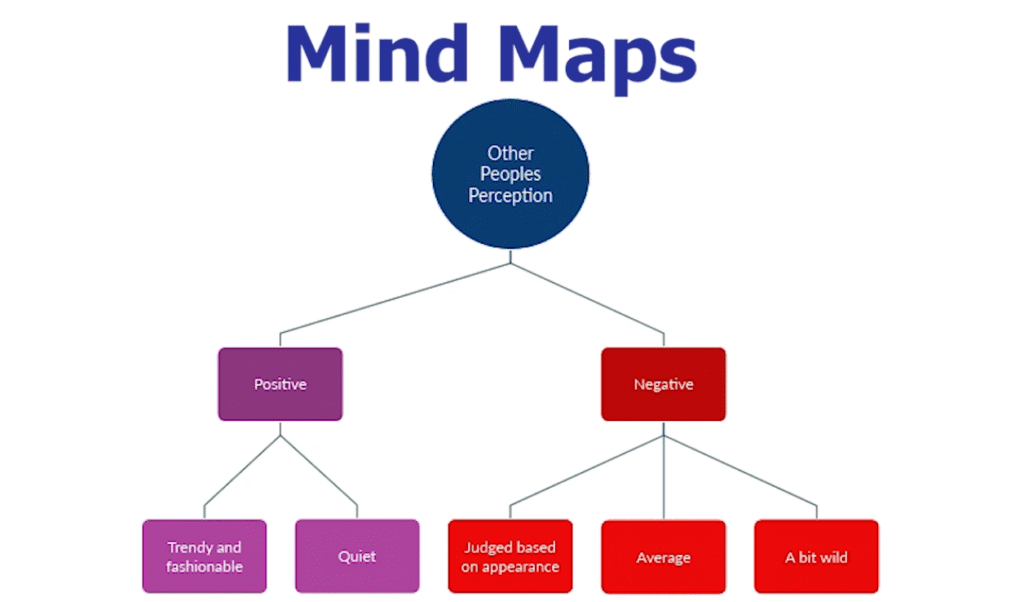
Then we also have another kind of visual, called a mind map.

A Mind Map
Those are the visuals you can include in the findings report.
And that’s how we write the findings report.
Creative ways To Visualize your Results in N-Vivo
Word Clouds
The first way that you can visualize your data in N-Vivo is through the use of word clouds.
Let us have an example.
I have my data here.
These are different interview transcripts that I had previously imported into N-Vivo , and I want to formulate a word cloud of what the participant in the interview said.
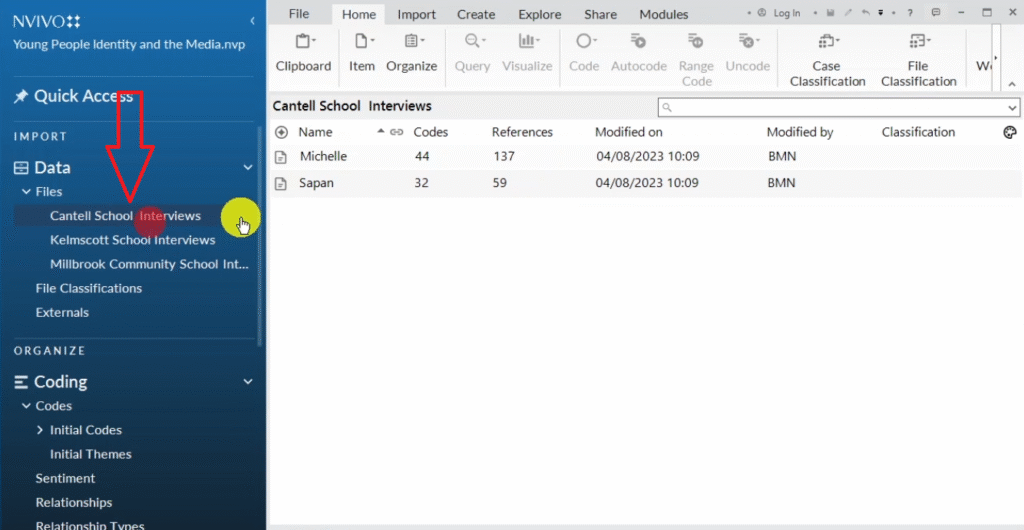
So we have Michelle here.
You can see in the interview I have “I” representing the interviewer and “M” representing Michelle.
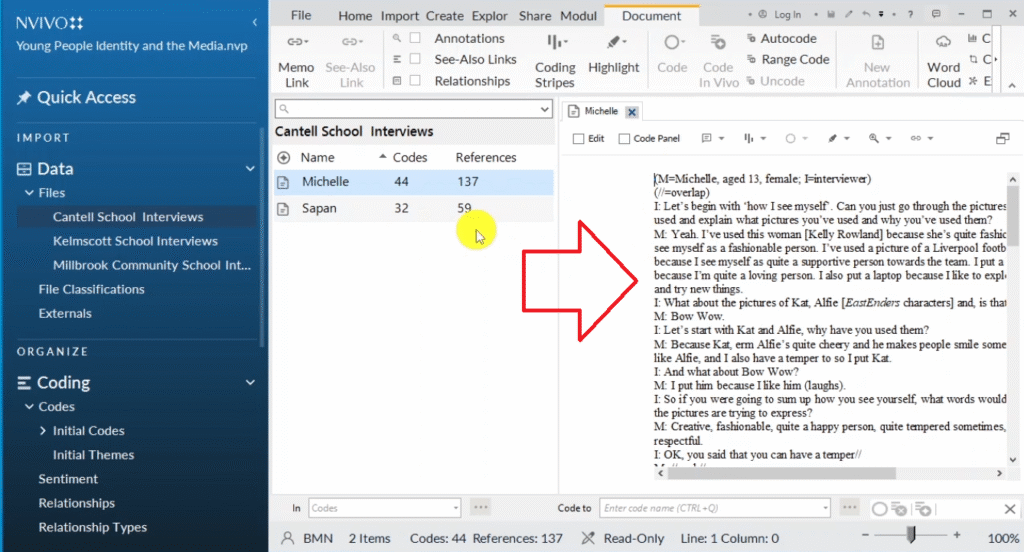
I want to visualize what Michelle says, or the prominent words, or the prominent themes or issues that emerge in Michelle’s interview transcript.
How do we develop a word cloud only for Michelle?
Let’s right-click on the transcript from Michelle.
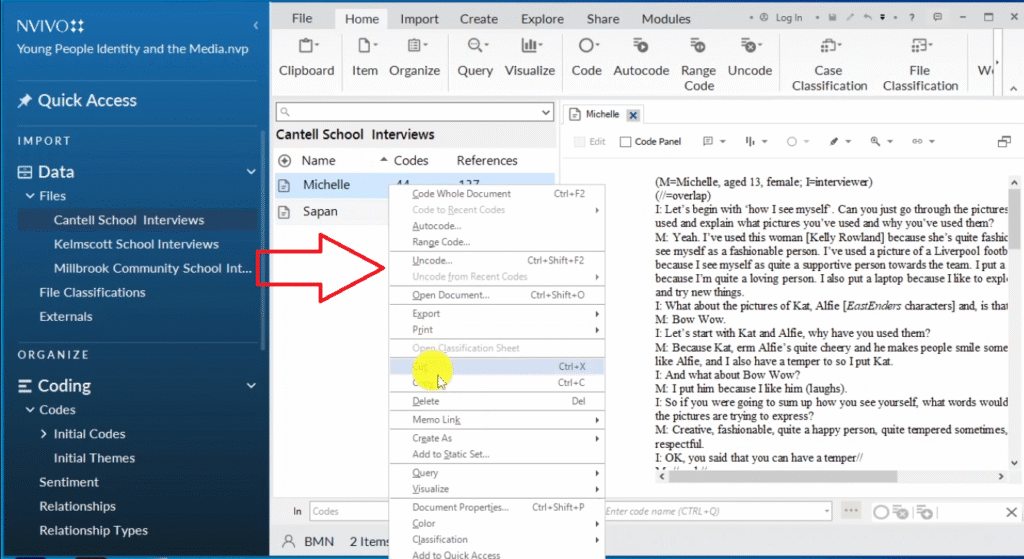
Remember, we are on data files.
I right- click and select auto code.
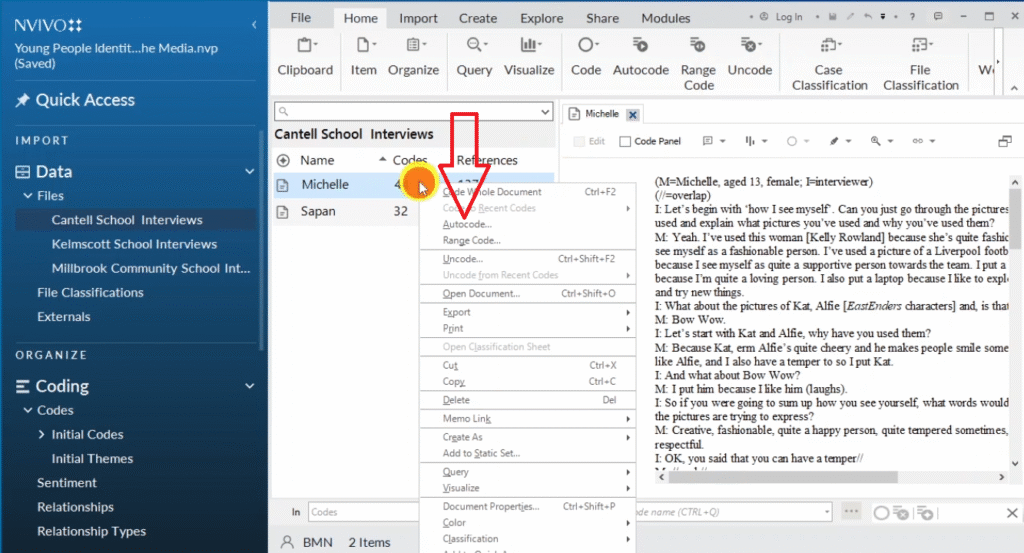
Now, N-Vivo will give me different option.
I will select speaker name.
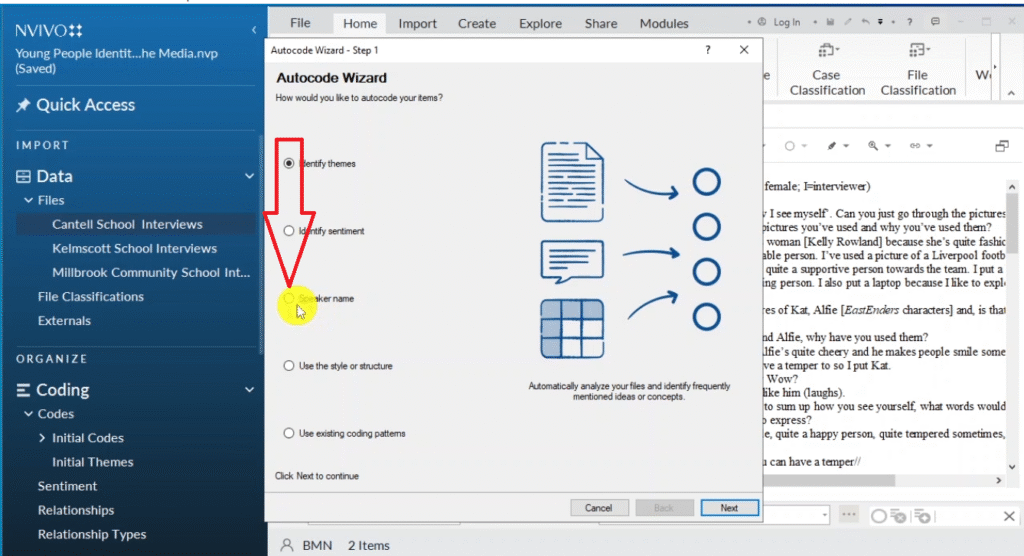
I want to identify the different speaker names in the interview transcript.
Then I click next.
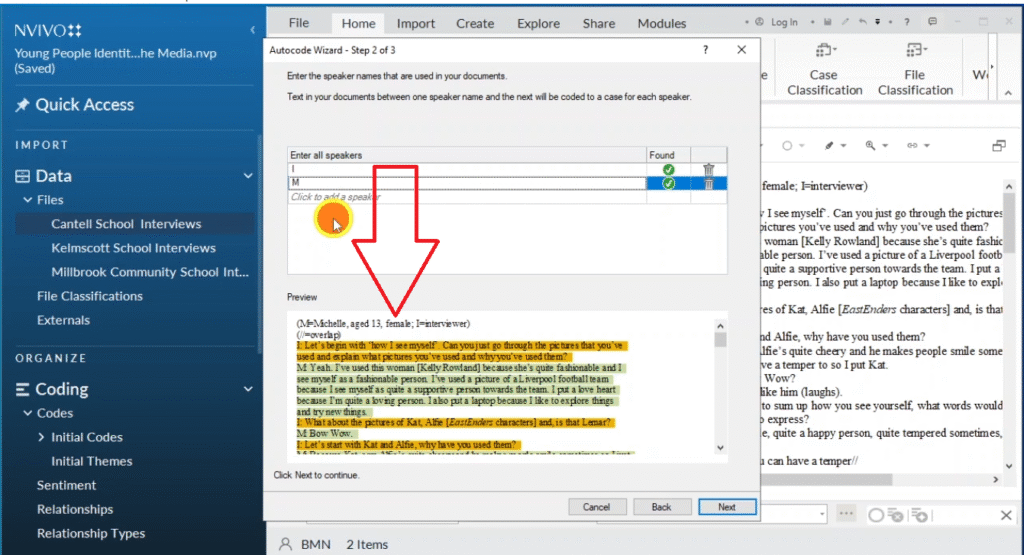
Now we already know we have I and M , so we insert the initials inside the box.
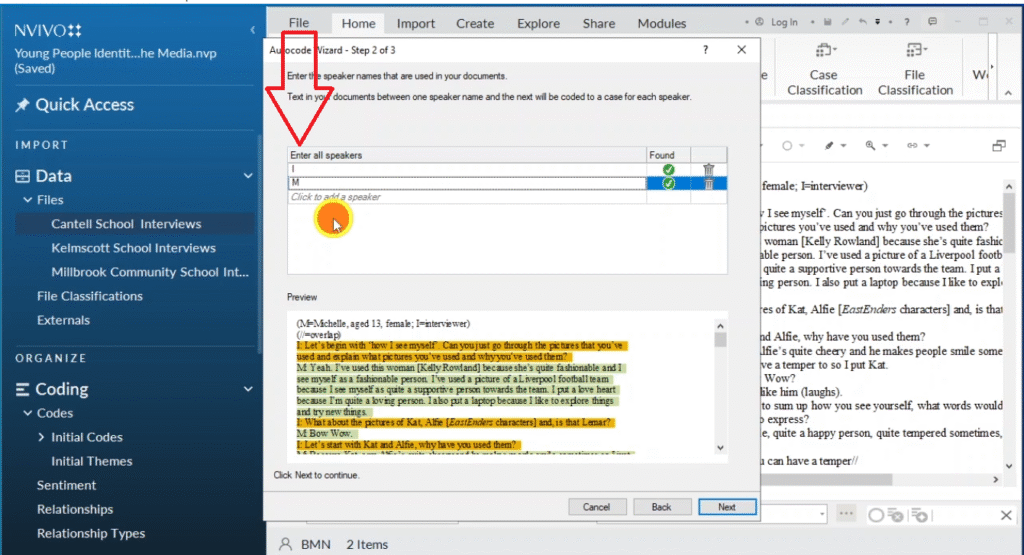
We want to see how N-Vivo identifies that.
You can see N-Vivo is able to identify “I”, which means the interviewer which is the questions and “M”, which means Michelle.
And then we click on next, and we want to create this as a new classification so that we do not get confused, and we call this Michelle input.
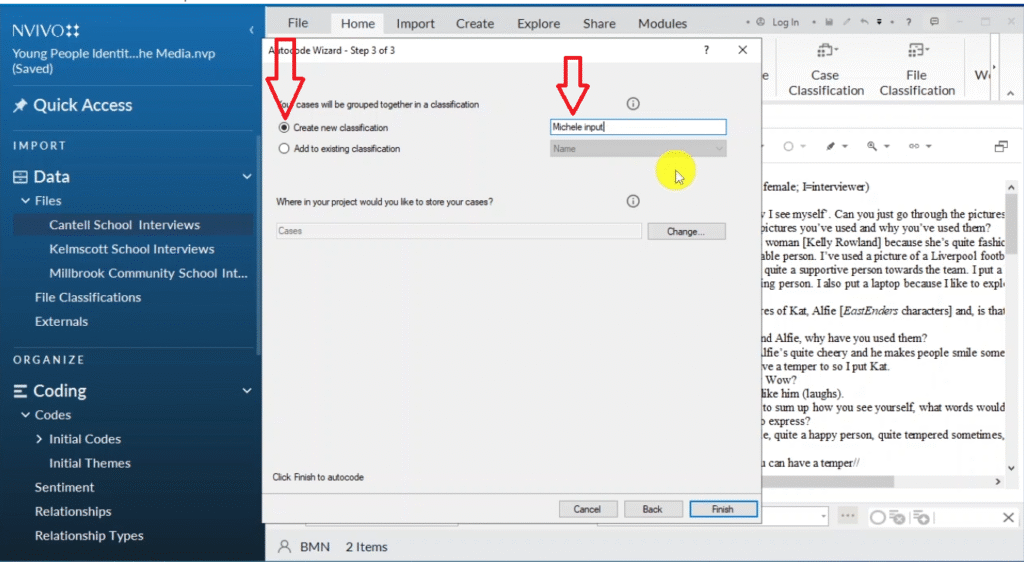
It’s just a word I’m creating and then finish and let’s see what will happen.
Now, if you scroll down on N-Vivo, on the menu, on the left side, you’ll see case classifications.

Then you’ll see Michelle input.
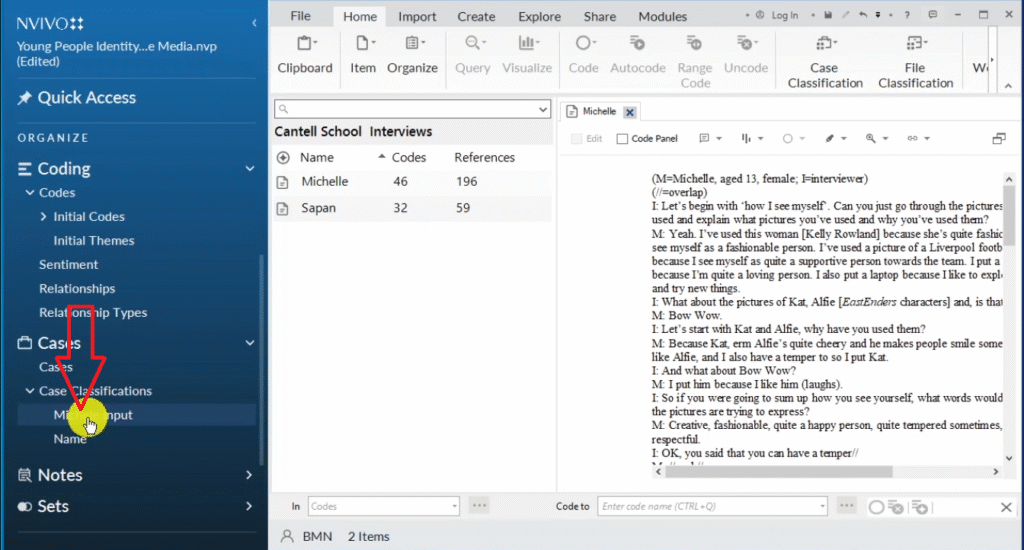
And now we have the case for Michelle, and we have the case for the interviewer.
Remember, we are trying to create a word cloud as a way to visualize or as a way to see the major issues that Michelle talked about in the interview.
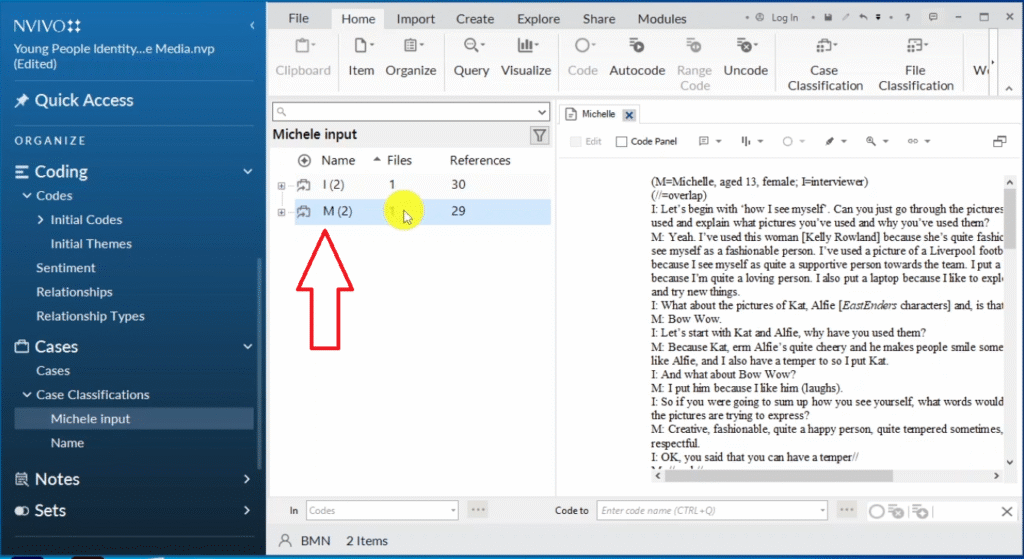
So after we come to the case classification, Michelle input, we right click on Michelle.
Then now we can come to visualize.
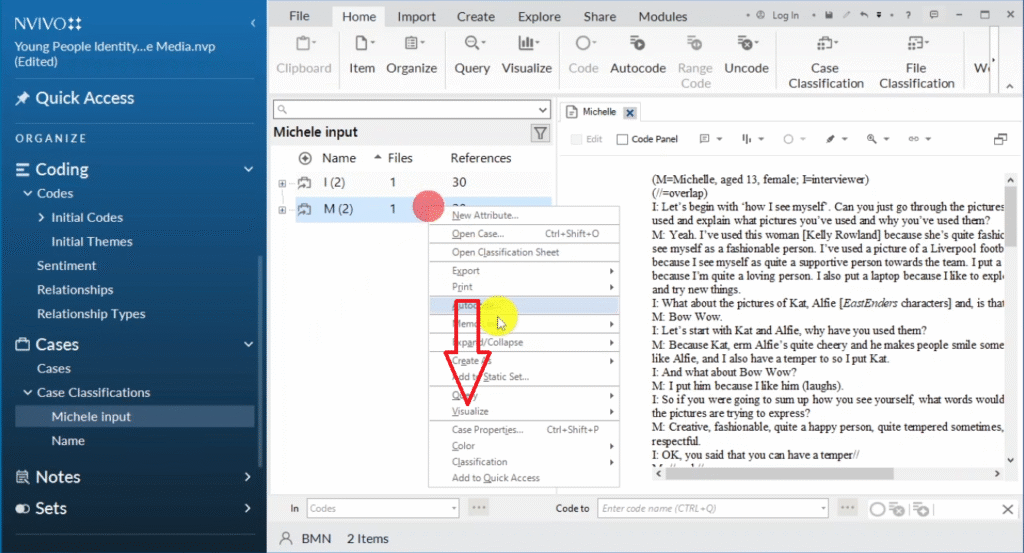
And we can click on Word cloud.
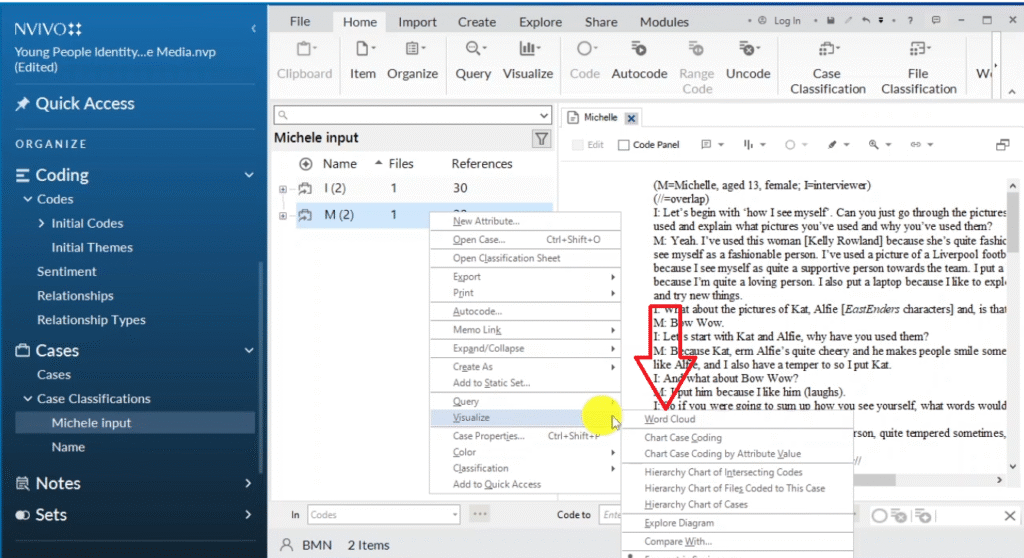
This means that we are going to consider the data for Michelle in developing the word cloud.
This is one of the ways that we develop a clean word cloud in N-Vivo 14.
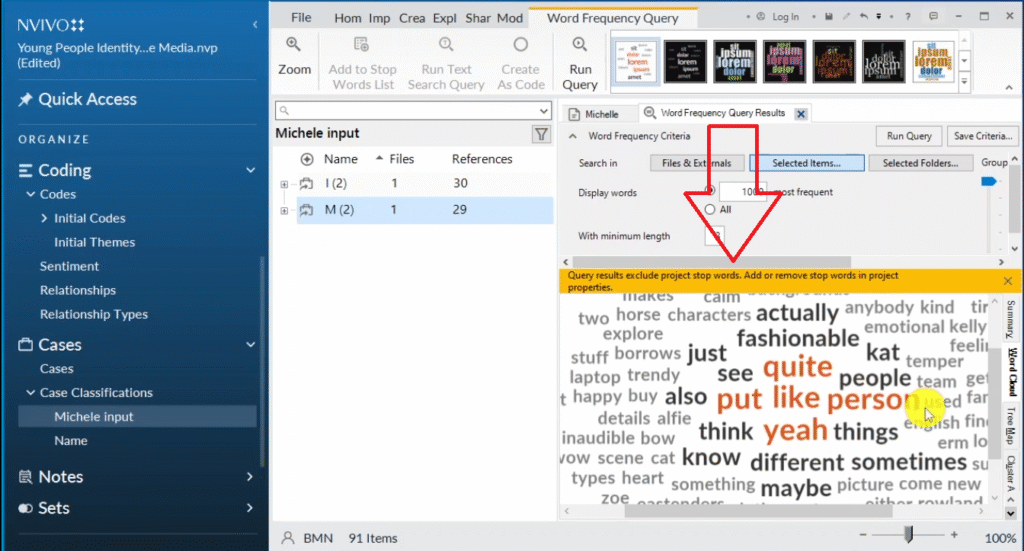
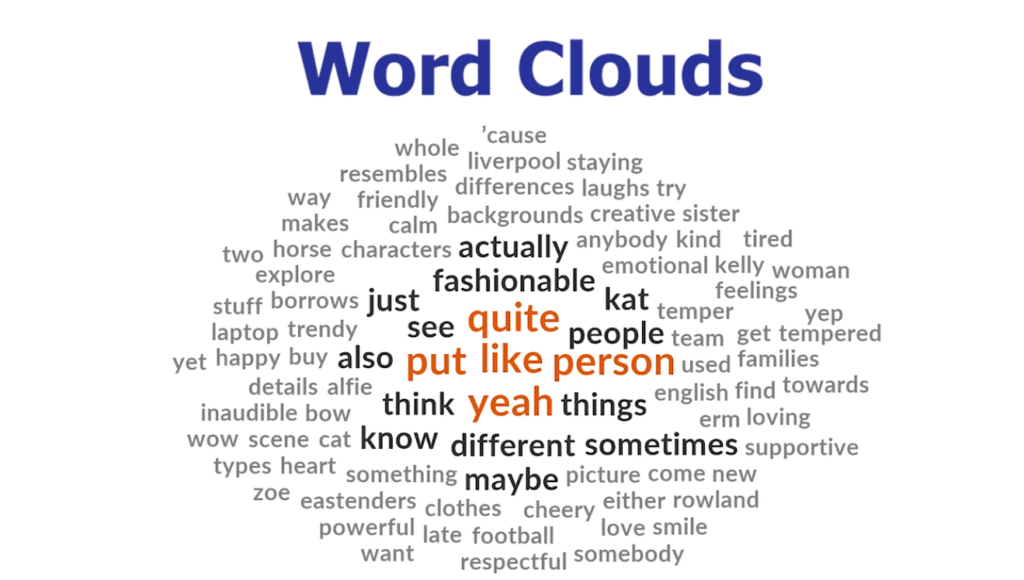
So these are all the words that Michelle said.
She talked about being fashionable, having temper, having feelings, being emotional, and all these thing.
Now we can save this by pressing Control+Shift+ E, and then we save this under Michelle.
This is the word cloud that we just exported.
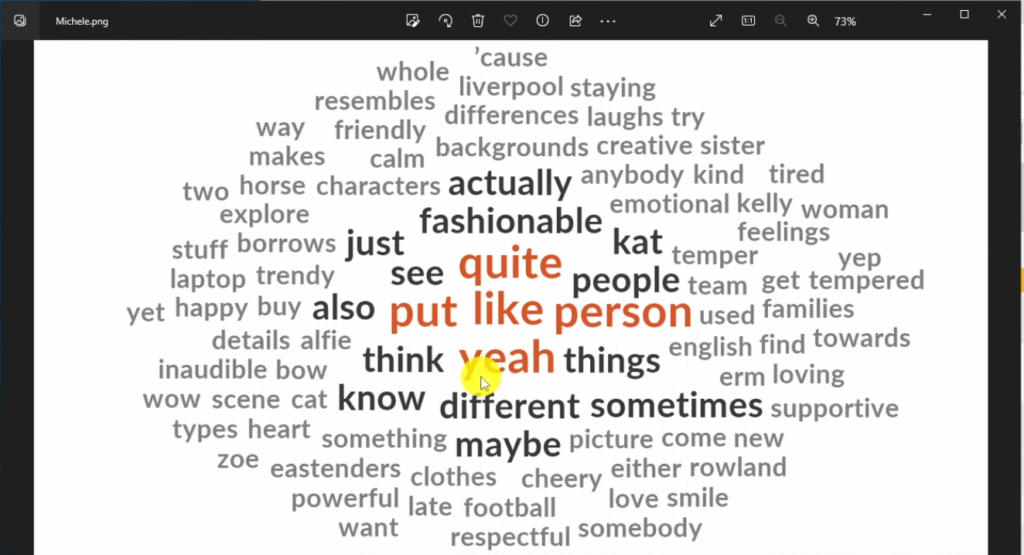
The word cloud is representing the main ideas that Michelle provided during the interview.
Regular Charts
Let’s look at the second way to visualize in N-Vivo, which is to use regular charts.
Now when you are conducting your study or you are doing the interviews, you will normally collect some form of demographic data such as the gender, age, and maybe the level of education of your participants and other important details that are relevant to your given study.
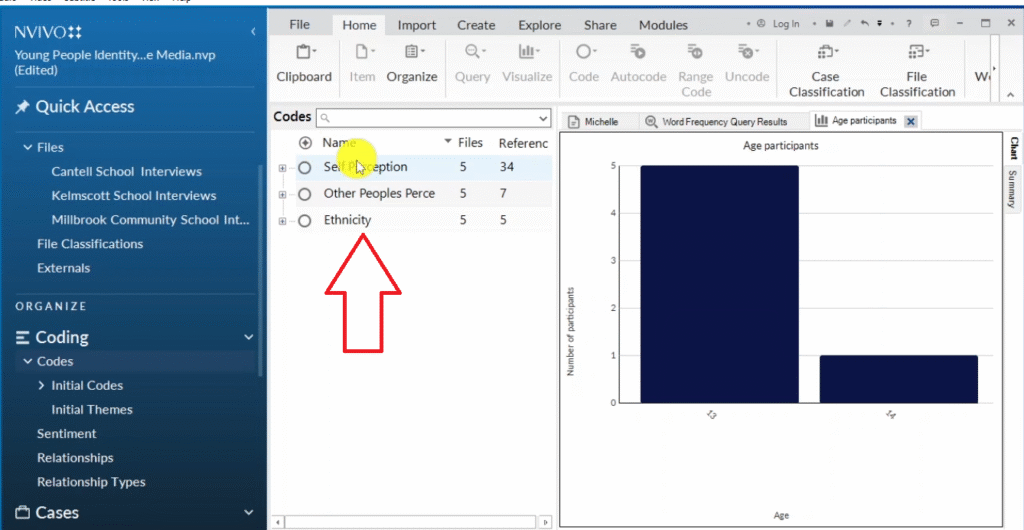
Now in this example, I have already imported the data, which normally is in my case classifications.
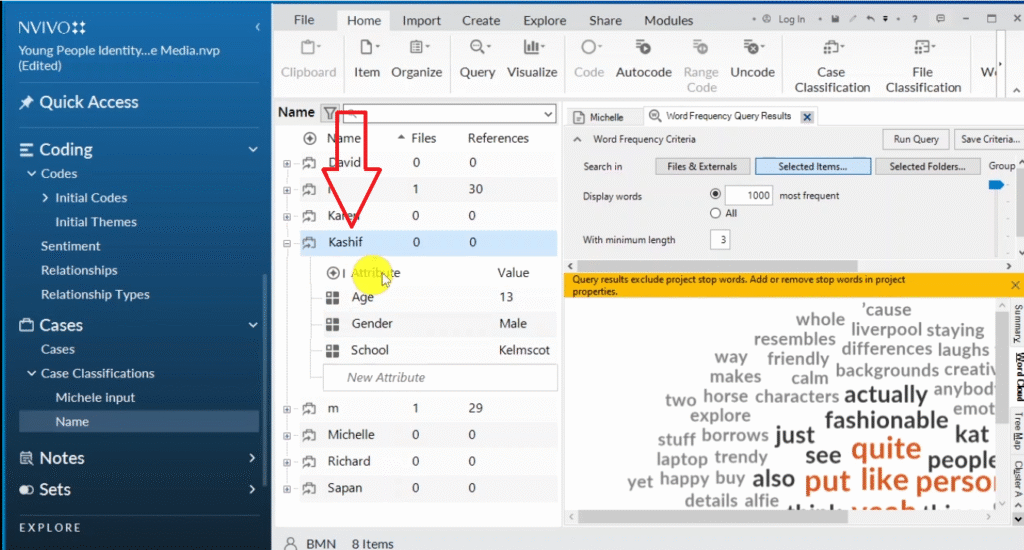
We can draw some regular charts using this data.
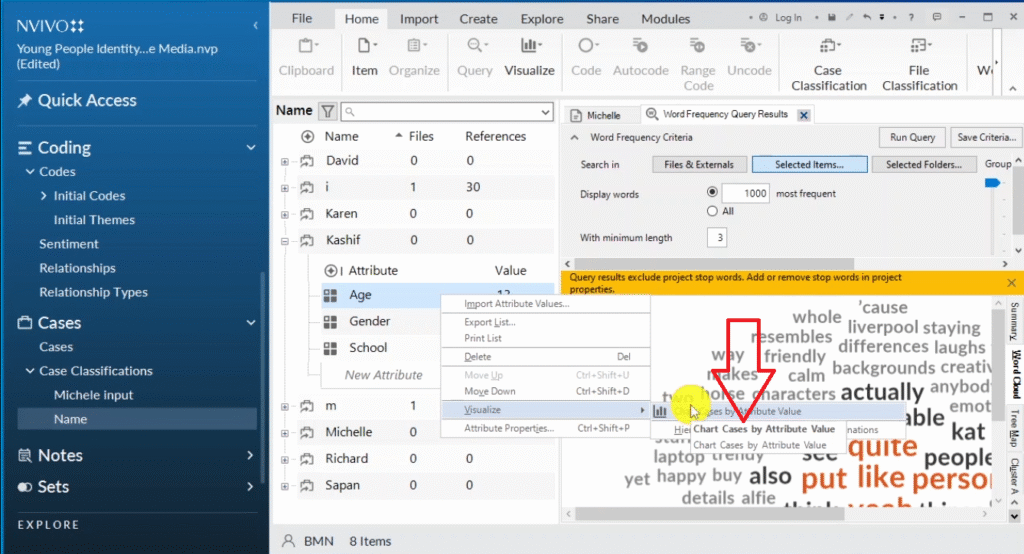
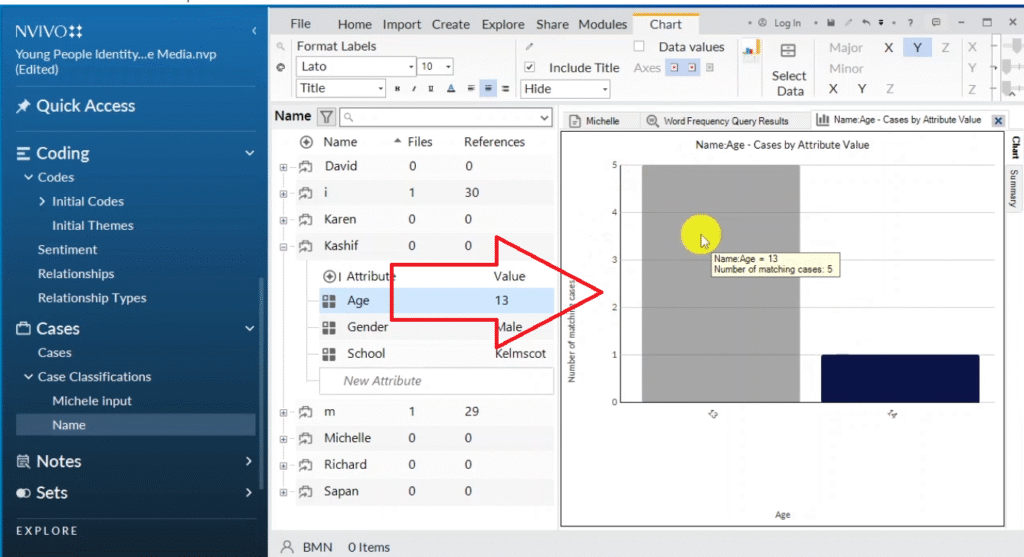
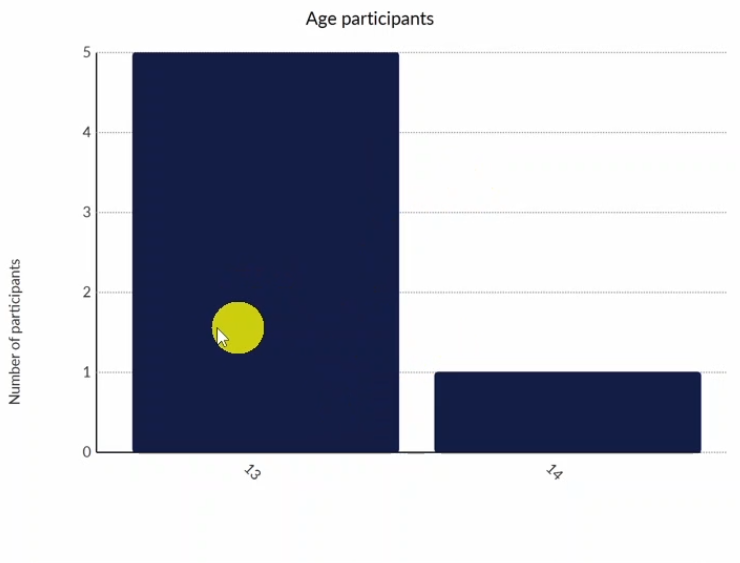
For example, we want to see the age of my participants. So we go to one of my participants and we right click and we click on visualize.
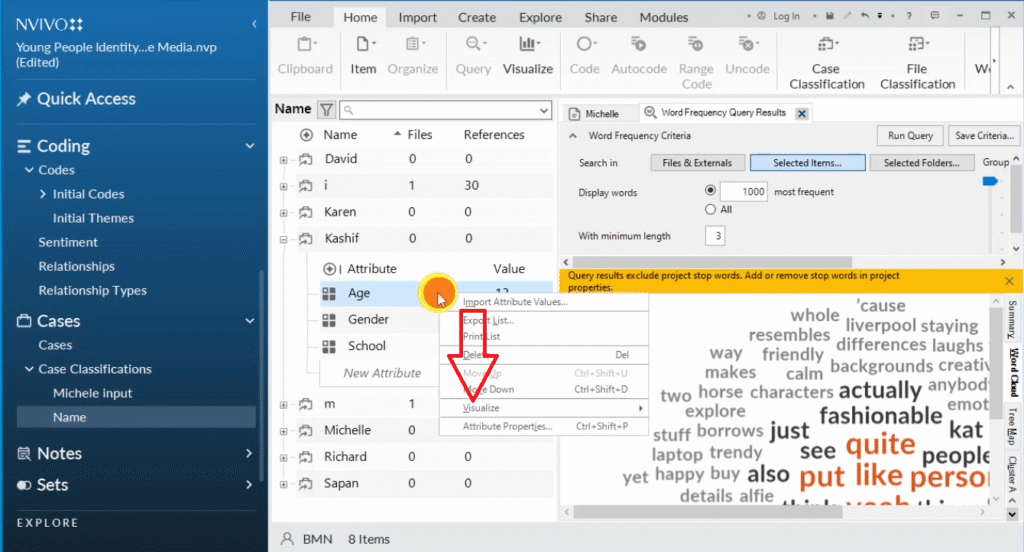
Then click chart cases by attribute value.
Now you can see here I have unassigned.

Not applicable.
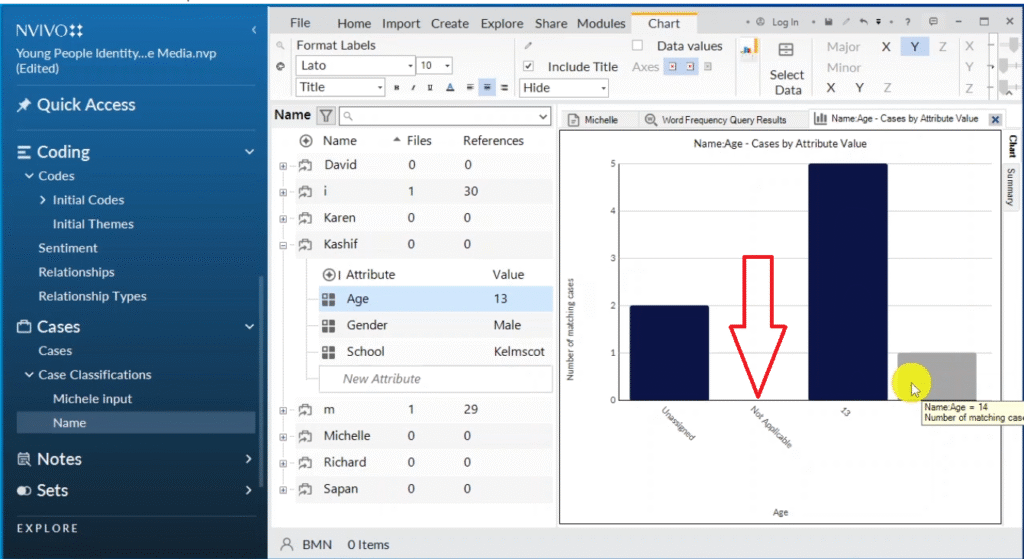
Then I have five of the participants were 13.
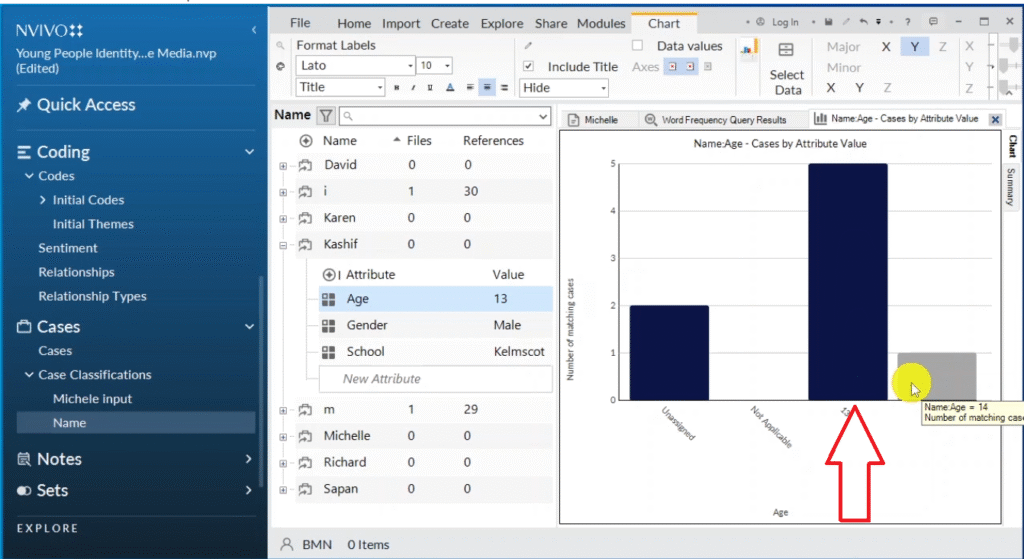
And one was 14.
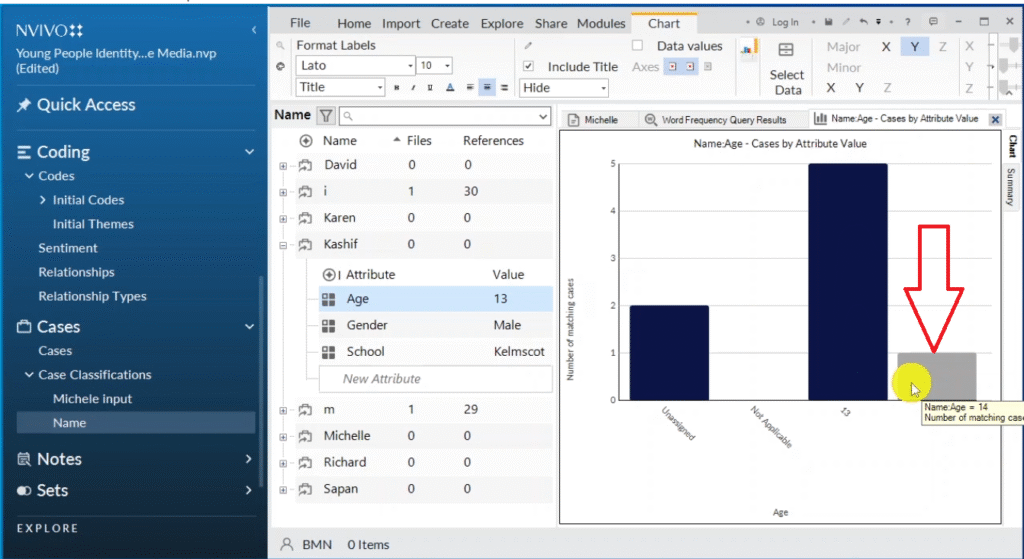
This unassigned means there is a participant that did not provide the details related to age.
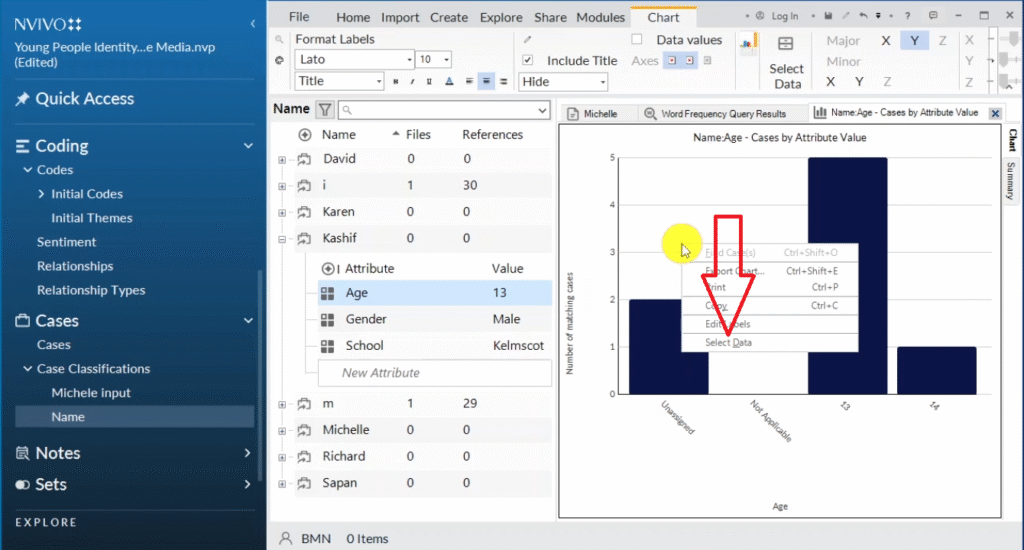
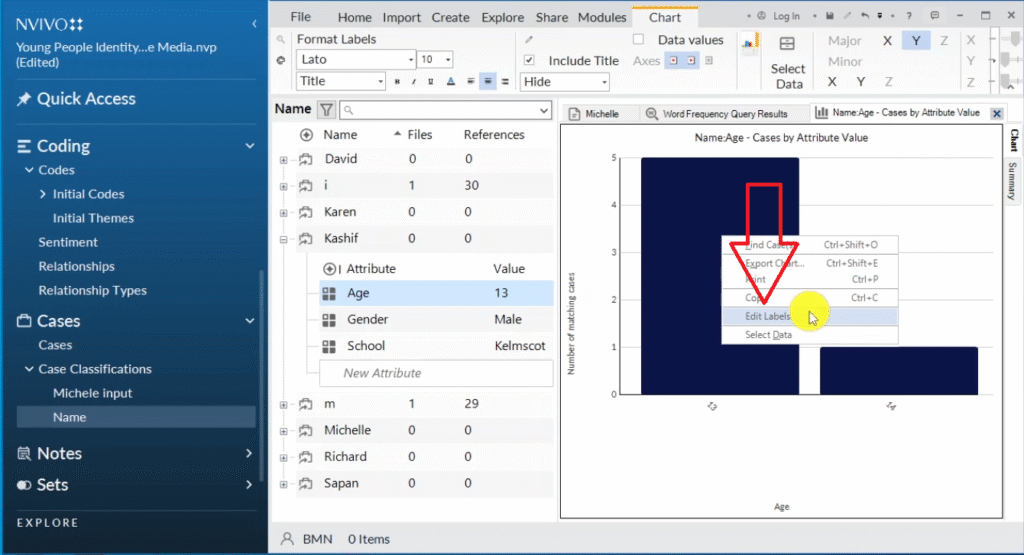
So what we do is we right click on the chart, we go to select data.
Then on the X-axis attribute, we go to attribute values and weclick on “all attributes except unassigned and not applicable“.
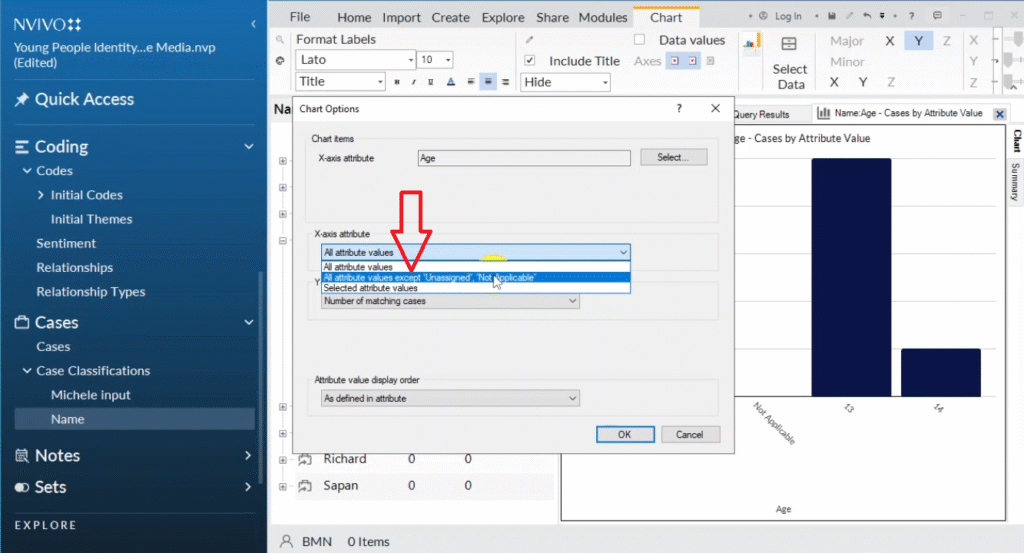
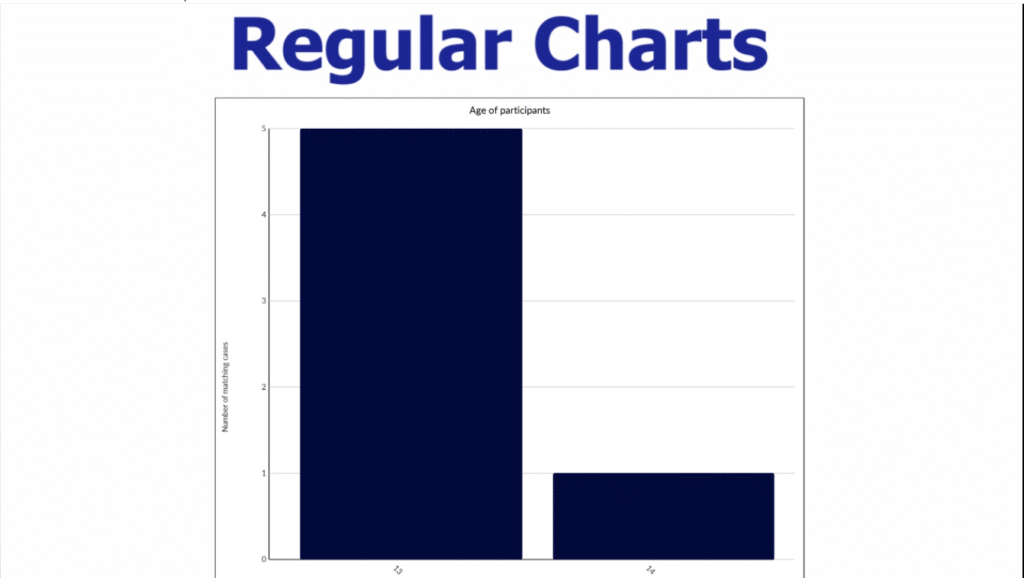
Then we click okay, from there we get a better chart.
From the chart we can see evidently that five of the participants were 10 years, while only one was 14.
We can also do some edits on the Y axis and on the X axis.
Let’s go to edit labels.
Instead of name, age, and all these details, we can rename it as age of participants.
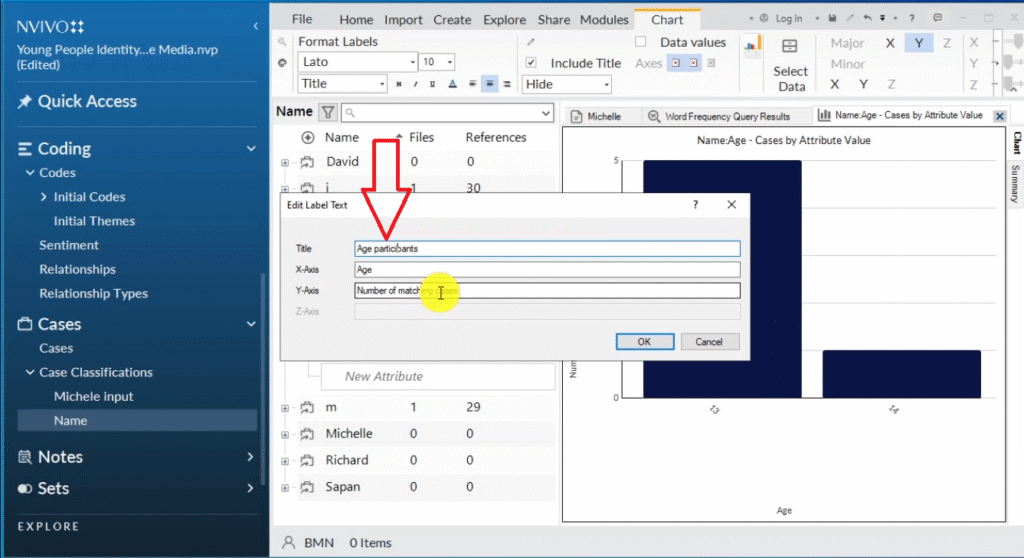
Then instead of number of matching cases, we can call this number of participants.
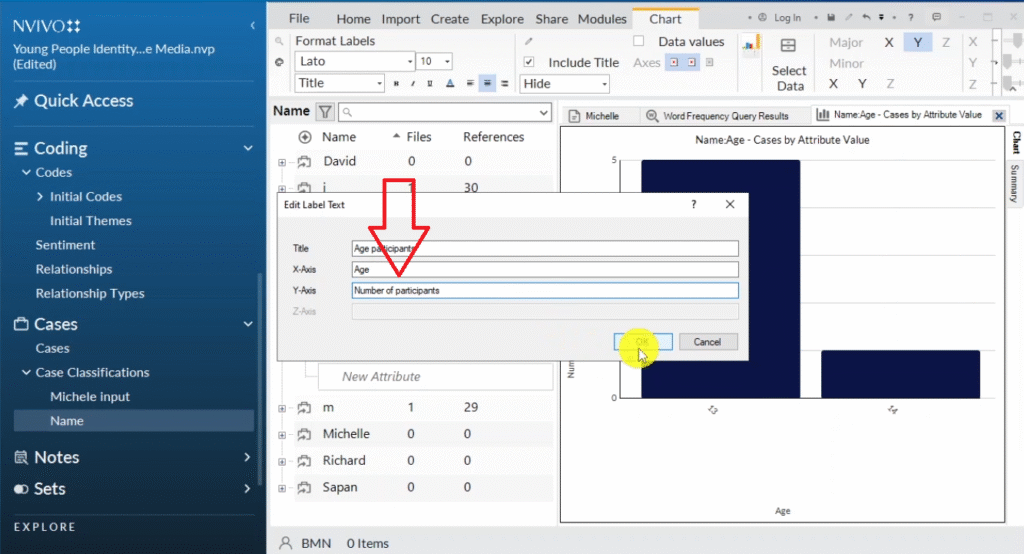
Then we can export this chart as age of participants by clicking Control+shift+E .
So we can see clearly that 5 participants were 13 years.
And only one was 14 years.
That’s a way of visualizing your demographic data in N-Vivo using regular chart.
Hierarchy Charts
The third way of visualizing data in N-Vivo is through the use of hierarchy chart.
I had already conducted reflexive thematic analysis on my data, and I have this three themes.
There is a way I could visualize my data in hierarchy.
For example, if I open the main theme of self-perception, we have a sub-theme of “negative” and we have different codes here.
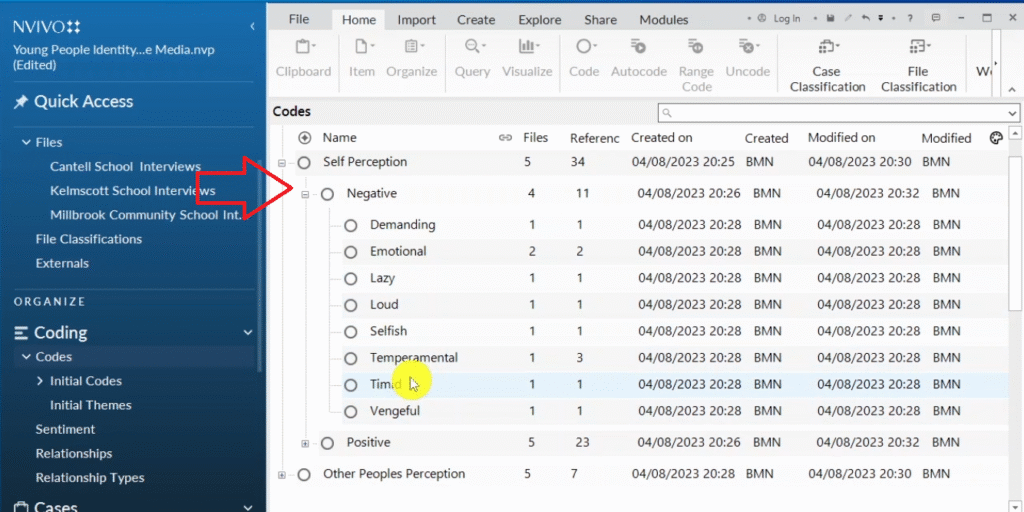
If I want to draw a hierarchy chart from this, I can right-click on the sub-theme, then scroll down to visualize.
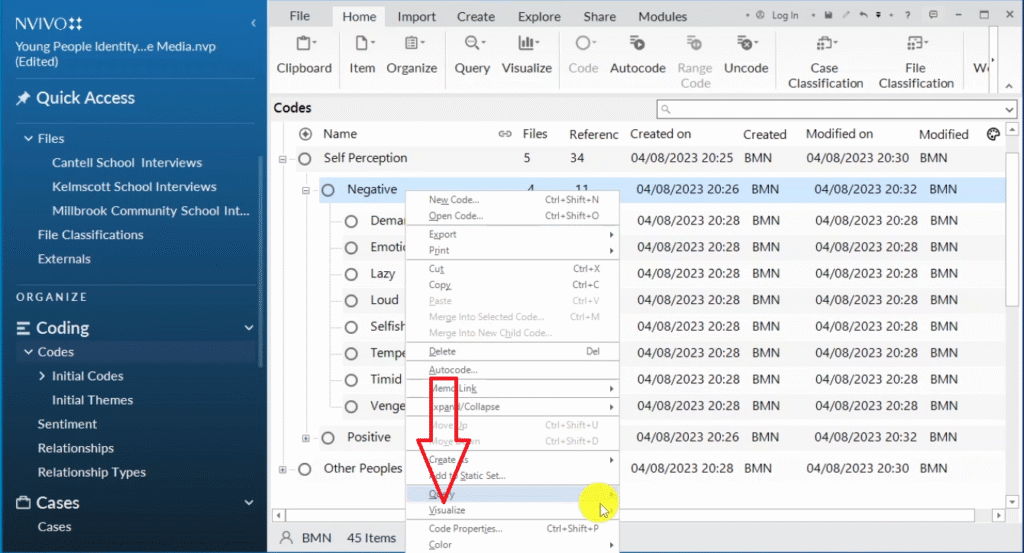
Then I will subsequently select what we call hierarchy chart of codes.
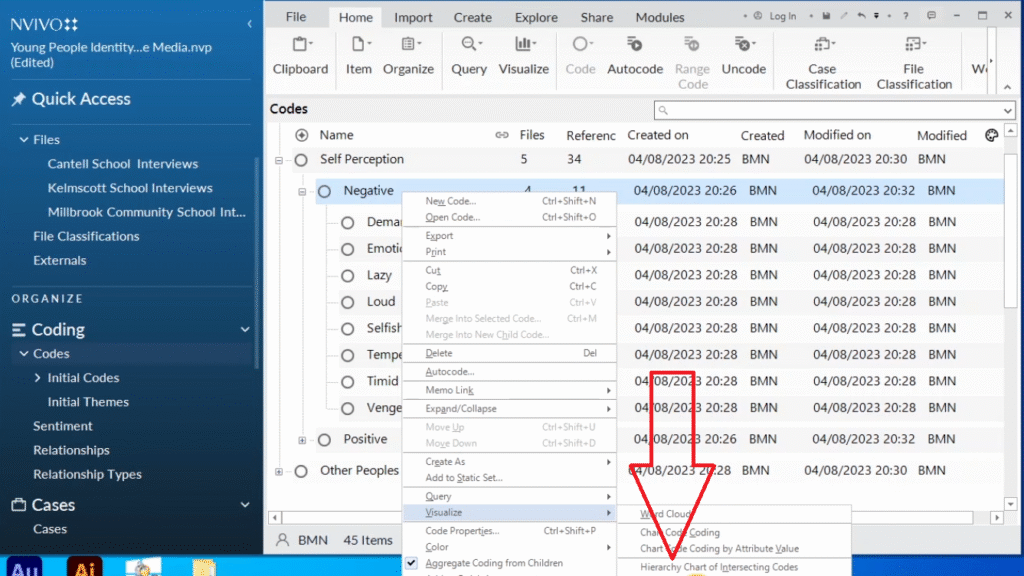
We have the first option, which they call a tree map.
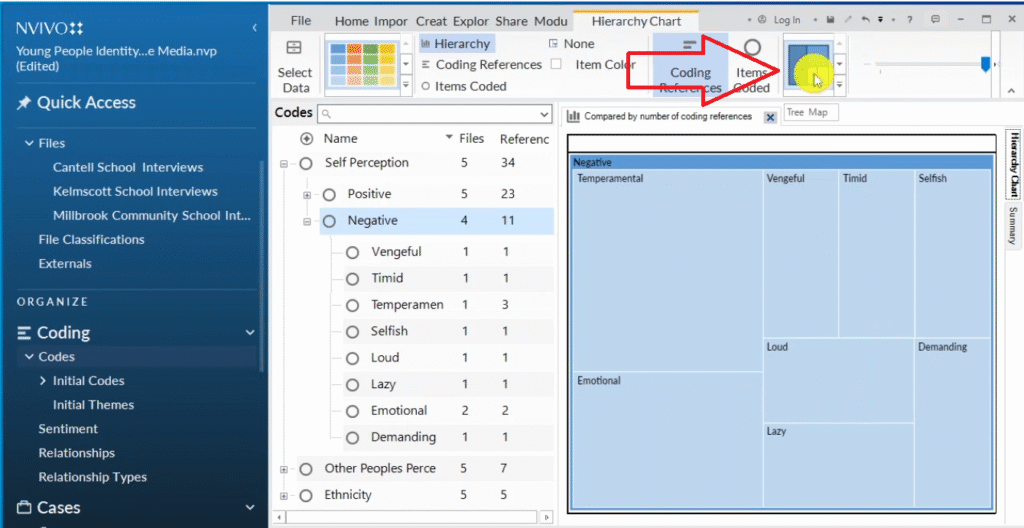
So if you like this tree map, you can export it.
We can already see very clearly that the code of temperamental was very prevalent compared to other codes.
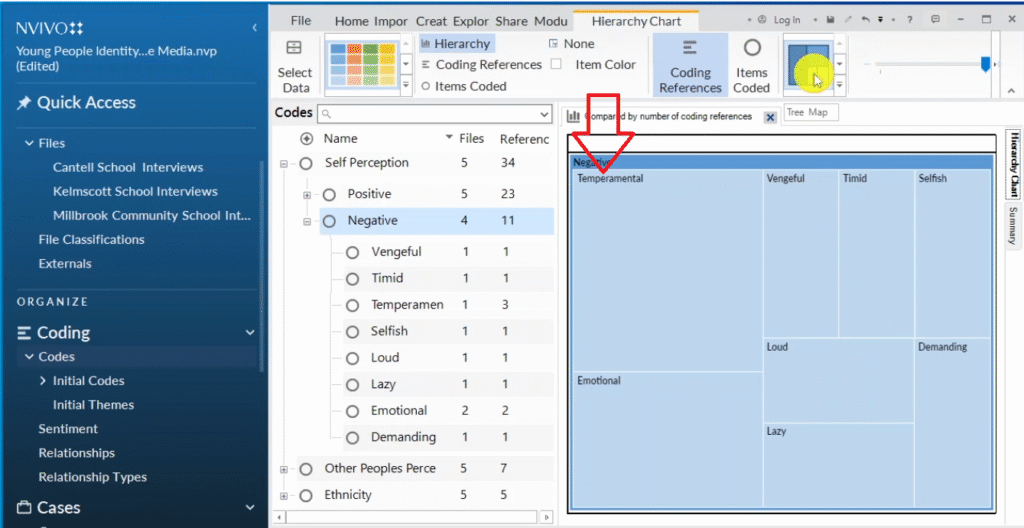
And then we can come to the sun burst which I like to use.
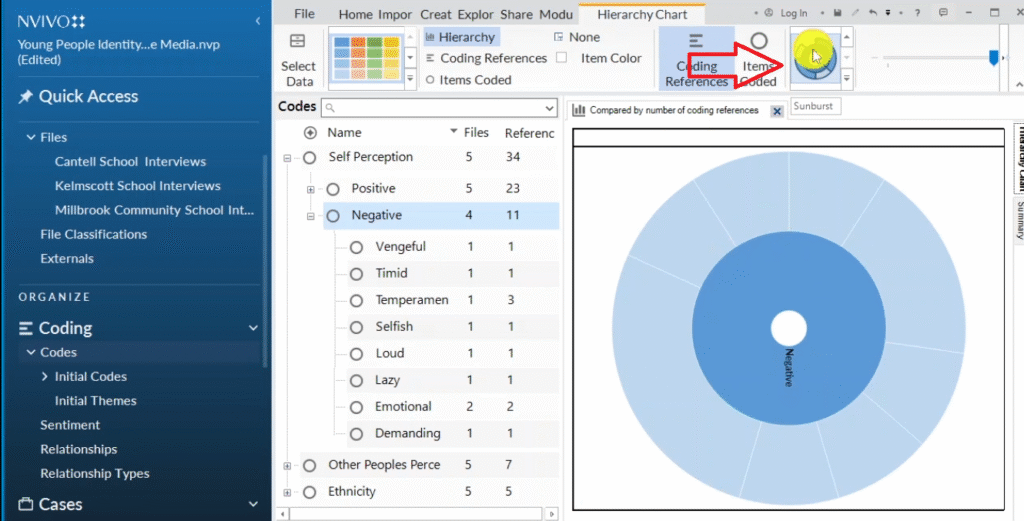
We can click at the centre and see the representation of different codes.
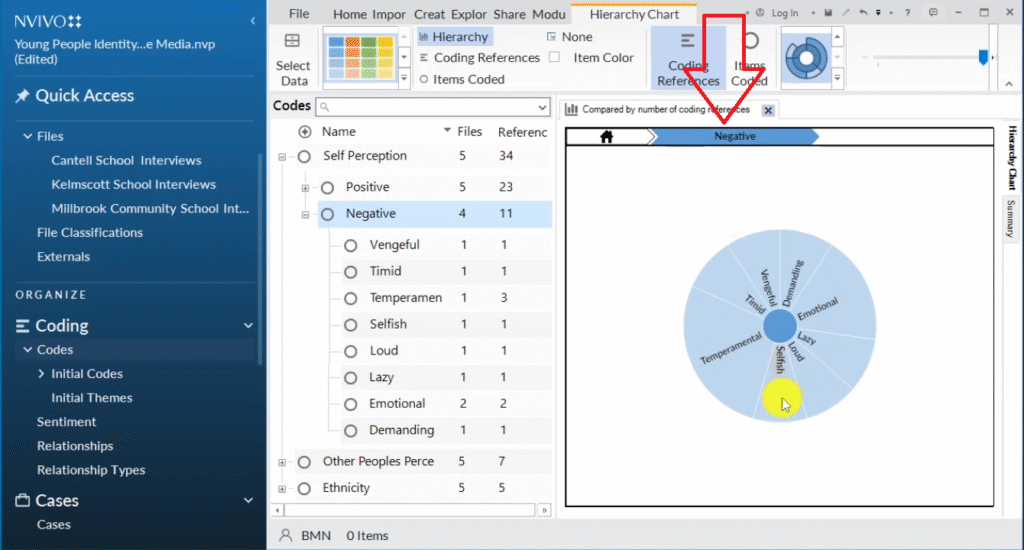
We can see that there was a lot of words that were coded or a lot of references that were made towards the code of being temperamental, which takes up a very big area.
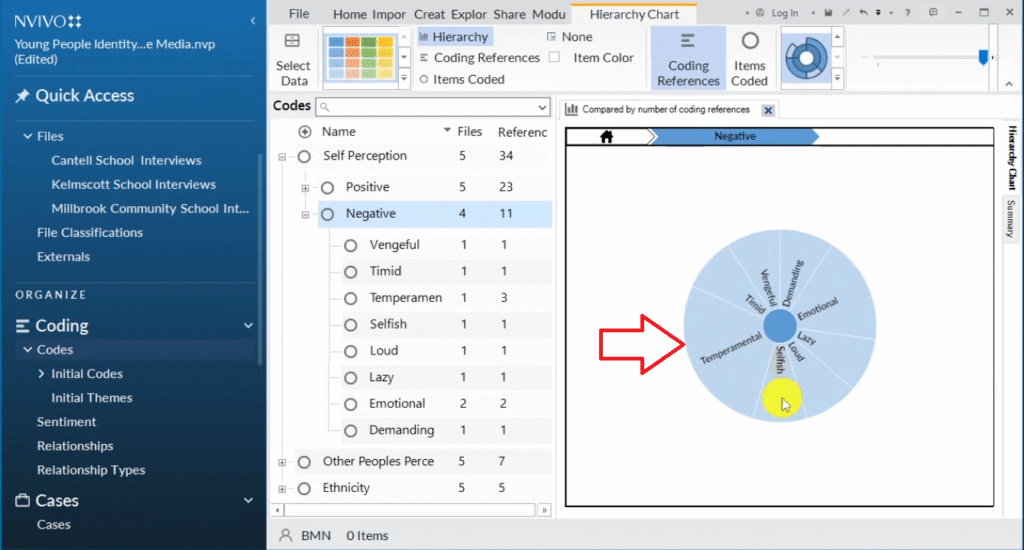
This doesn’t mean that temperamental is a more important code than others.
No.
It means that there was more information related to the code of being temperamental.
We can export this chart by pressing Control+shift+E.
Look at that.
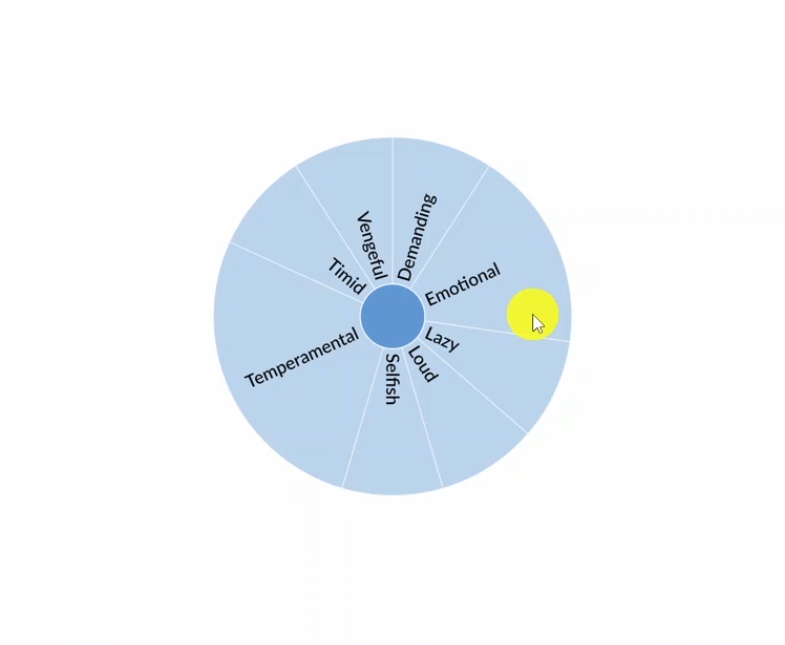
This is the third way of visualizing data in N-Vivo 14, which is through the use of hierarchy charts.
Tables
Let’s look at the fourth way of visualizing data in N-Vivo 14, which is through the use of tables.
We still have our major three main themes here.
So if I select all the themes, then right click, and go to export then export list.
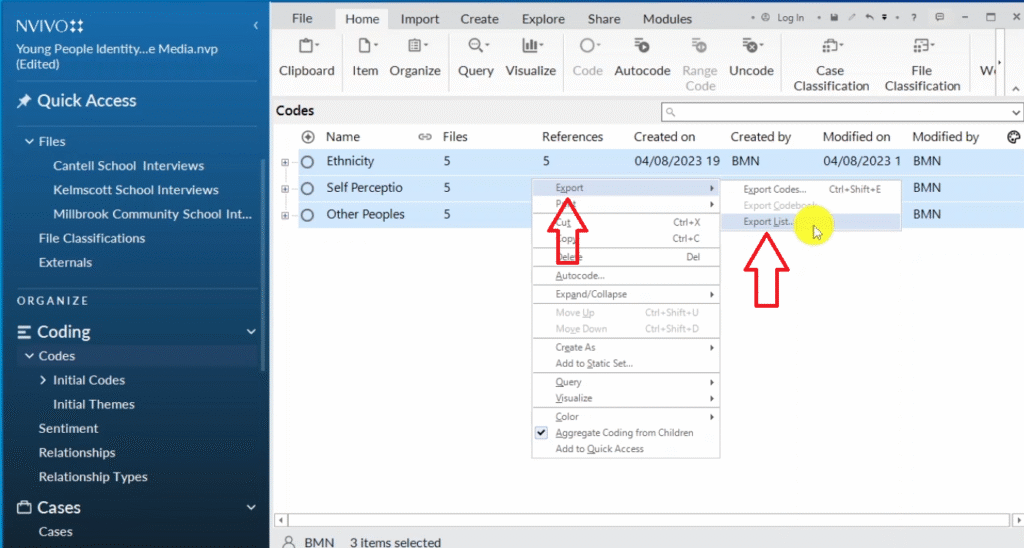
Then call these codes file as sample two, and let’s save that.
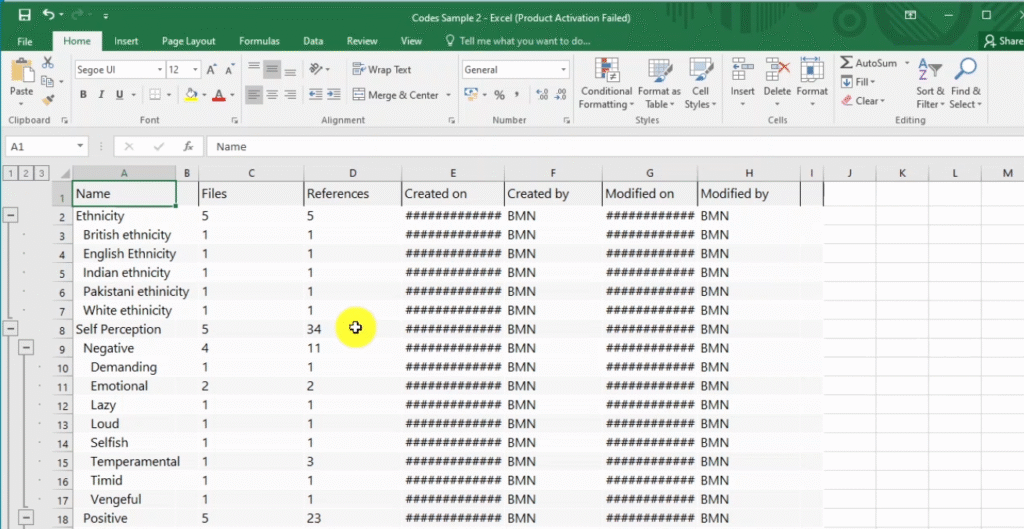
It’s an Excel file, N-Vivo wil export all our codes , and all our themes as this Excel file.
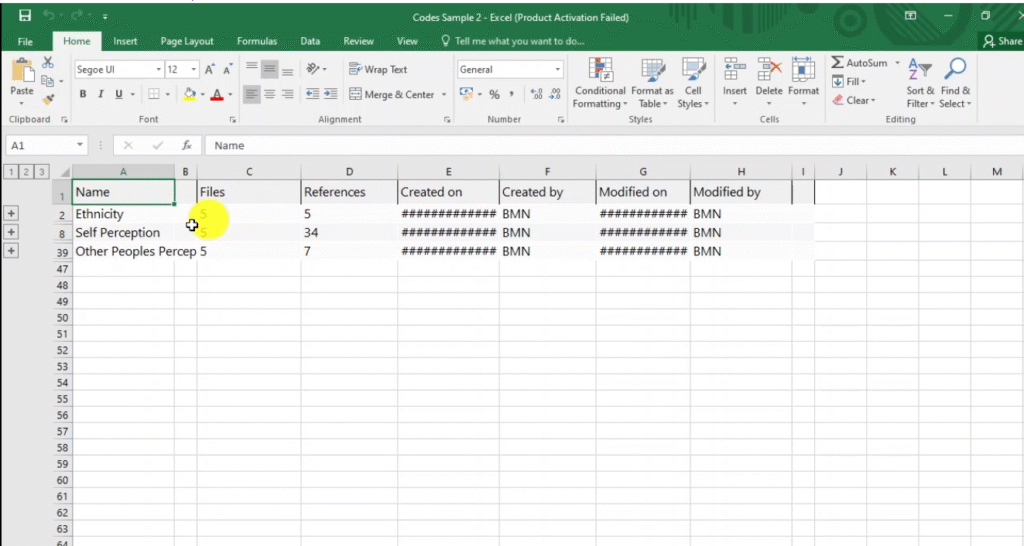
N-Vivo will export all our data using the order that we coded our data.
For example, you can see some numbers on my left here.
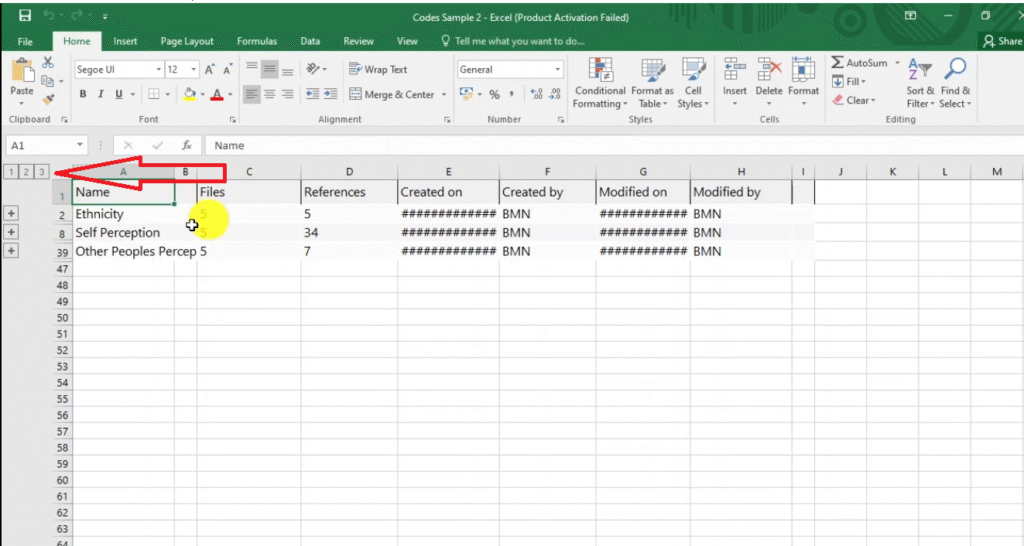
Number1 are the major themes.
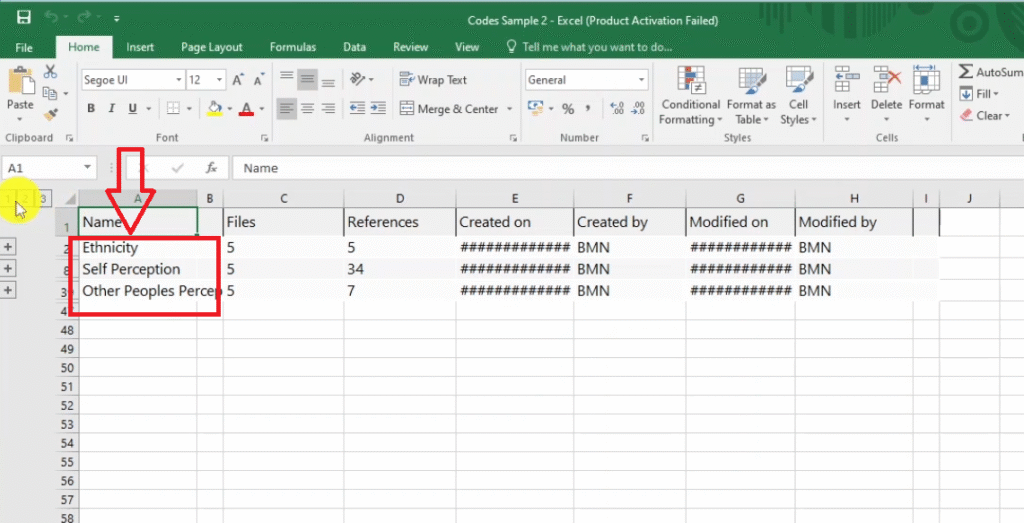
Two are the themes and the sub-themes and codes.
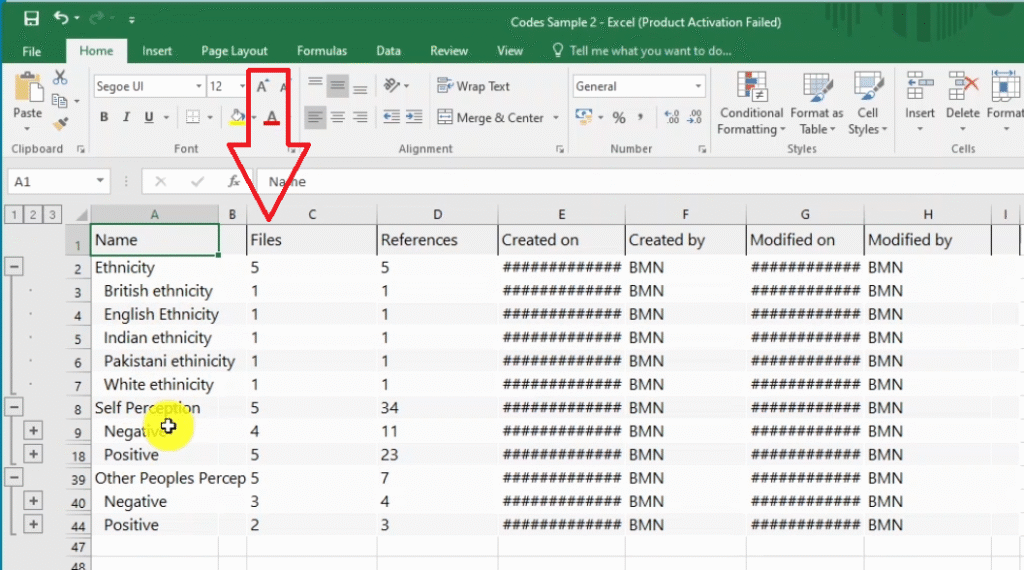
The files are the number of participants that were coded to that given theme or code or sub theme.
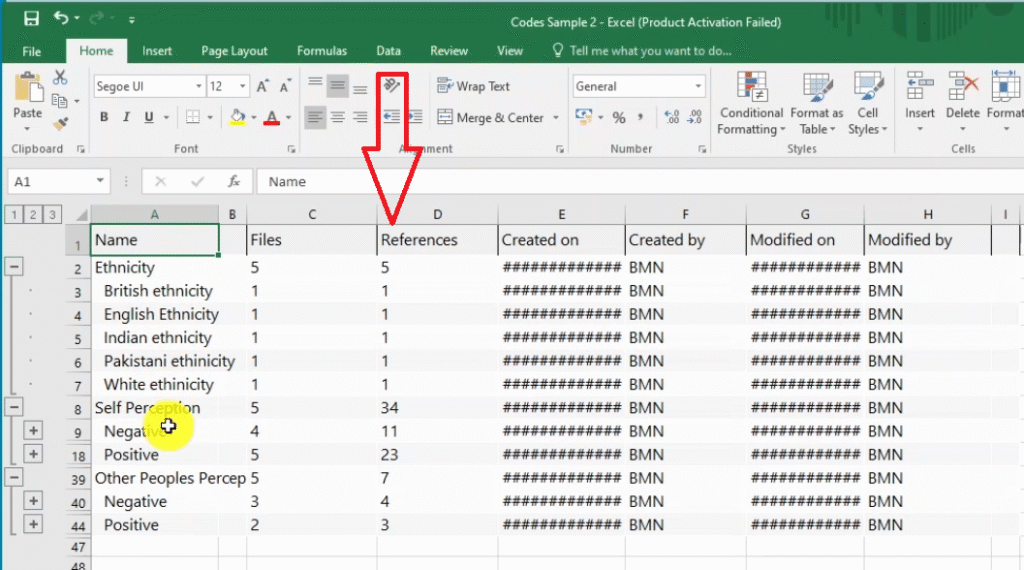
References are the number of references made for each major theme, sub-theme or code.
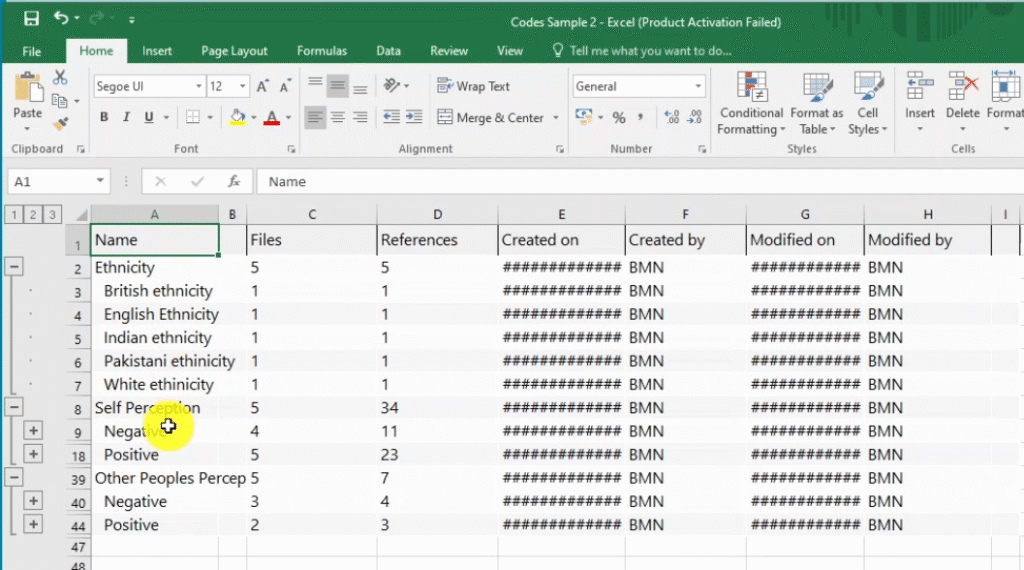
If you click on number three, you have the full code structure.
We can export this list in N-Vivo, which we can attach to the appendix of your dissertation or thesis.
Also, we can use this to draw tables that we will use in our report.
For example, I have this table in my data analysis report I made after I did the analysis.
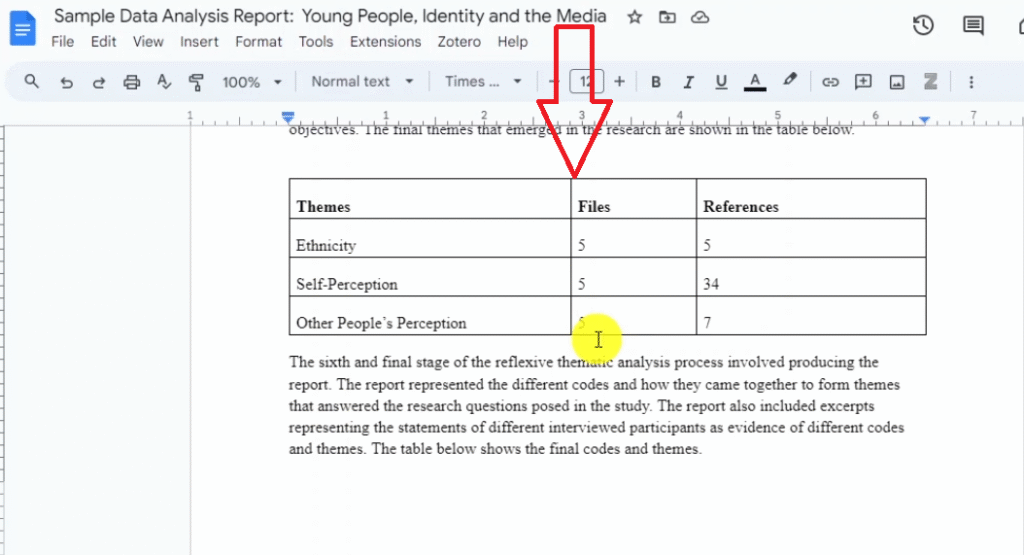
I simply copy pasted my data from the Excel file that I just showed you.
You can go even further and come up with what we call bar charts using Microsoft Word from such kind of information.
And that’s what I want to show you, now the information that we got from Exile file I can copy this.
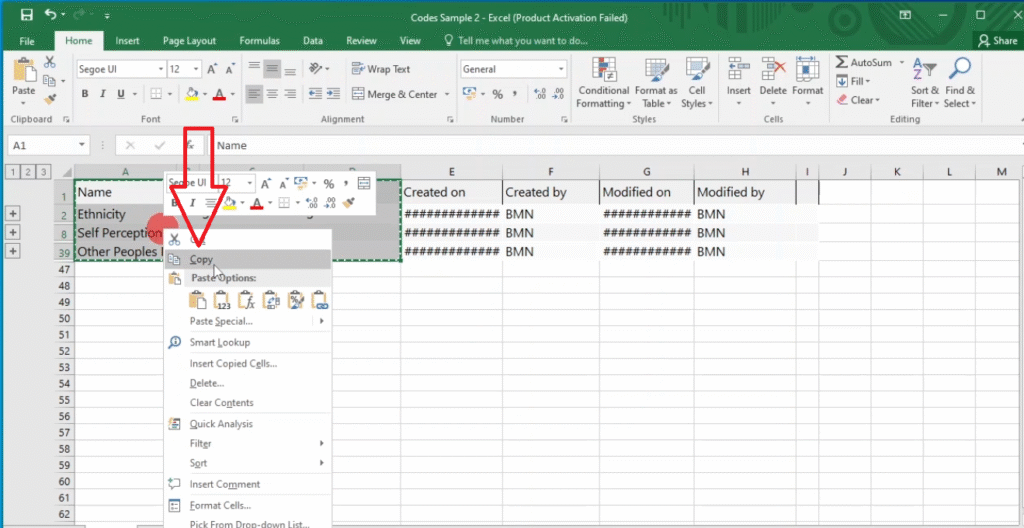
Then go ahead and open a Word document and I can paste the table there.
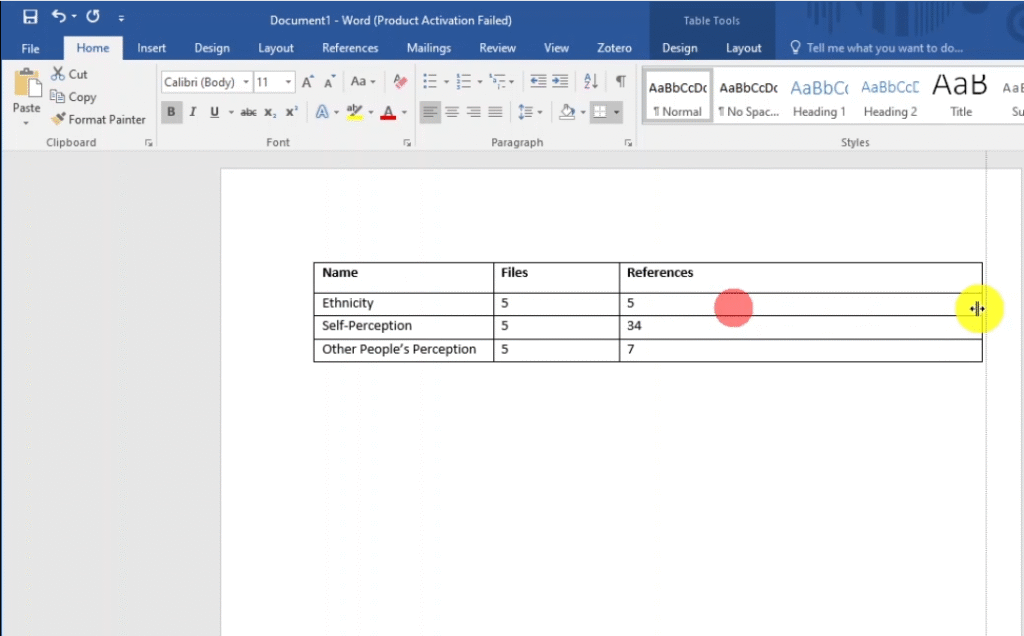
I can use this table as a way to visualize data in my data analysis report.
Then save this.
This is one of the ways you can use to visualize your data when you are presenting your findings.
From this table, we can develop a bar chart using Word.
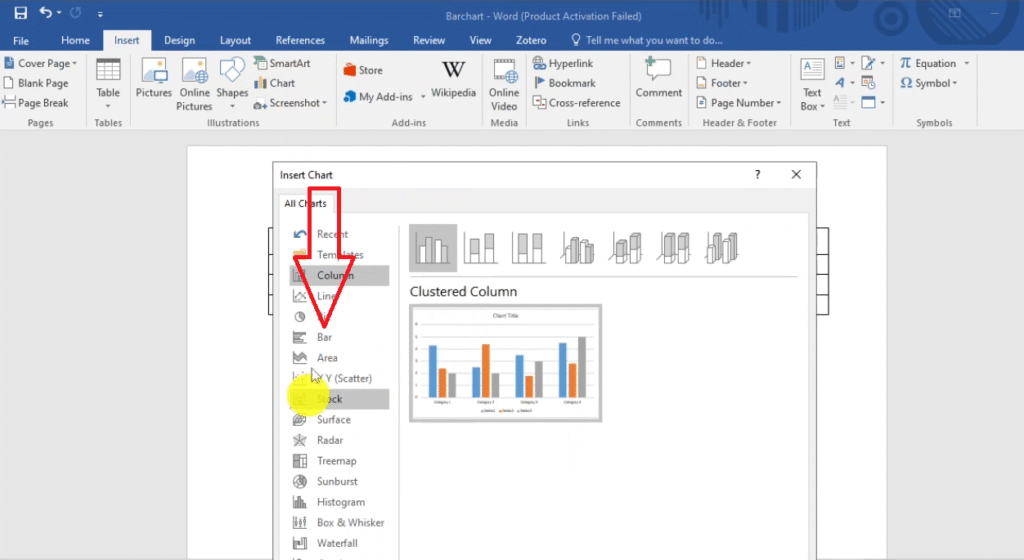
Go to insert.
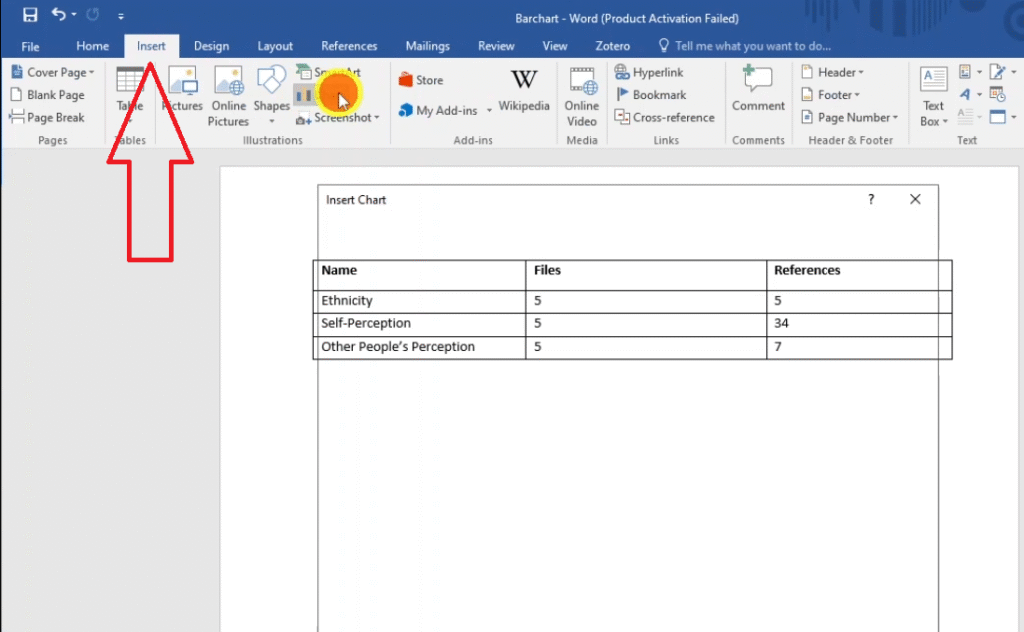
Then go to charts area.
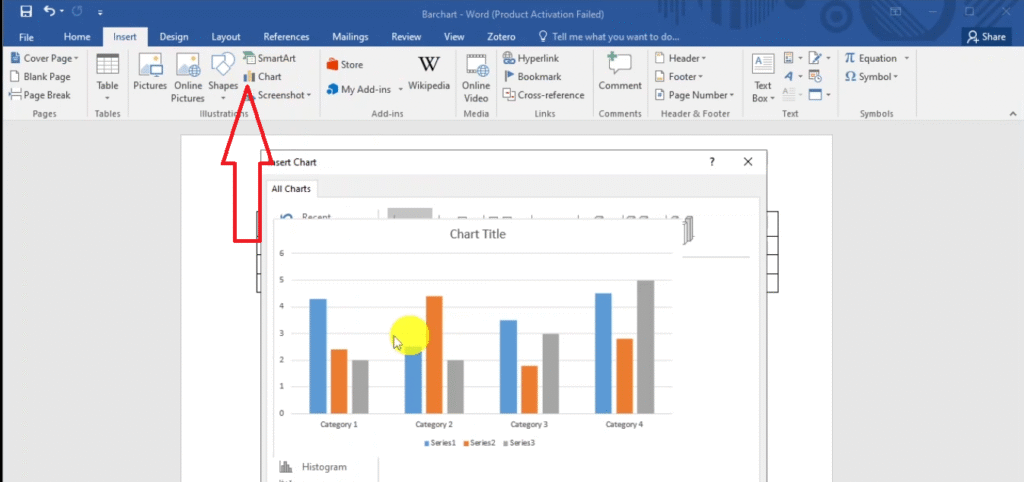
Then go to bar and click okay.
You can see that we have an Excel file pop-up.
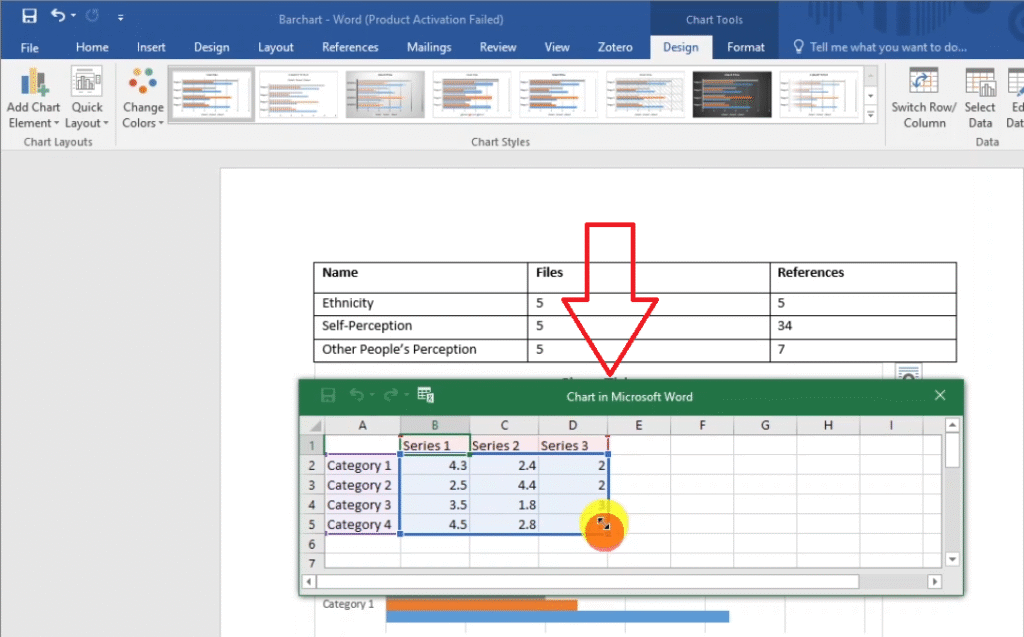
That file will control the information that we see or the information that we’ll have on this chart.
And we are going to use the data that we just exported.
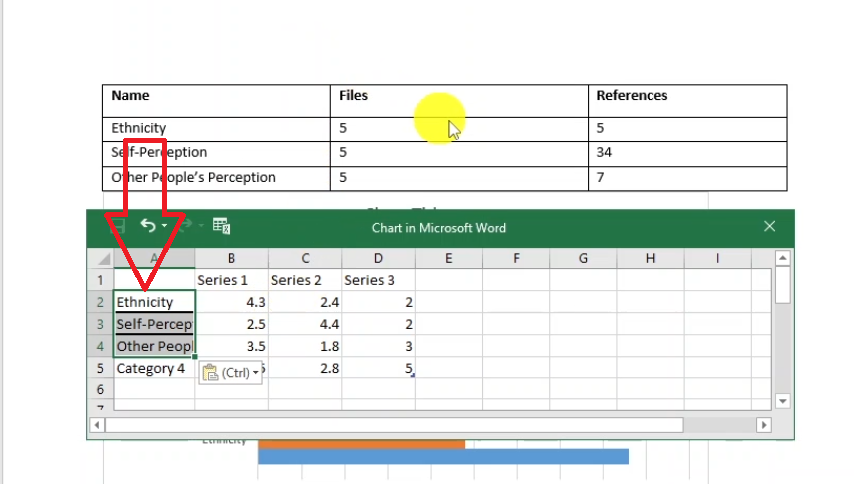
We can see from the data we only have three categories, which is ethnicity, self-perception, and other people’s perception.
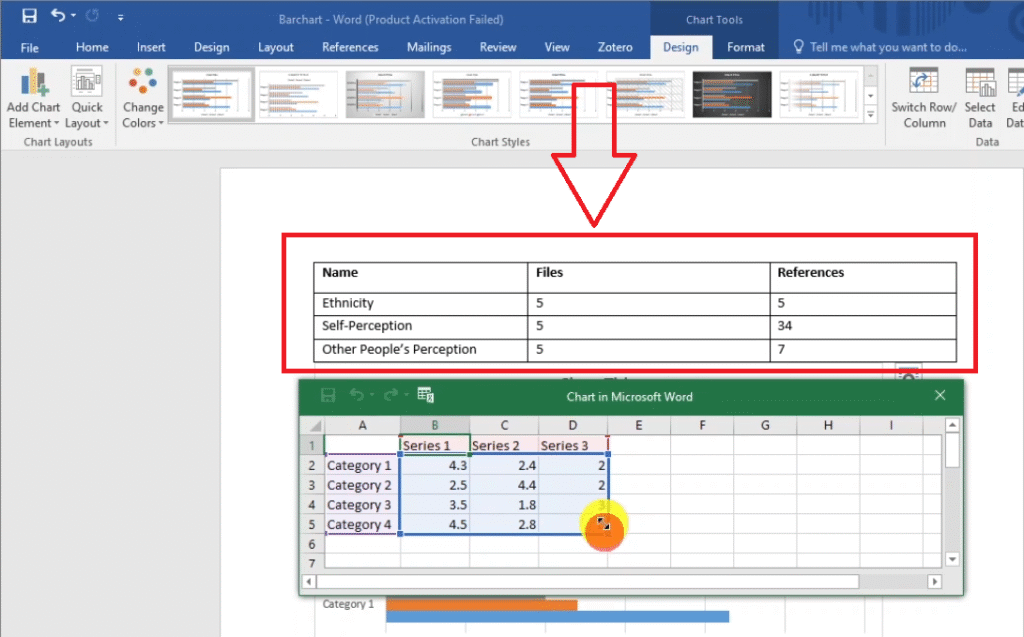
I can copy the three themes and paste them in the excel category section.
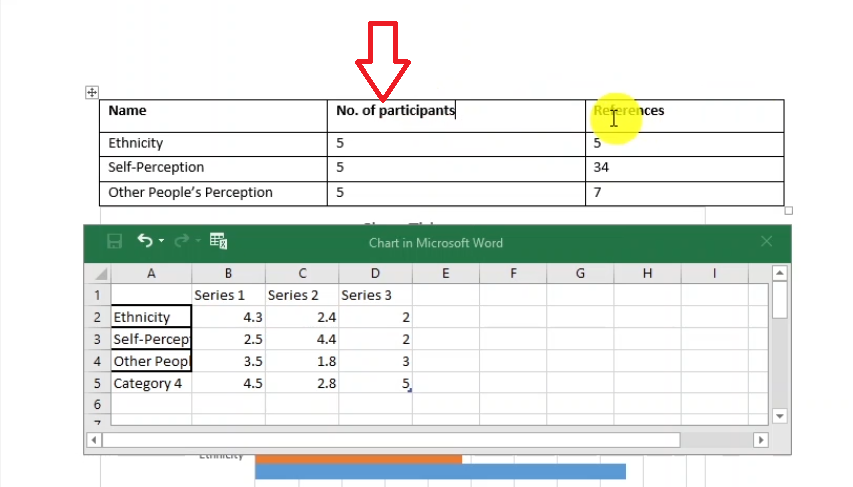
Instead of having files here, I like putting this as number of participants to make it easier for anyone reading my report to understand what these numbers mean.
And I like calling this one number of references.
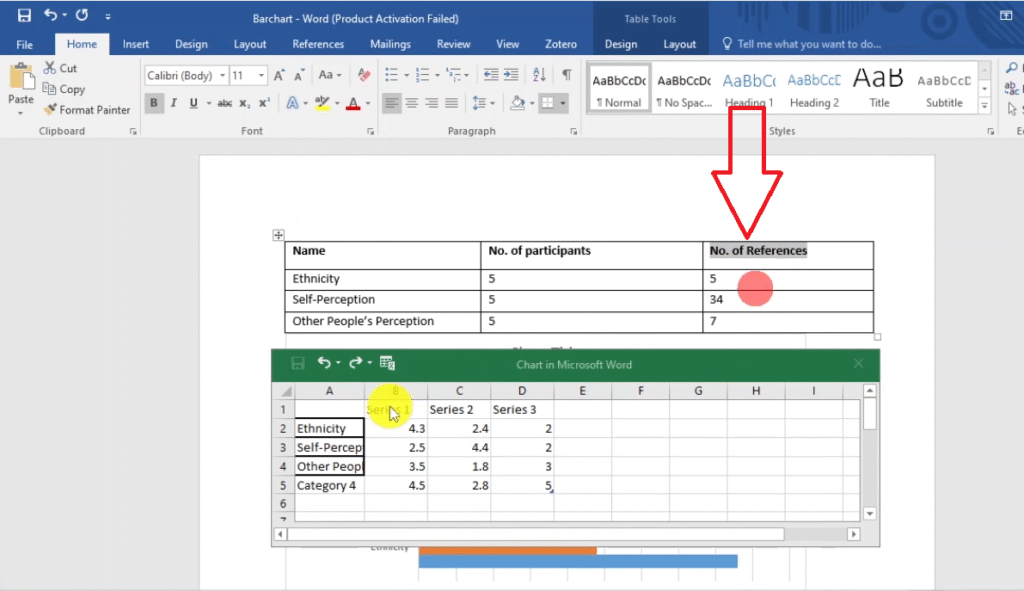
Now we highlight and copy the two areas and paste them inside the excel file.
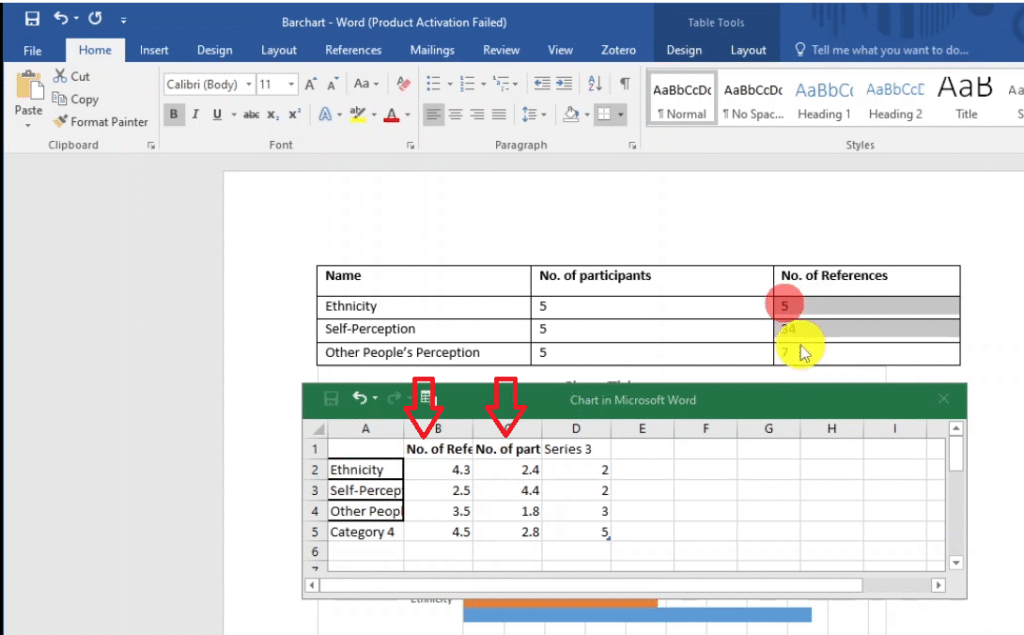
We copy, and I want to copy this data from the excel file into the table.
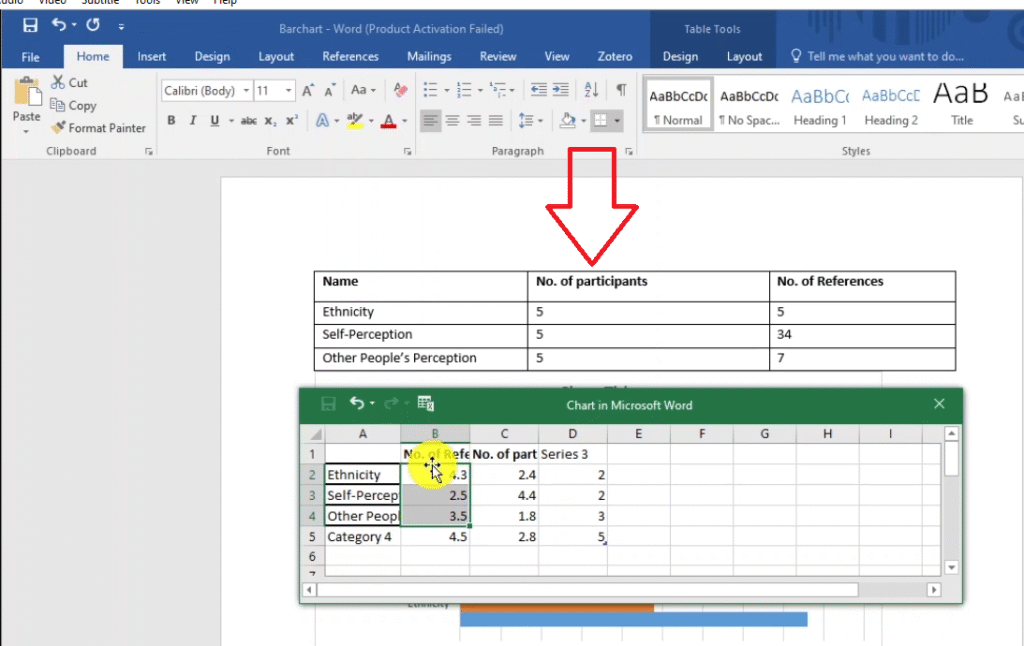
There you have it, and you can see we just developed a very good chart from the data we have here.
And instead of having chart as the title, we can call this theme.
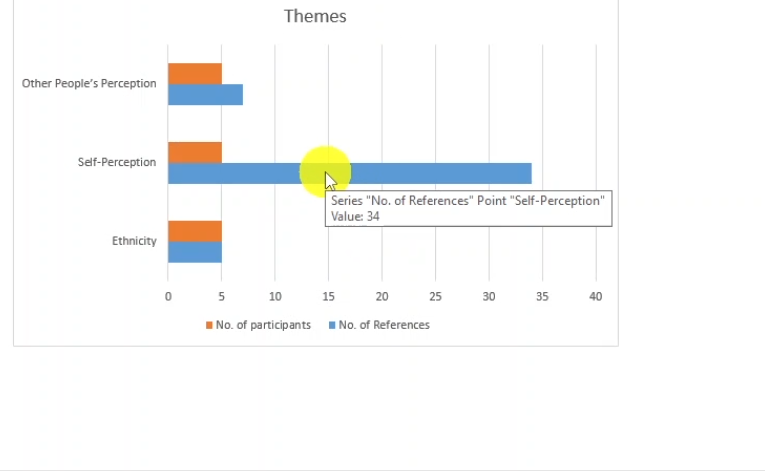
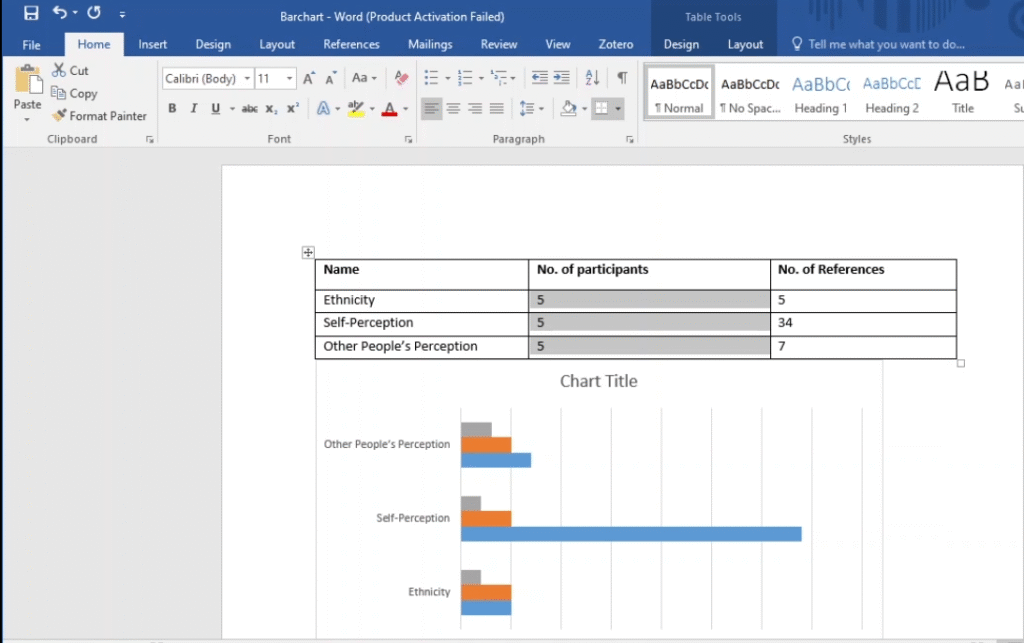
You can see this is a chart we just formulated or we just developed from our table.
That’s another way that we can visualize our data in N-Vivo, which is through the use of charts.
After you get your chart, you can decide to delete your table because they both represent the same information.
Project Maps
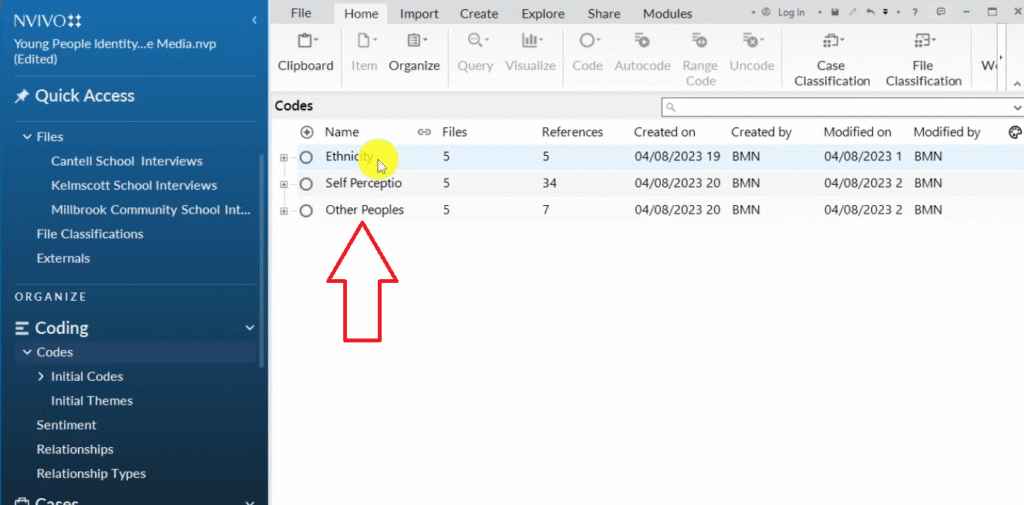
Fifth way of visualizing data in N-Vivo is through the use of project maps.
If you go to N-Vivo and you have your codes, and the three major themes here.
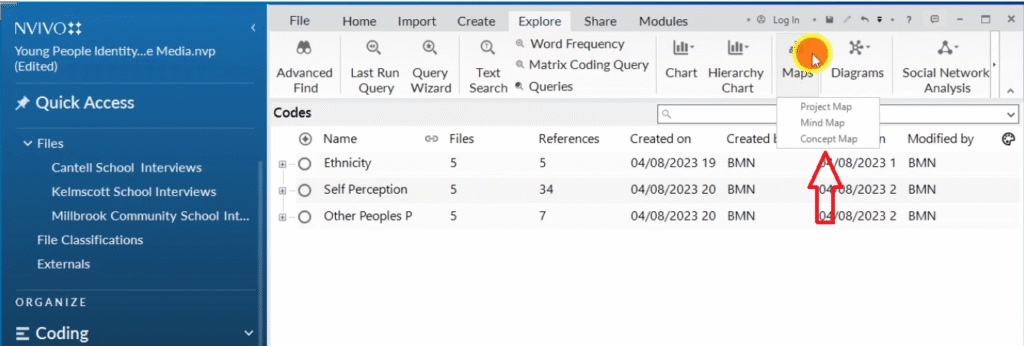
Click on explore on the menu.
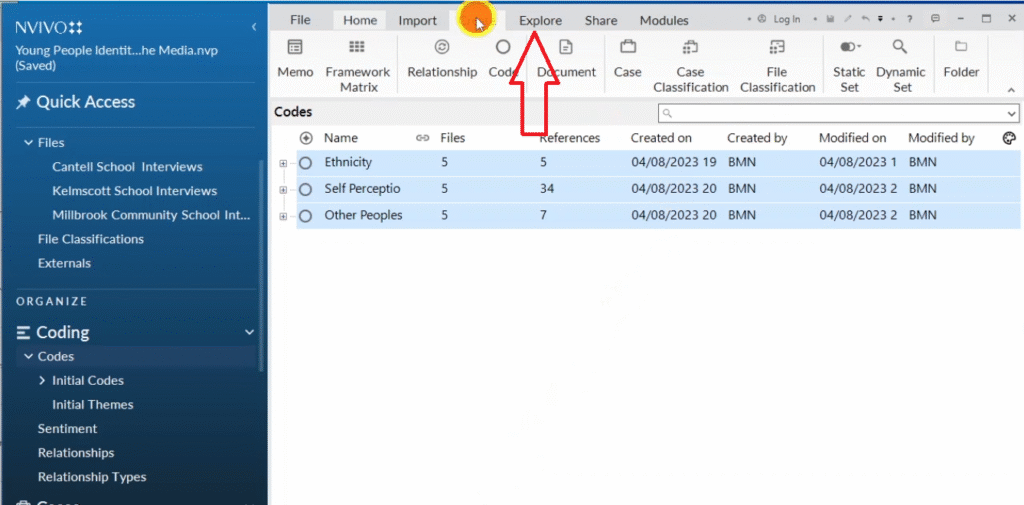
And then go to map.

Then click on project map.
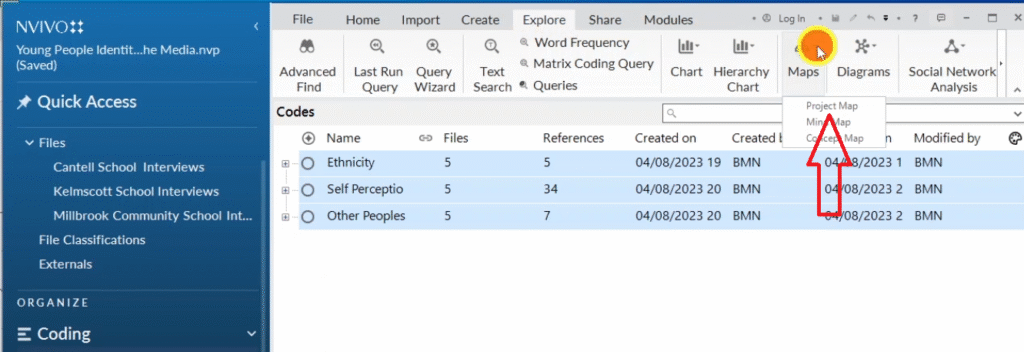
There are three options, we have project map, mind map, concept map.
We are going to use all the three options.
But let’s start with the project map.
And I want to call this Project Map Ethnicity because I wanted to represent the name of ethnicity and I click okay.
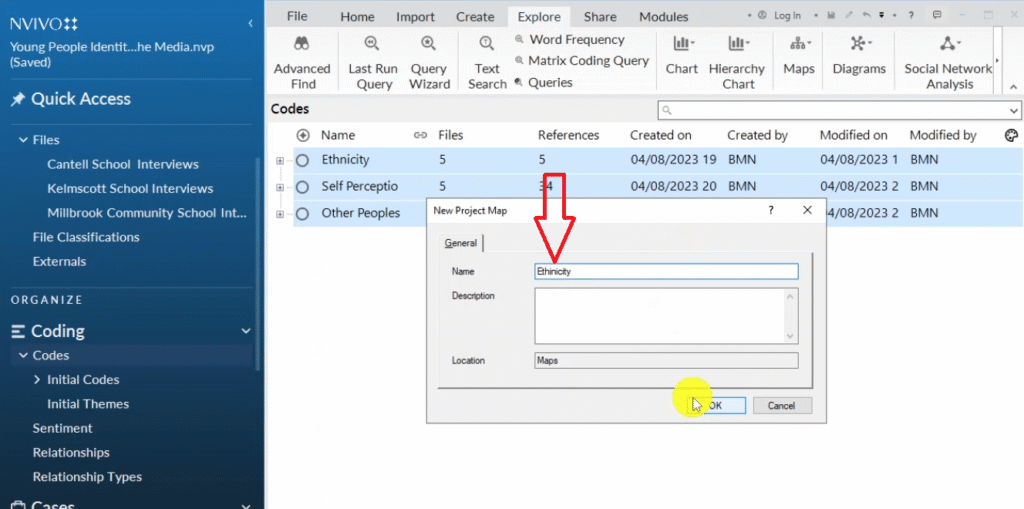
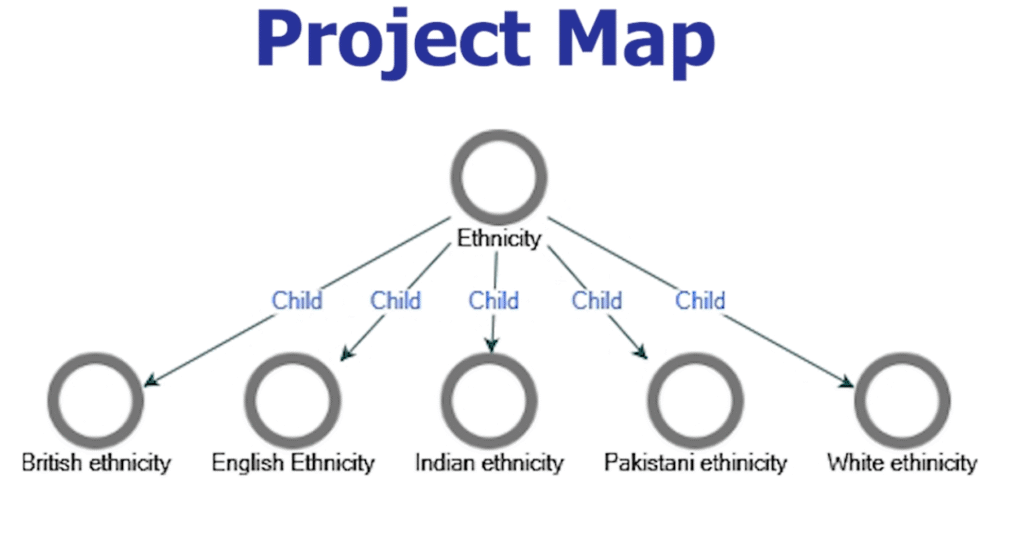
Now I want to go to one of my major theme of ethnicity, and I drag and drop it inside the project map.
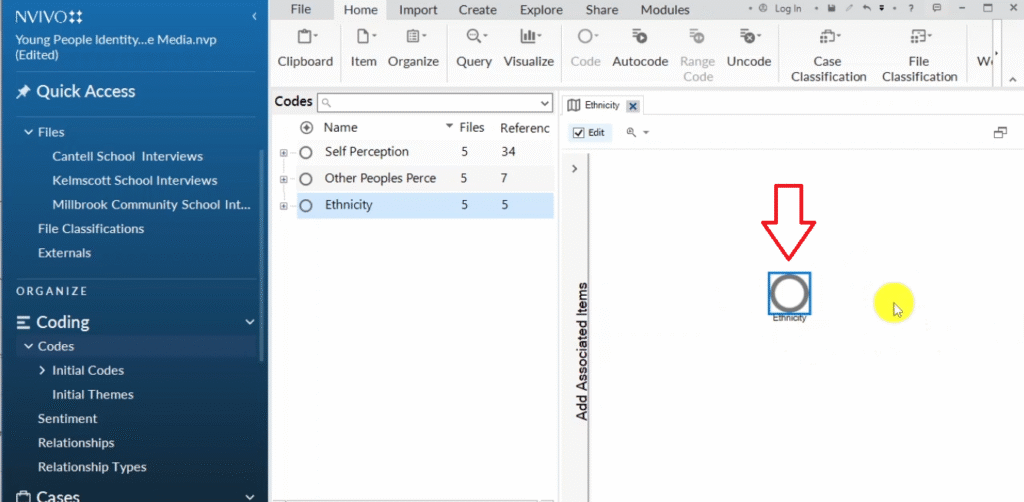
N-Vivo will automatically draw ethnicity as a circle.
Then I click on the plus sign, then highlight all the codes.
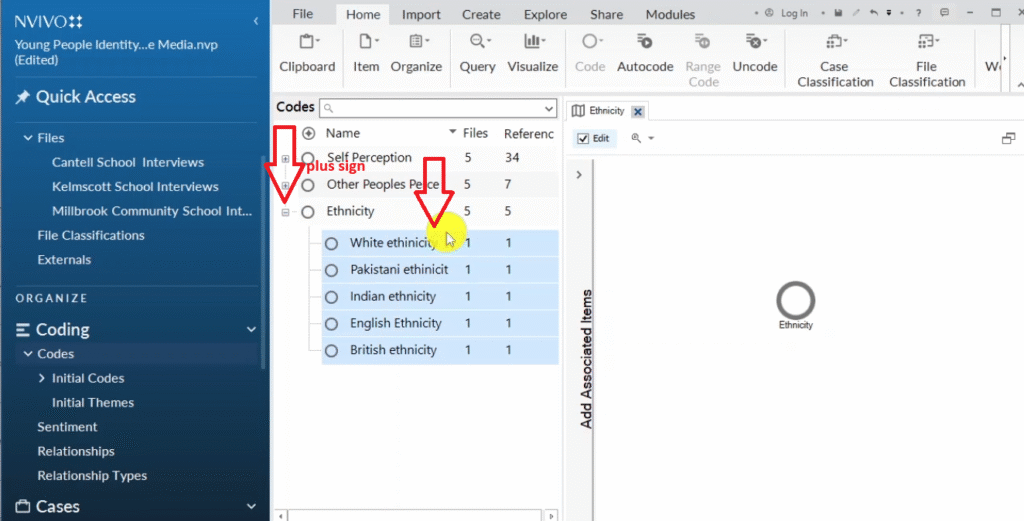
Then I drag and drop all the codes in there and we can see the diagram is not well arranged.
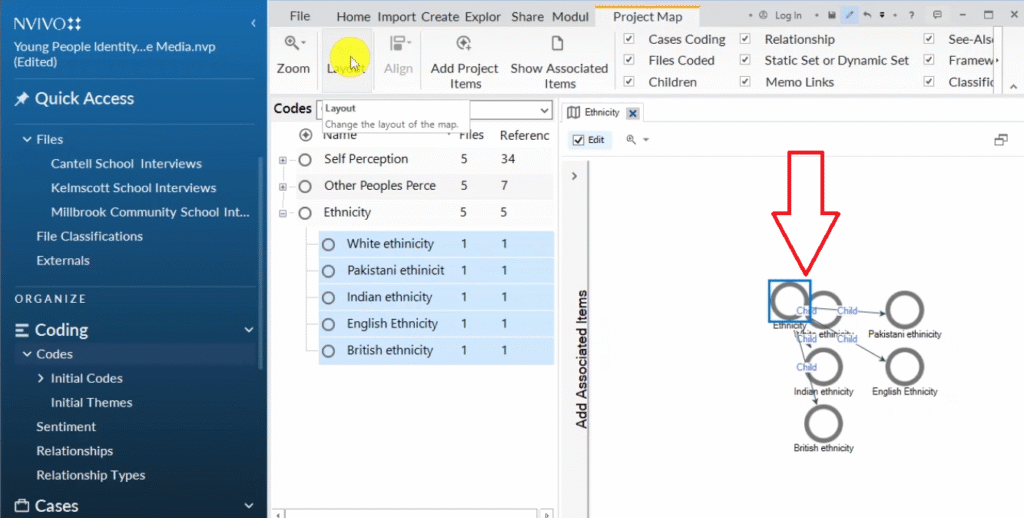
If you click on the diagram and go to this area where you see the layout, you can see the different layouts that NVivo 14 gives us.
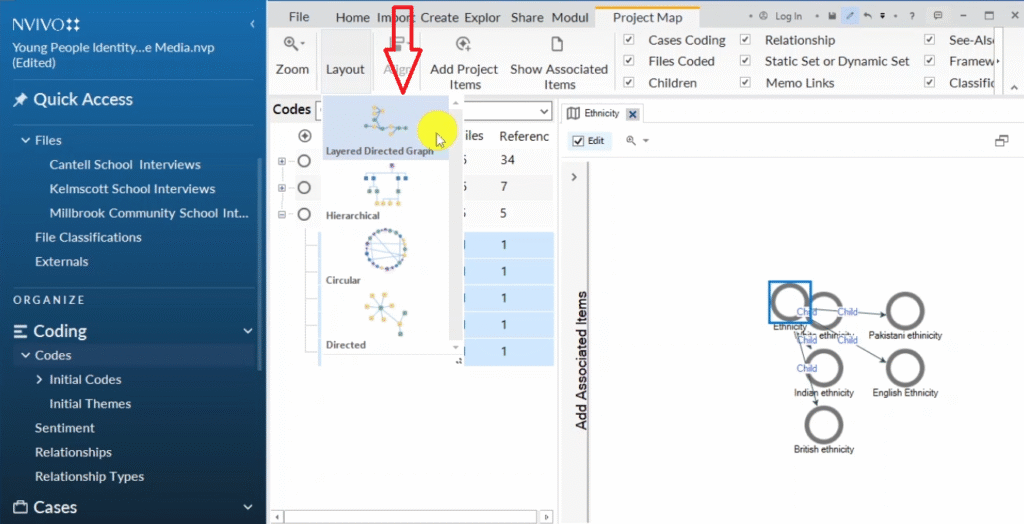
I like to use hierarchical, and you can see this is an example of a project map that we get in N-Vivo.
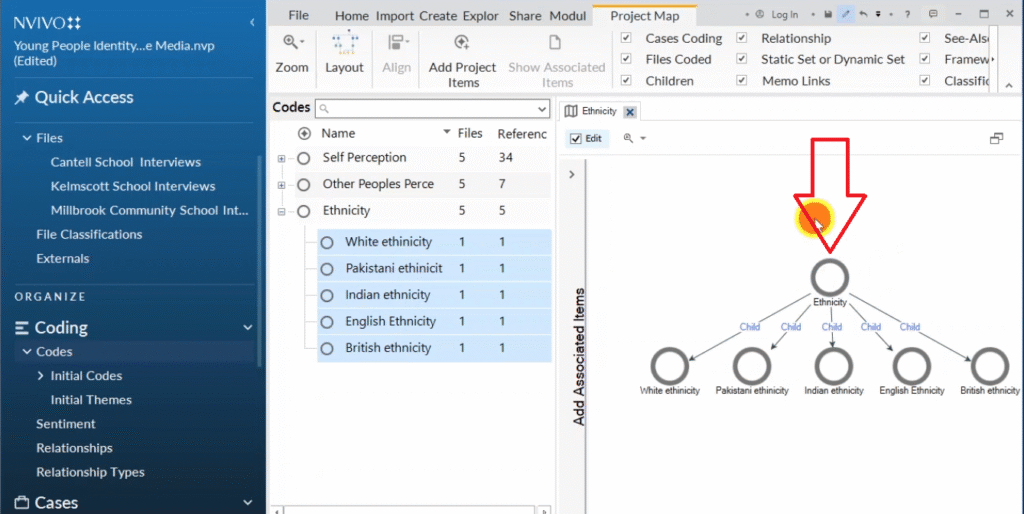
Under the major theme of ethnicity, we have different codes which include:
- white ethnicity
- Pakistani ethnicity
- Indian ethnicity
- English ethnicity
- British ethnicity
Press Control+Shift+E to save this ethnicity as a project map, which you can include in your data presentation report.
That is another way of visualizing data in N-Vivo.
Mind Maps
Let us look at the sixth way of visualizing information or data, which is through the use of mind map.
Again, I’m on codes and this are my major themes that I had here.
If I go to explore, I go to maps, then I go to mind map.
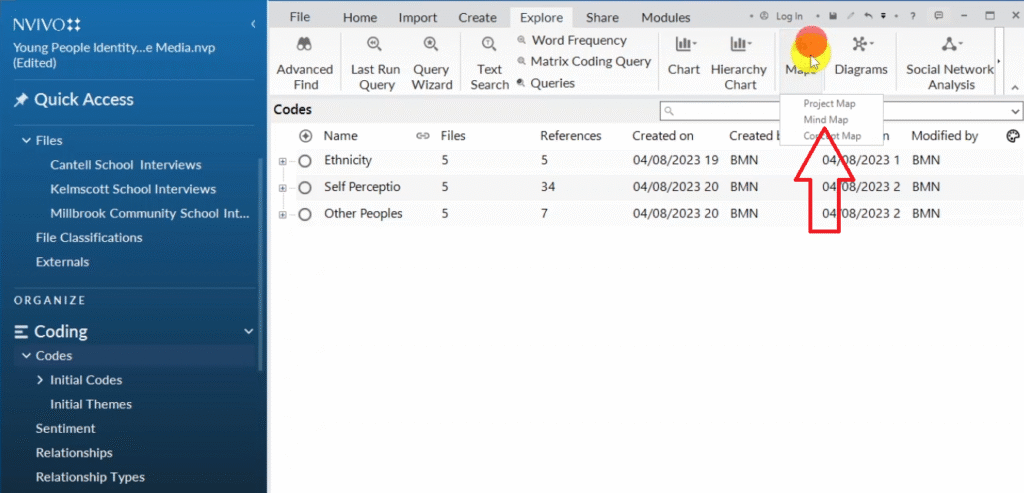
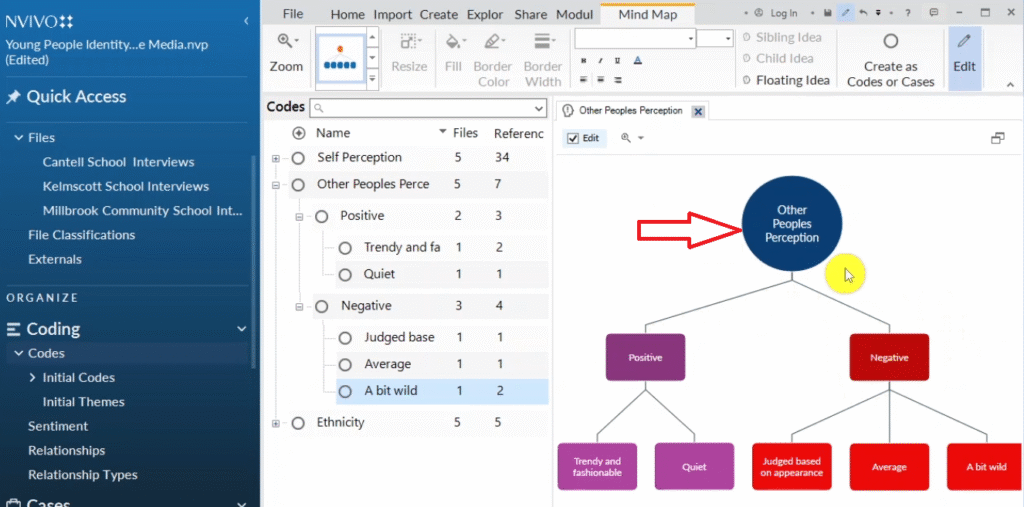
And let’s say I want to make a mind map of other people’s perception as a theme.
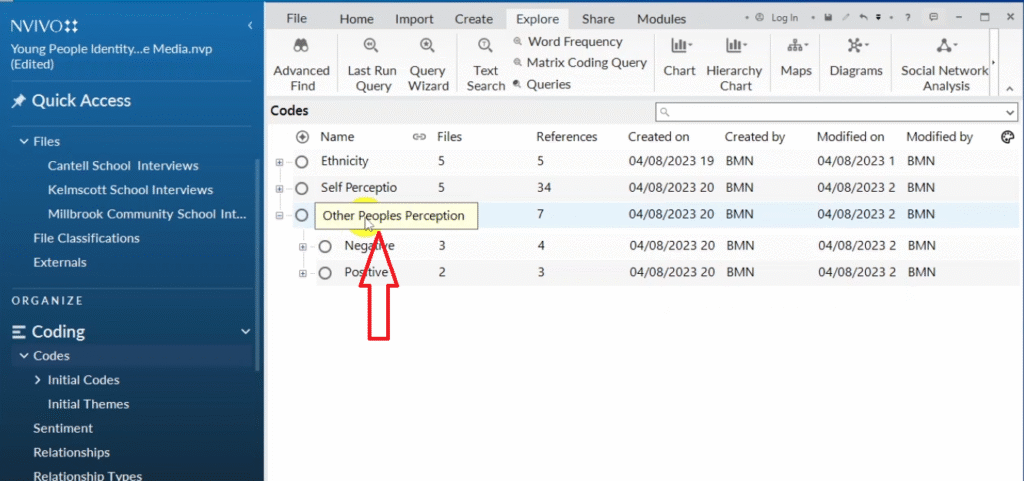
I will copy that theme and paste it inside mindmap.
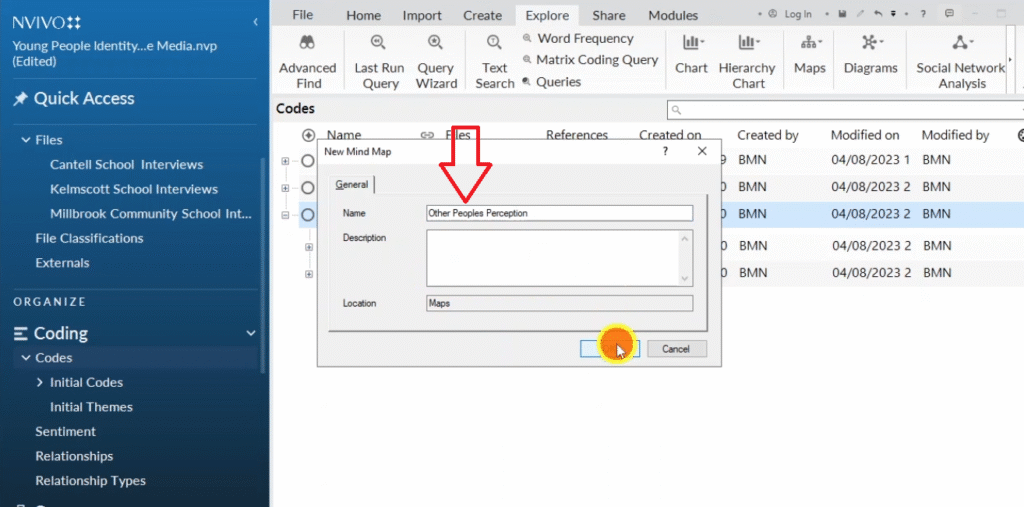
And N-Vivo will start to draw our mind map.
So we have the first circle here.
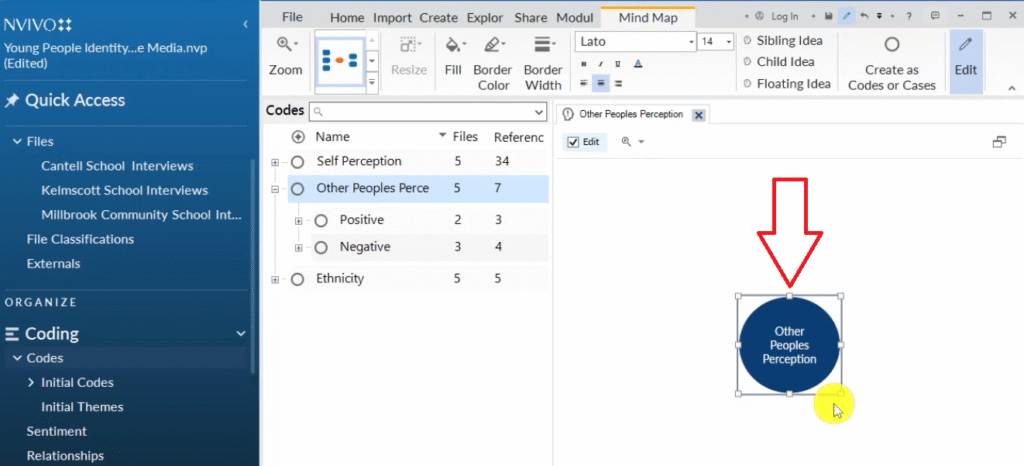
And then under this we can see we have positive and negative sub-themes.
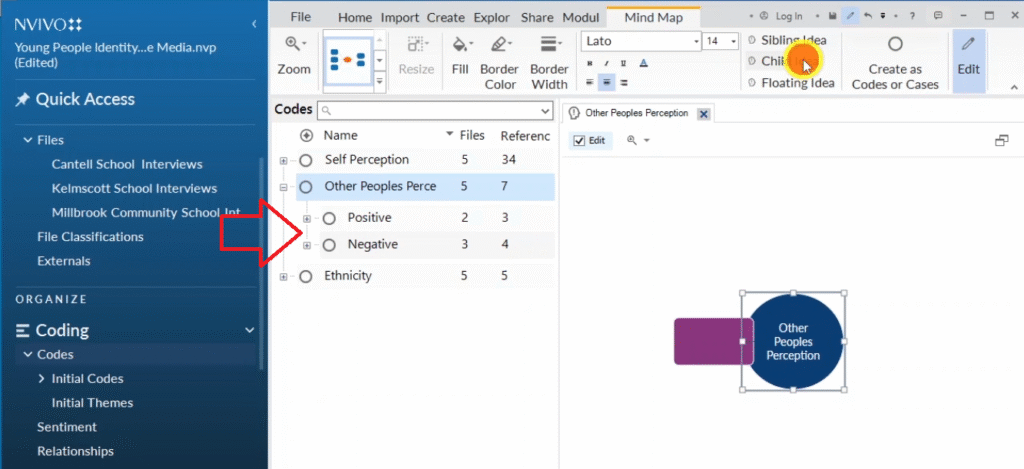
so I’ll go to this area and refer to this as a child idea under other people’s perception.
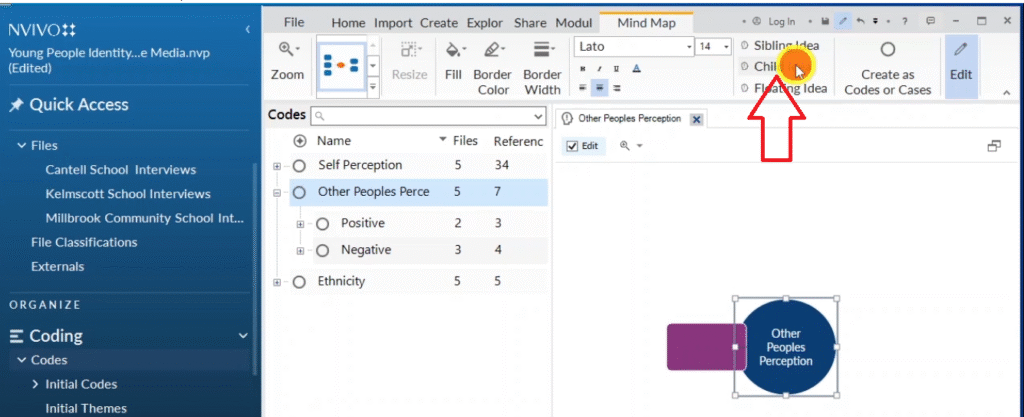
If you want to have a hierarchy you click on child idea.
If you want ideas on the same level, you click on sibling idea.
Child idea is an idea below another major idea.
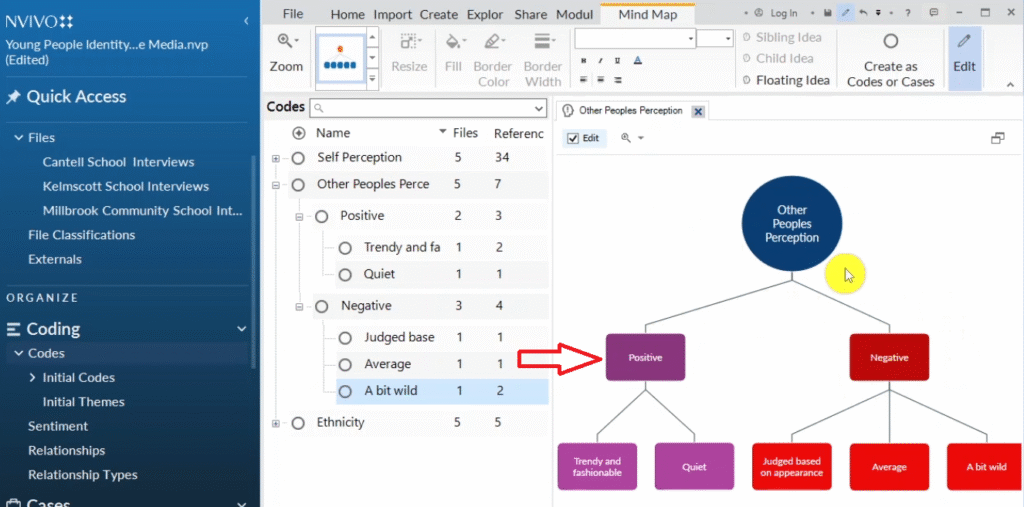
So other people’s perception, I want positive and negative as child idea.
Other people’s perception can either be positive or negative.
Under the positive and negative we can also have other ideas.
Now if you look at this area on your left, on the mind map.
You can see a given tool that we can use to format our mind map.
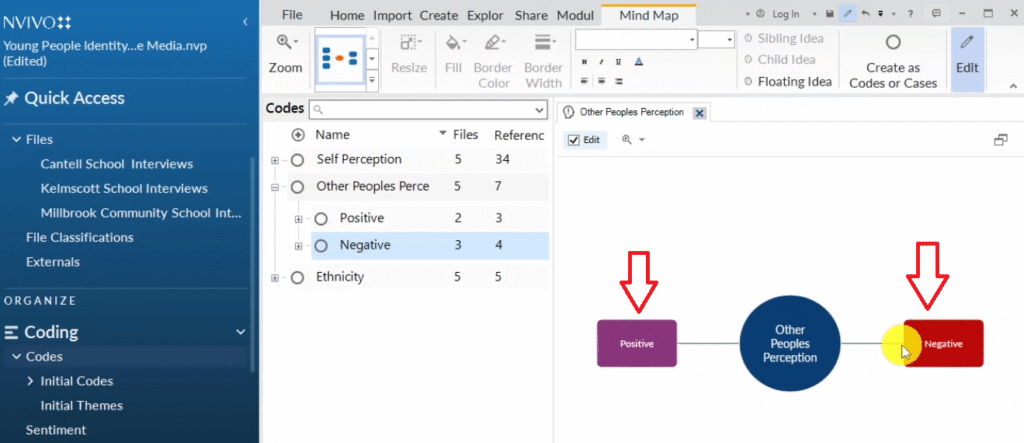
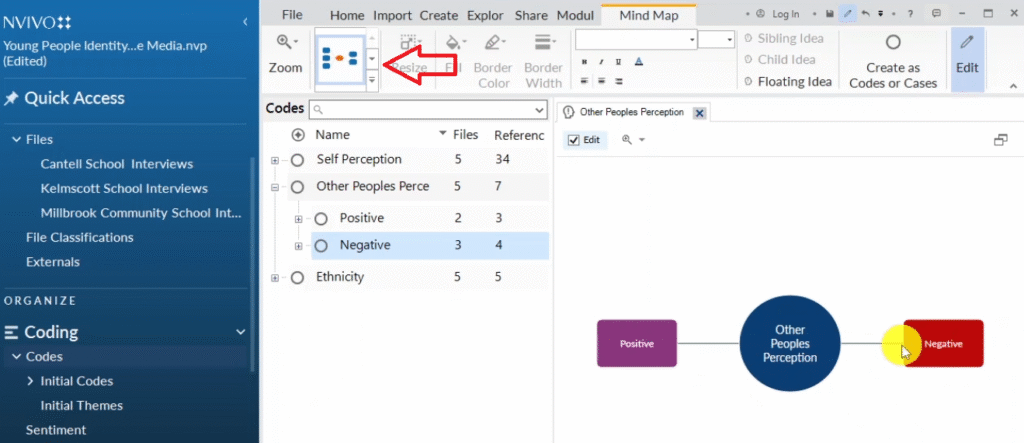
If you go down on the arrow, you can see different options.
I like this one, which they call the top down approach.
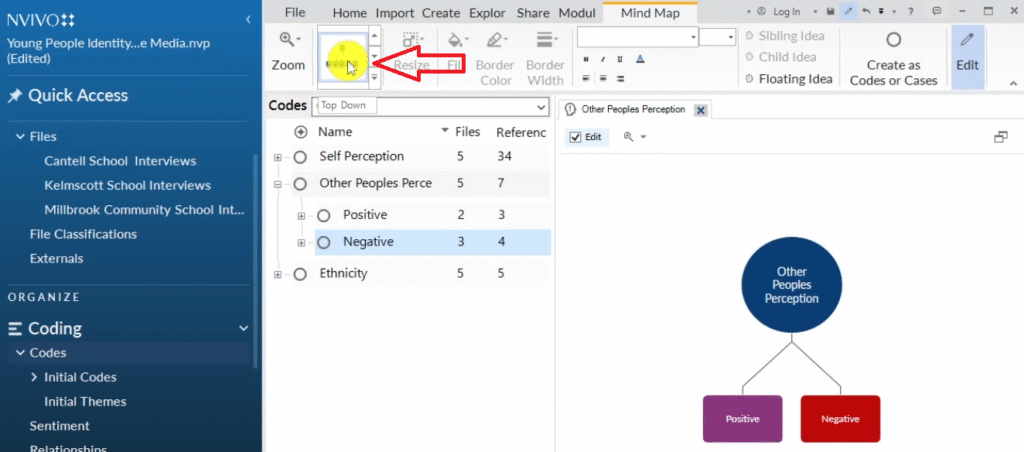
So other people’s perception, you can see positive and negative. This is how the approach looks.

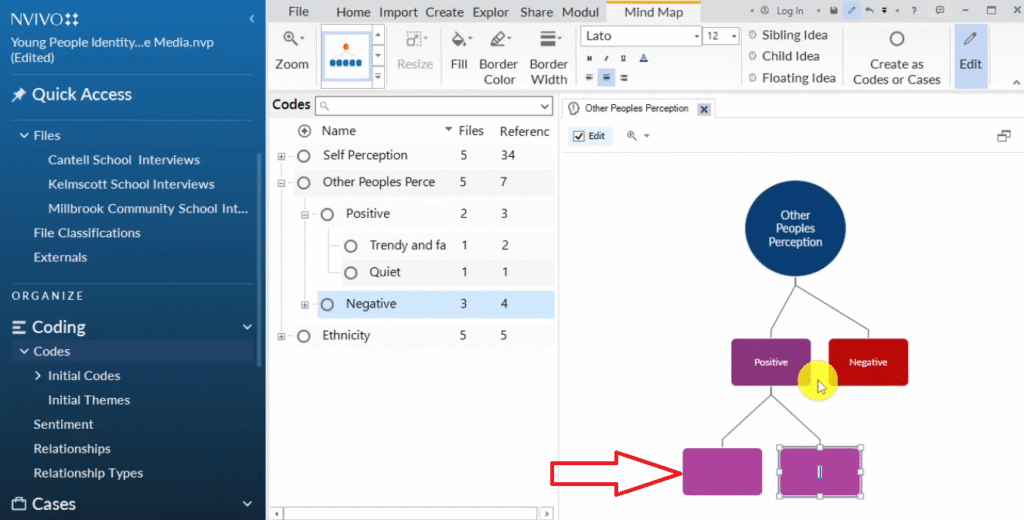
Now under positive, you have trendy, fashionable and quiet.
Those are the two codes under the sub theme of positive.
So under positive, I want two child ideas.
And under negative I want three child ideas.
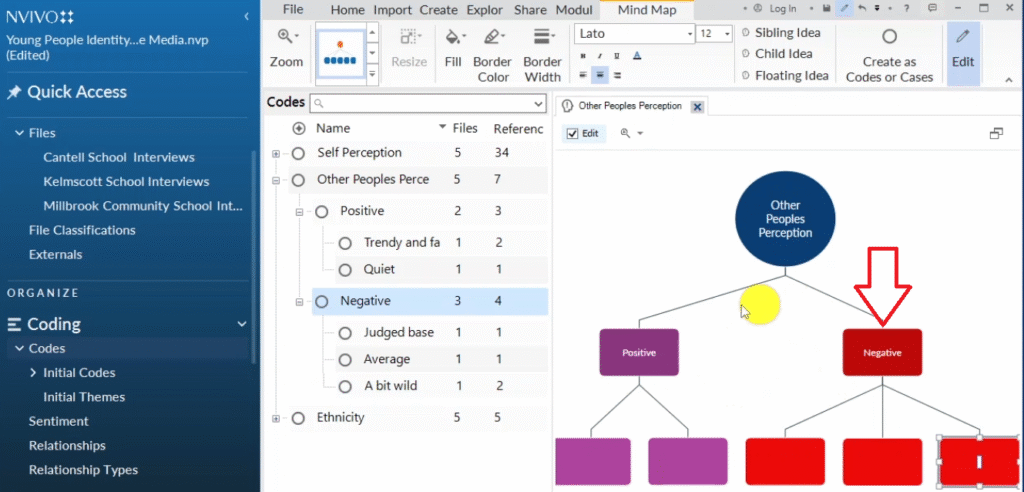
So I copy all the codes and paste them into their sub-themes inside the child idea.
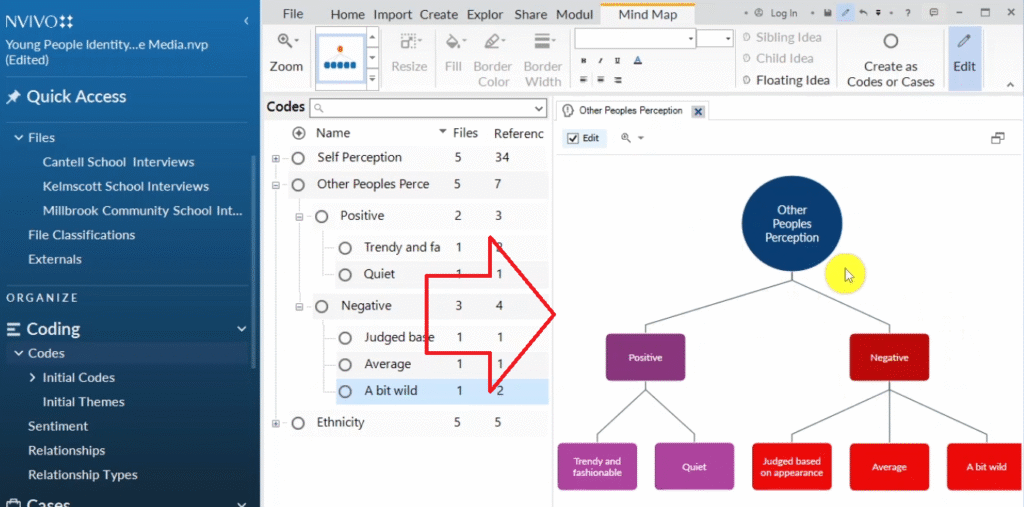
This is a major theme.
This are the sub themes on this level.
And these are codes on the lower level.
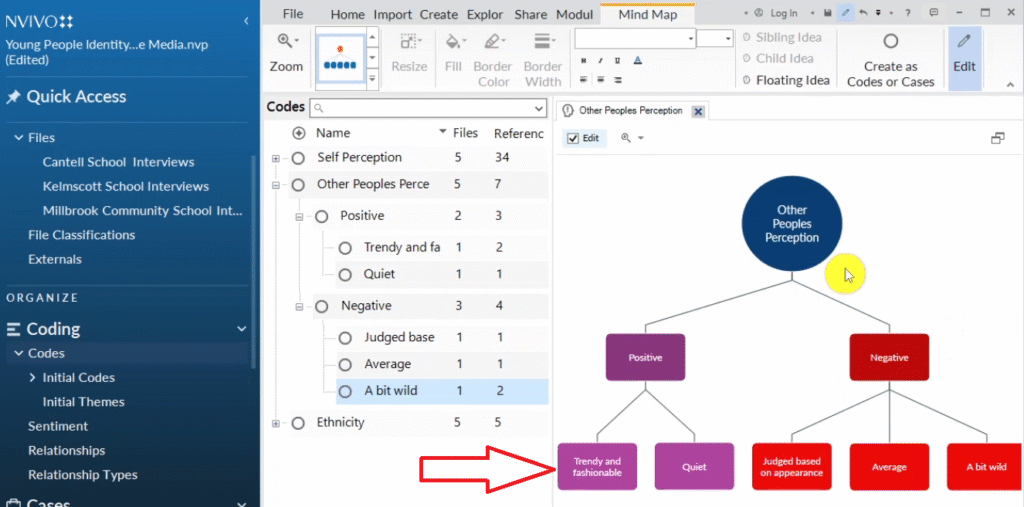
So that’s how we draw a mind map in N-Vivo.
We use these tools called child idea and sibling idea.
Sibling is on the same level, and of course child is below it.
Floating idea is an idea that is not attached to your mind map.
We can export this by pressing Control+Shift+E
This is another approach to visualize data in N-Vivo 14 through the use of a mind map.
Concept Maps
Let’s look at the seventh way of visualizing data in N-Vivo, which is through the use of concept maps.
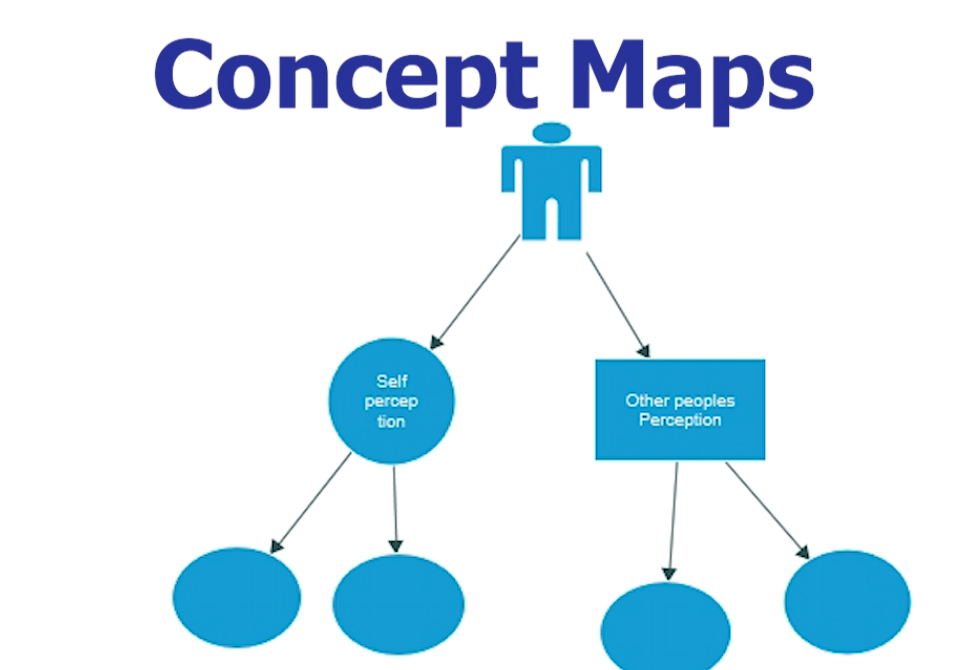
I’m on codes and I developed these major themes including ethnicity, self perception, and other people’s perception.
If we click on explore and go to maps and go to concept map, I would just want to represent the connection between the different themes using a concept map.
Like are they connected or how are they connected.
I can start with a circle and type in ethnicity in there.
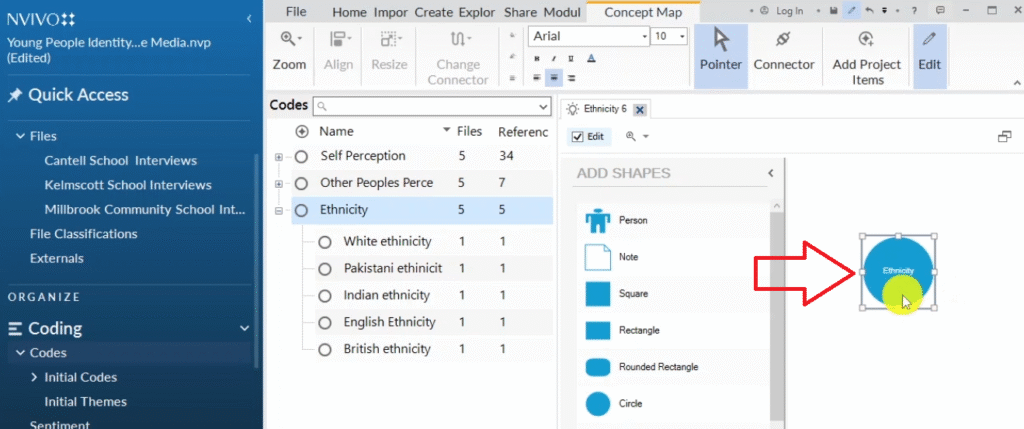
That’s one of my major themes, ethnicity.
Then I want to show how this theme is related to the other themes.
So I can come up with another shape to show a different theme, which is other people’s perception, and let us place it here.
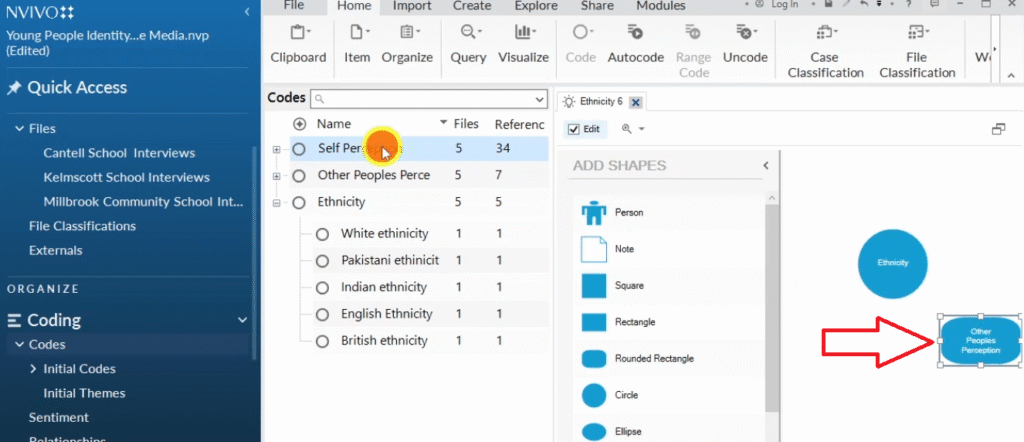
And then I can come up with another shape, which is like a novel shape showing a different beam or a different major which is self-perception.
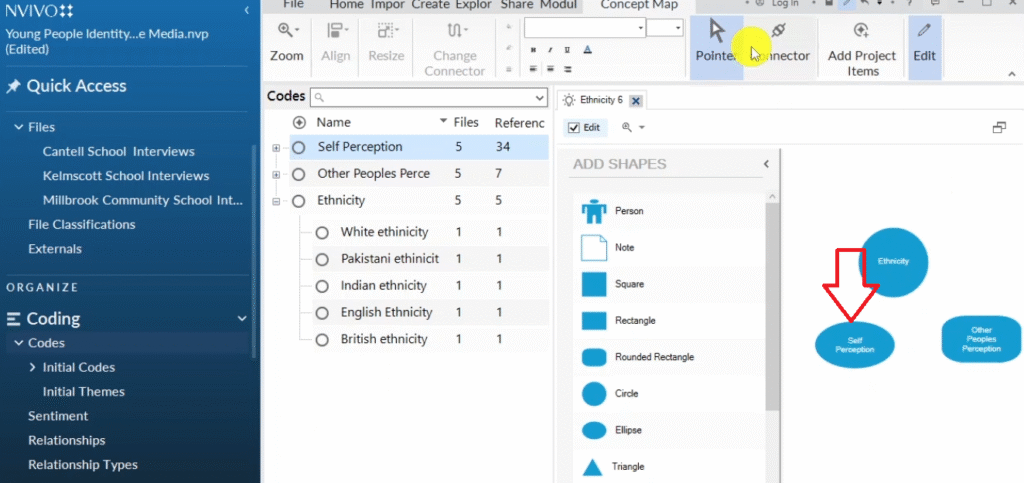
And then I can use these tool here called a connector.
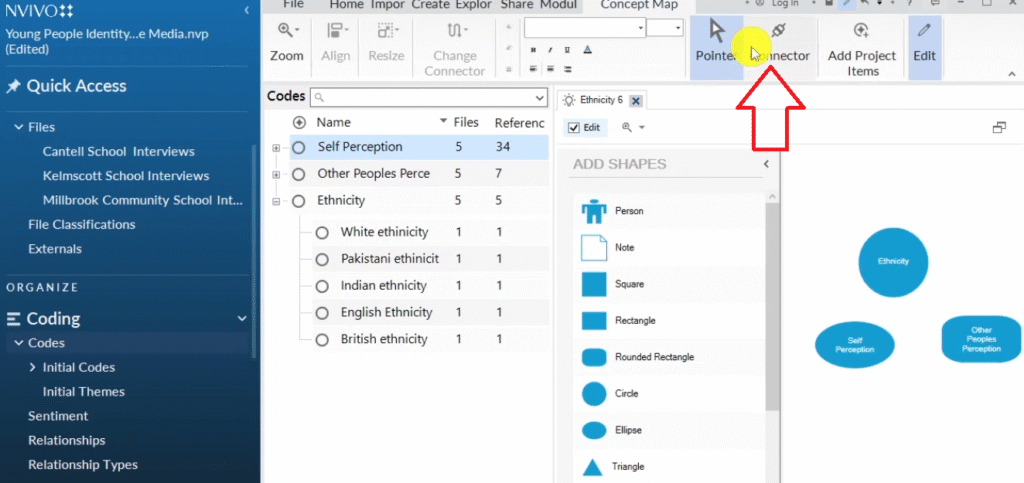
I want to show the connection between these three themes.
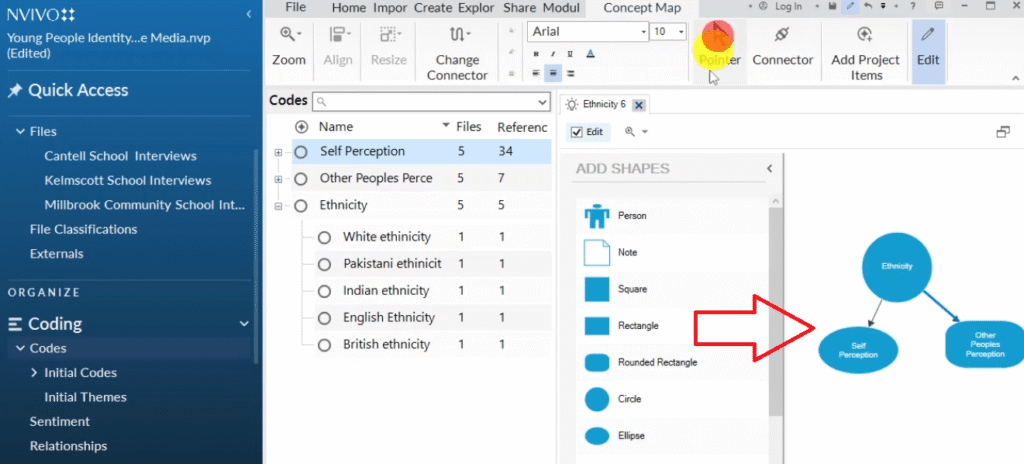
So ethnicity, a person can be of a certain ethnicity and they will have a self-perception, a way that they see they perceive themselves, which is self-perception and a way that other people’s view them, which is other people’s perception.
So that’s just an example of how you can use N-Vivo to show the link or the relationship between different ideas or different themes, and even to develop thematic maps.
Comparison Diagrams
Another way to visualize your data in N-Vivo is to use comparison diagrams to compare code.
Now, if we go to explore and we click on diagrams.
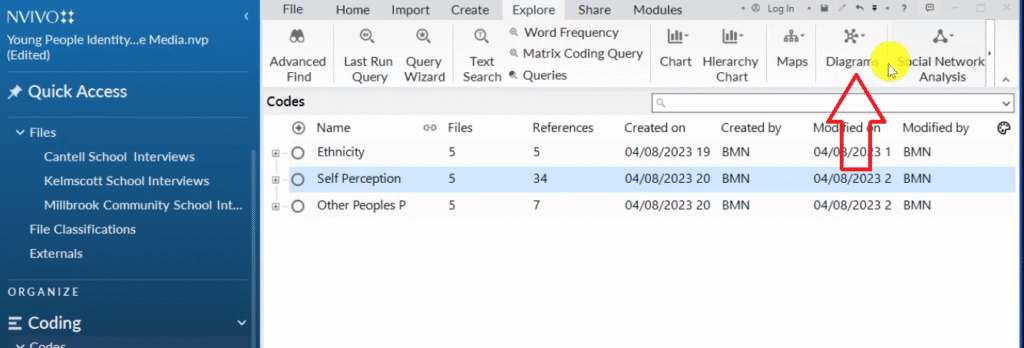
You can see like we have compare files, compare code, compare cases.
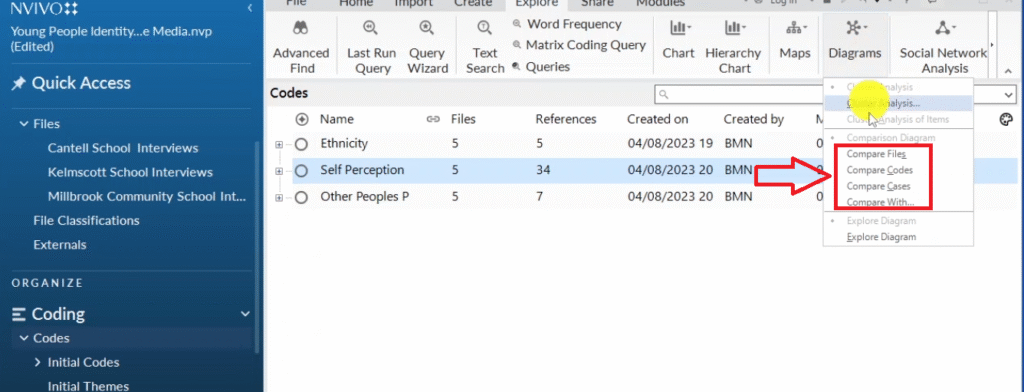
If I go to compare files and I want maybe to compare the different files, I select on two items, and I click Okay.
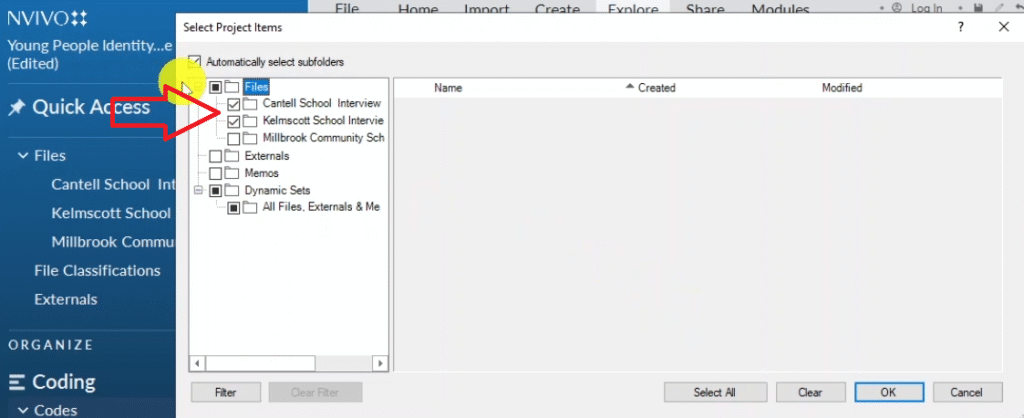
N-Vivo allows us only to compare two items at a time.
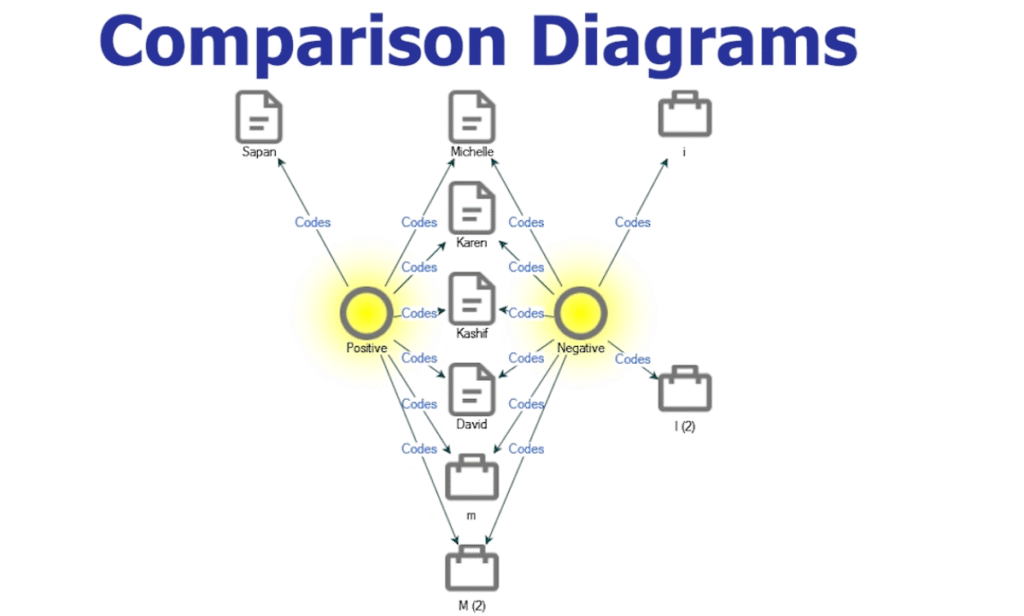
You can see there is this diagram that N-Vivo has just developed.
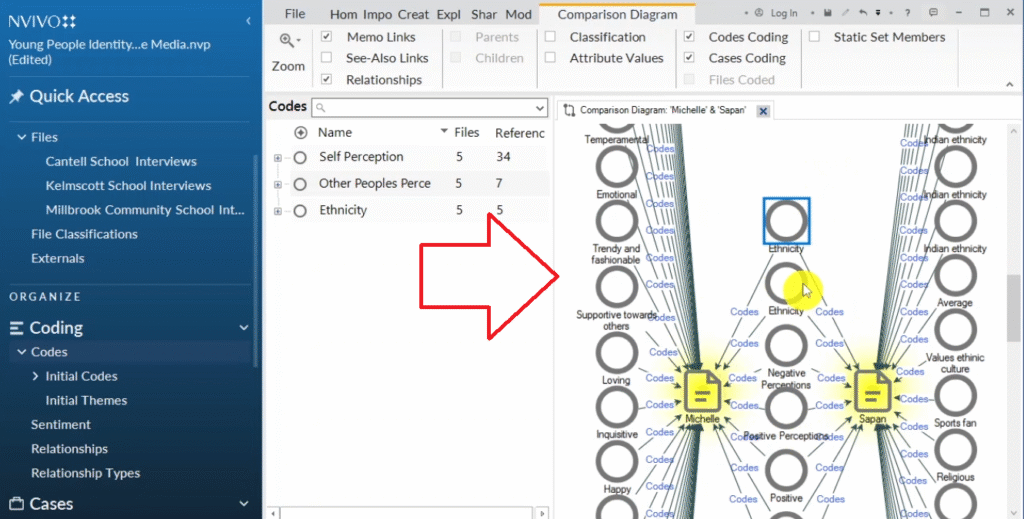
You can see like we have Michelle and Sapan, the two files, and the different codes that were made under them.
You can see, for example, both Michelle and Sapan talked about ethnicity, they talked about negative perceptions positive perceptions, at the center are the things that both of them talked about.
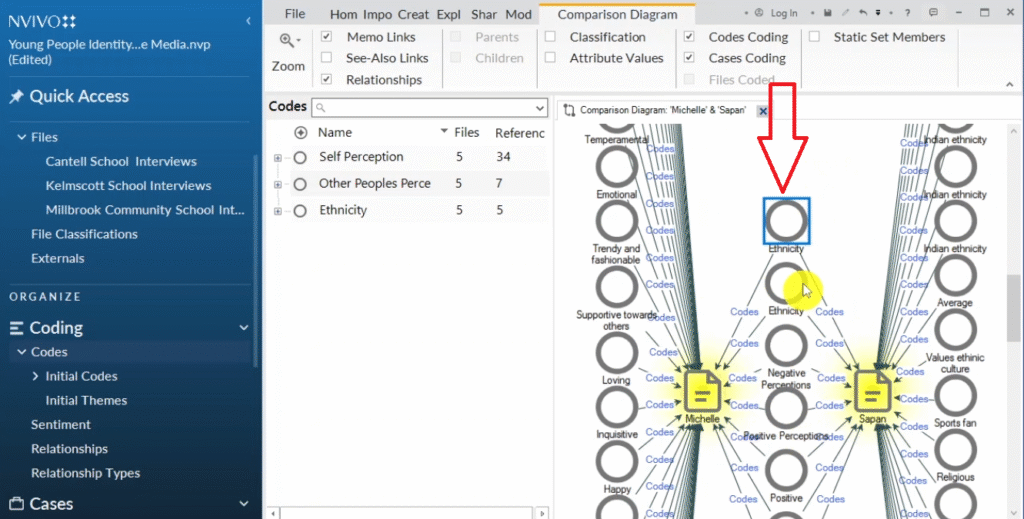
And then on the opposite side, you can see the different codes that each of the participants talk about.
So you can use such a comparison diagram to determine, did two participants speak about the same things or were similar codes associated with the two participants?
That is how you come up with a comparison diagram, which is another way to visualize your data in N-Vivo.
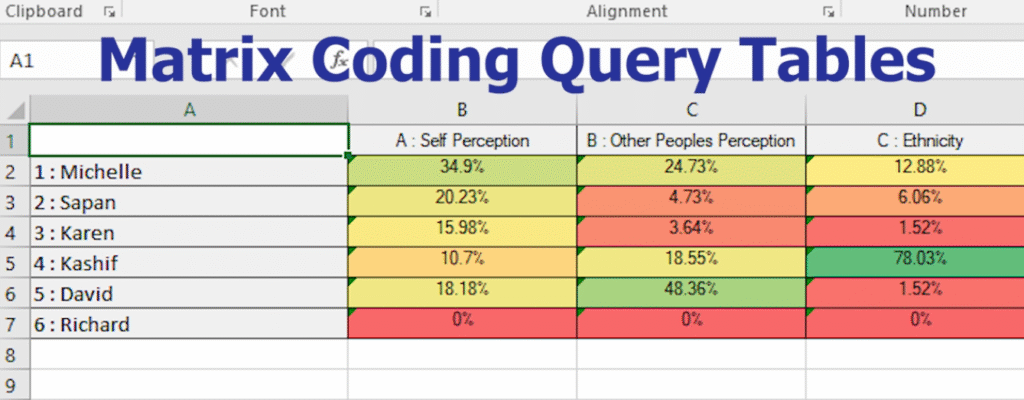
Matrix Coding Query Tables
The final way you can use to visualize your data is through the use of Matrix coding query tables.
Now, if we go to explore and click on the matrix coding query on the menu button.
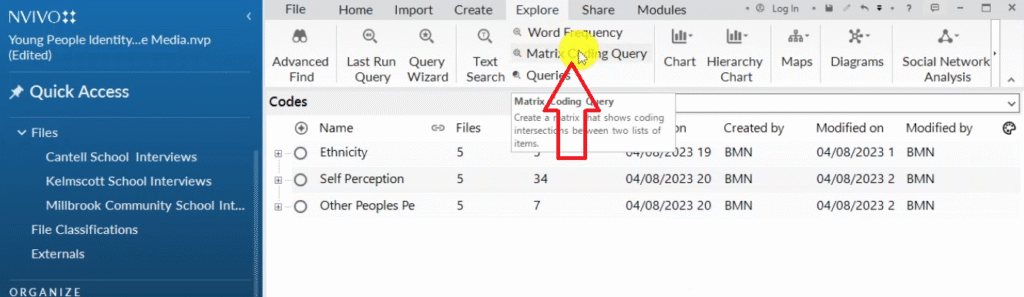
And press the plus sign in here.
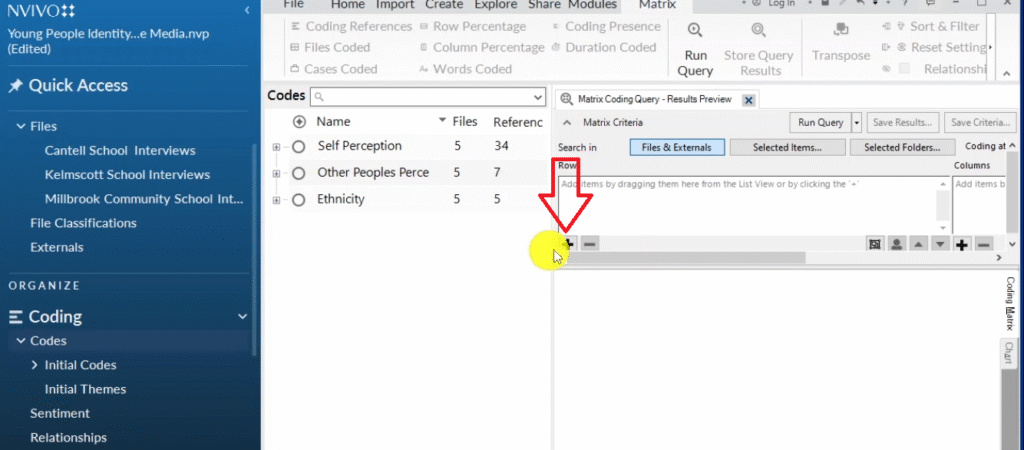
We have raws and we have columns.
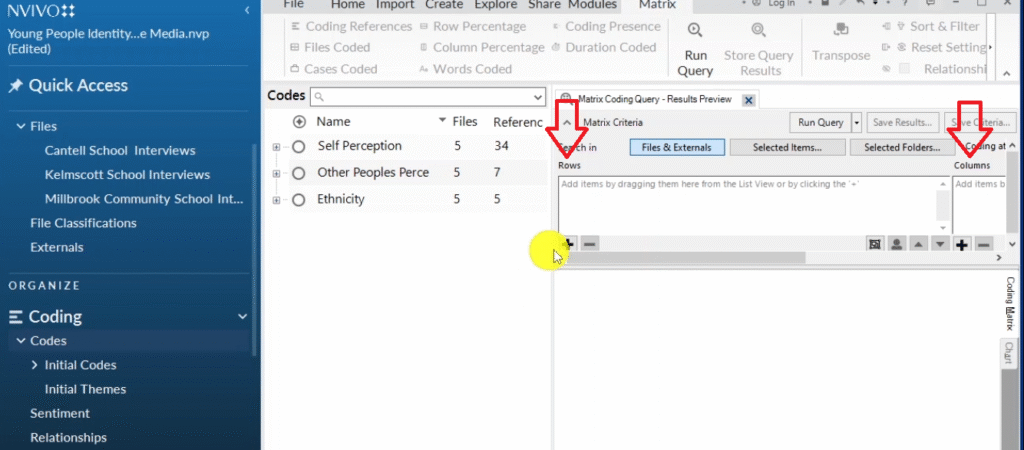
So what we want to put in our rows is the number of participants.
So I add these two participants.
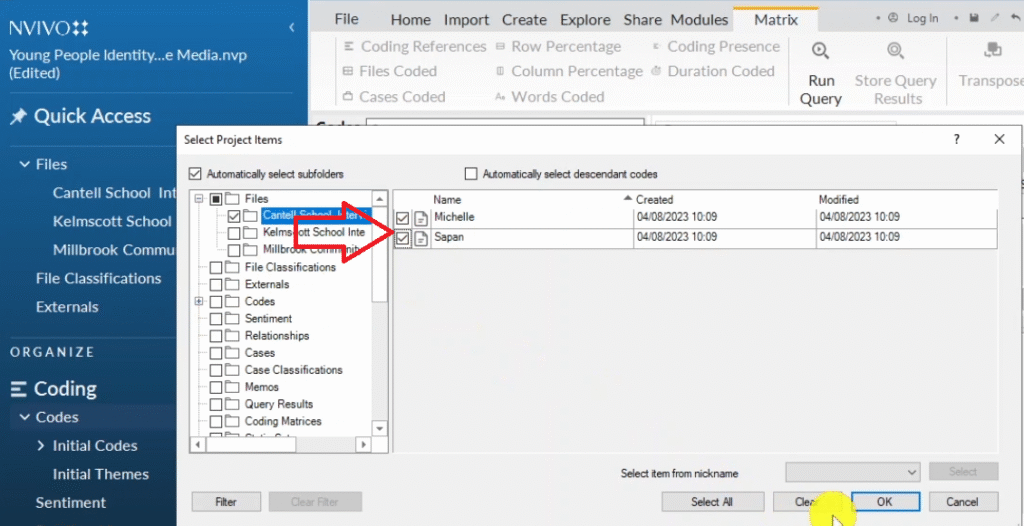
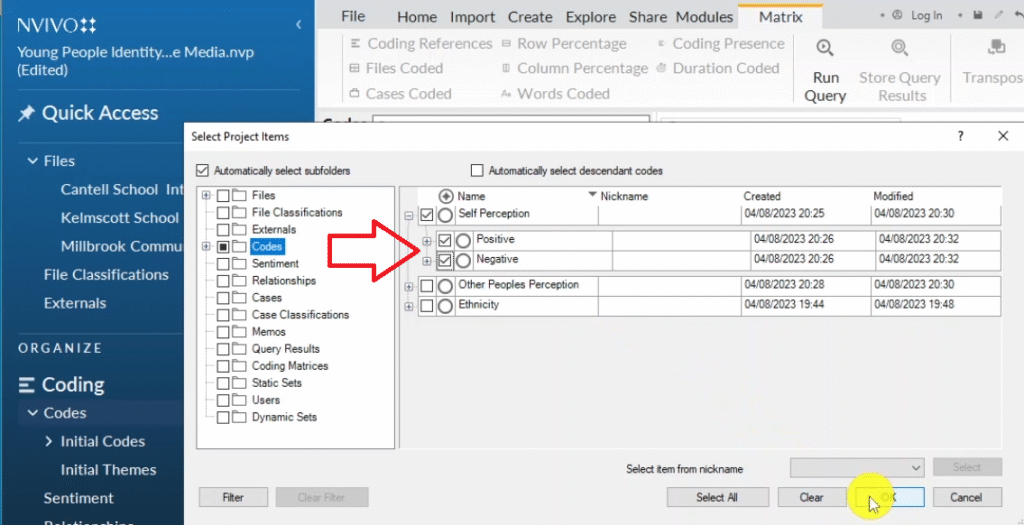
Then I select items and on the columns I want to represent self perception, both positive and negative.
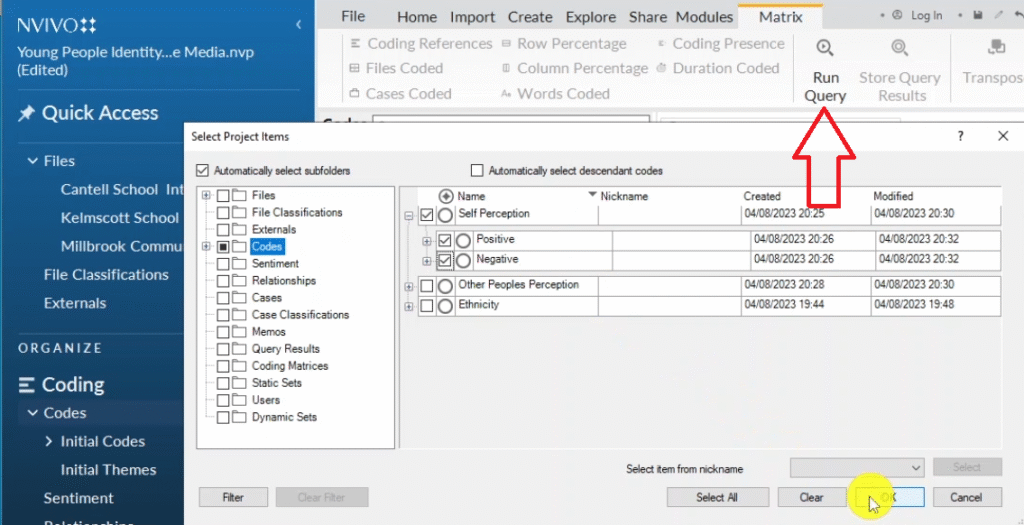
Then I go to this button called run query, and I run the query.
And you can see the different ways or the different perceptions or the different level of coding.
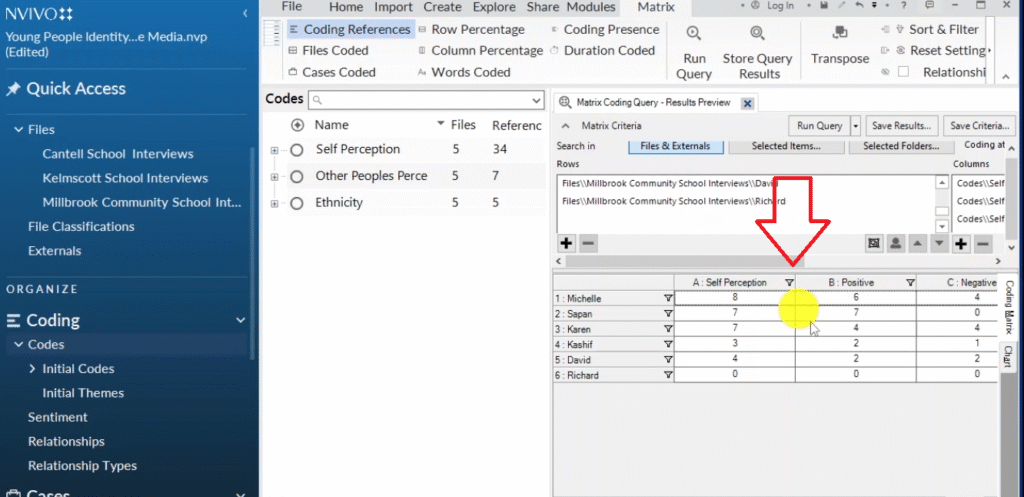
we can see this is the coding references for each major theme and sub theme.
Now, I normally like clicking on the column percentage, which represents the amount of references attributed to every participant.
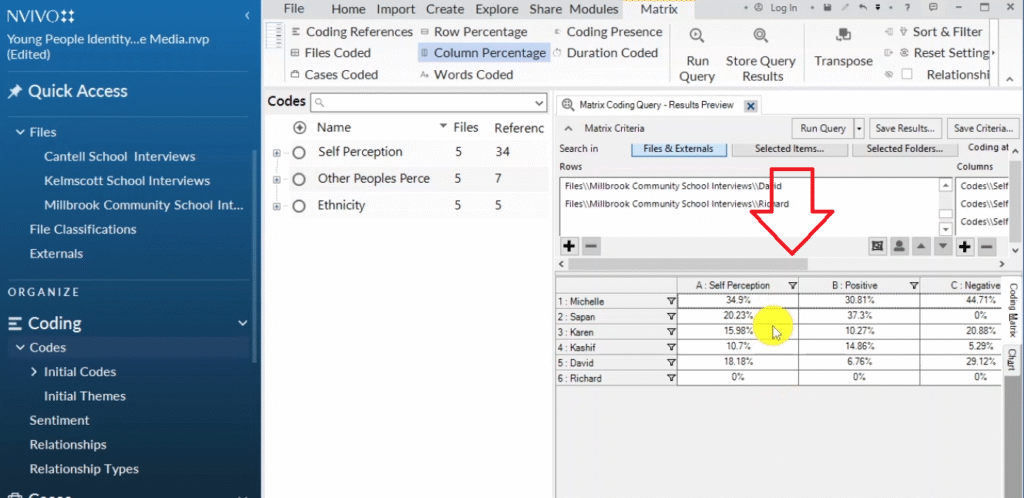
What do I mean?
For example:
- Michelle 34.9%
- Sapan 20.23%
- karen 15.98
- kashif 10.7
- David 18.8.
So David provided more information than Karen, and in thematic analysis, we do not worry about the percentage of references attributed to a participant.
No, we do not really deal with it quantitatively, but maybe you can use this data in your appendix.
That is the final way of visualizing your data in N-Vivo, which is coming up with a matrix coding query table to represent the number of words coded to each participant in a given major theme.
So those are the nine different ways you can visualize your data in NVivo 14