
Last Updated on 2 months ago by Bernard Mugo
If your supervisor keeps sending your findings chapter back with comments like “this feels descriptive” or “where’s your analysis,” it’s not because you didn’t work hard enough. It’s because your thematic analysis has one of five specific mistakes hiding in it. I’ve reviewed enough dissertations and interview datasets to know these five come up constantly — here’s exactly what they are, how to spot them in your own draft, and how to fix each one.
- What Is a Thematic Analysis Mistake, Exactly?
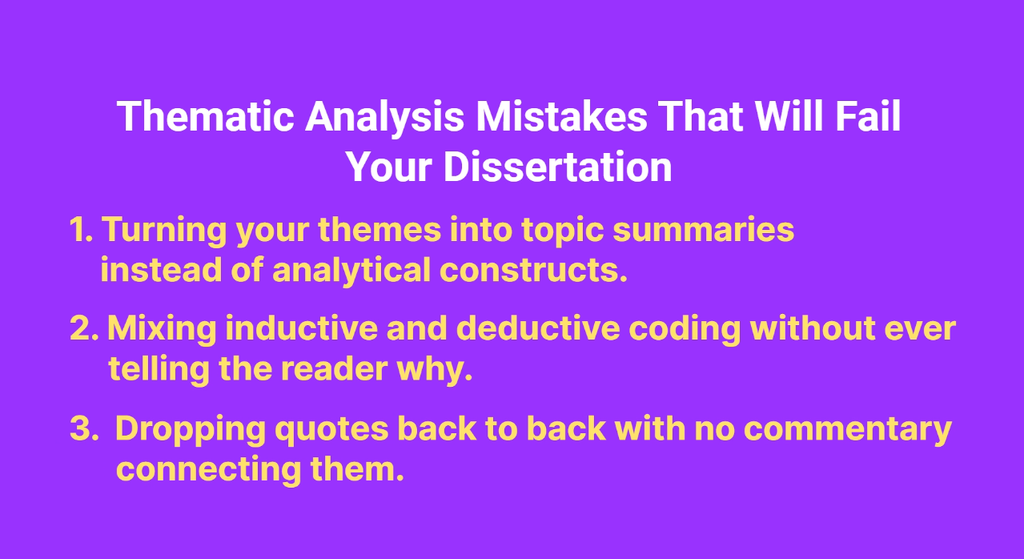
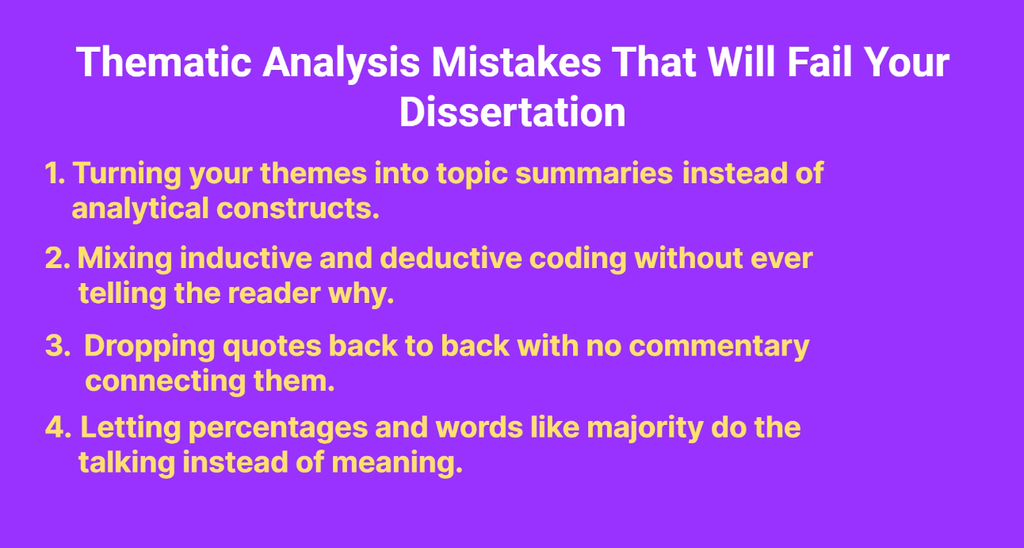
- Mistake #1: Turning Themes Into Topic Summaries Instead of Analytical Constructs
- Mistake #2: Writing Findings Question by Question Instead of as One Connected Analysis
- Mistake #3: Mixing Inductive and Deductive Coding Without Ever Telling the Reader Why
- Mistake #4: Dropping Quotes Back-to-Back With No Commentary Connecting Them
- Mistake #5: Letting Percentages and Words Like "Majority" Do the Talking Instead of Meaning
- What It Looks Like When You Fix All Five
- Frequently Asked Questions
- Key Takeaways
- Need Help With Your Thematic Analysis?
What Is a Thematic Analysis Mistake, Exactly?
A thematic analysis mistake is any point where your findings chapter stops interpreting the data and starts just describing it — turning a theme into a label, a quote into filler, or a number into “proof.” Examiners flag this as “descriptive, not analytical,” and it’s the single most common reason findings chapters come back for revision.
Mistake #1: Turning Themes Into Topic Summaries Instead of Analytical Constructs
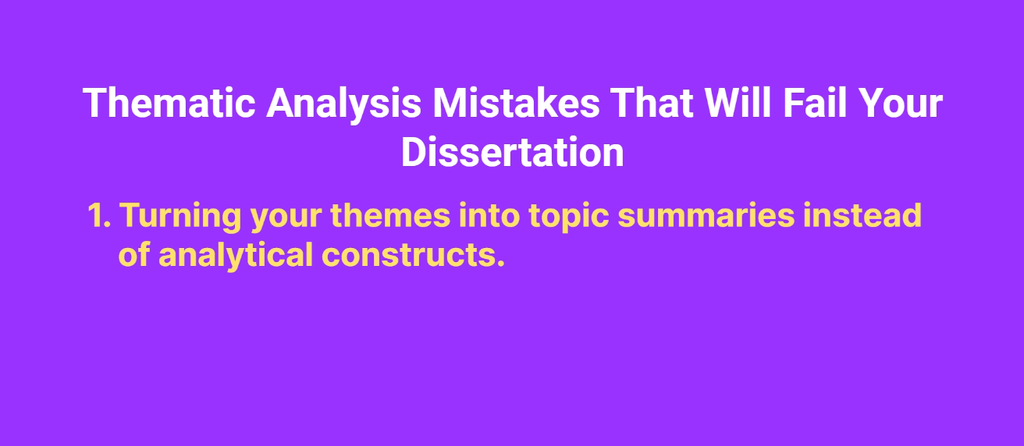
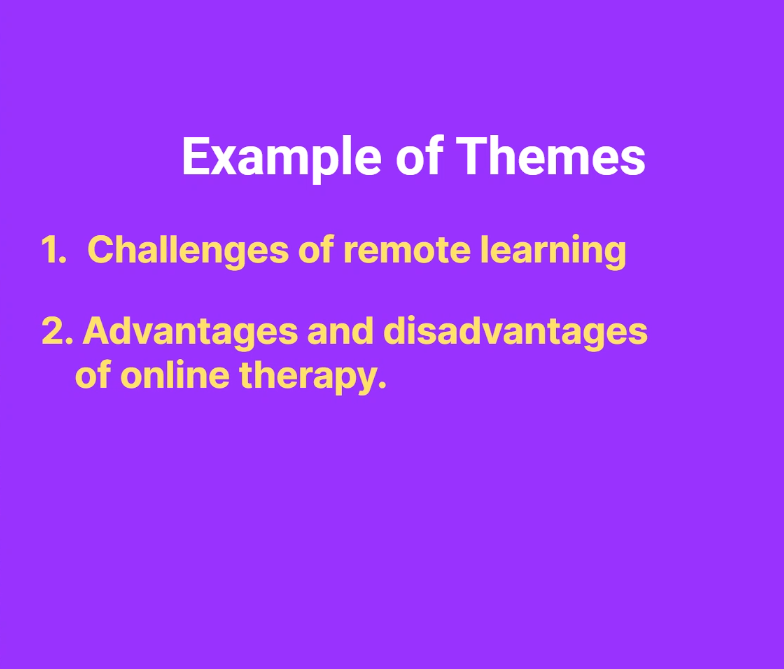
Here’s the trap. You finish coding, group your codes, and end up with theme names like “Challenges of Remote Learning” or “Advantages and Disadvantages of Online Therapy.” They sound fine — they read like proper academic headings. But they’re not themes. They’re topics wearing a theme’s clothes.
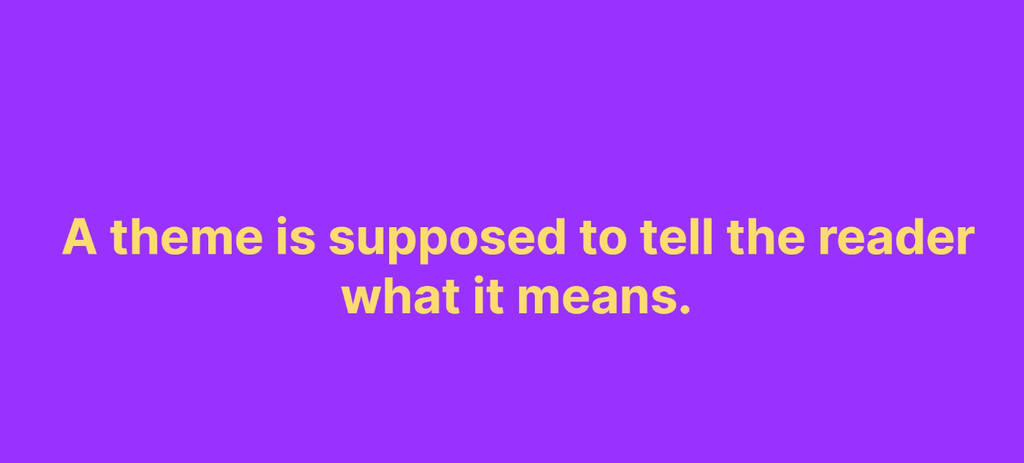
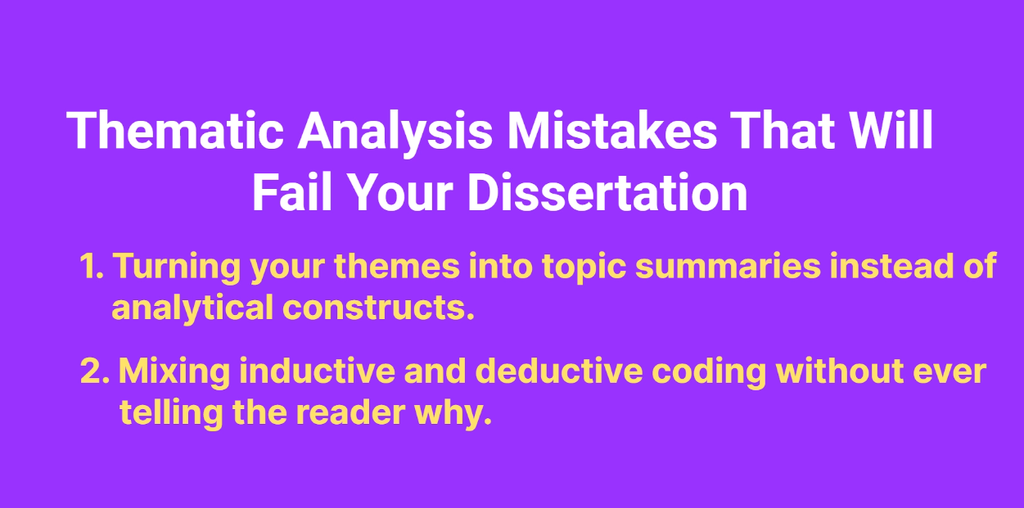
A topic tells the reader what participants talked about. A theme tells the reader what it means. That’s the whole difference, and it’s the difference between a pass and a major revision. This distinction sits at the core of Braun and Clarke’s reflexive thematic analysis framework, which argues that a theme needs a shared analytic meaning, not just a shared topic.
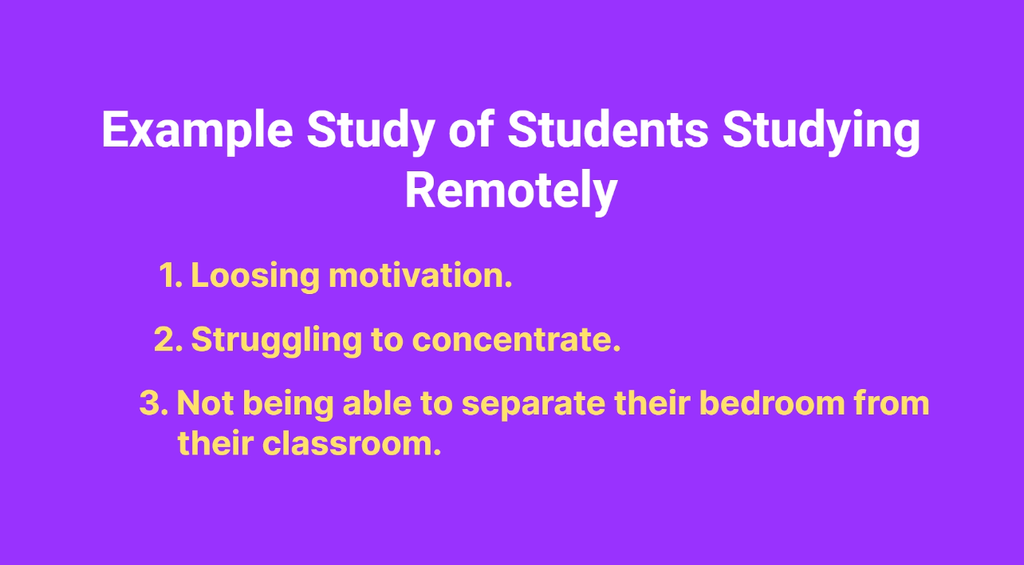
Anonymized example: in a study on university students studying remotely, participants kept mentioning losing motivation, struggling to concentrate, and not being able to separate their bedroom from their classroom.
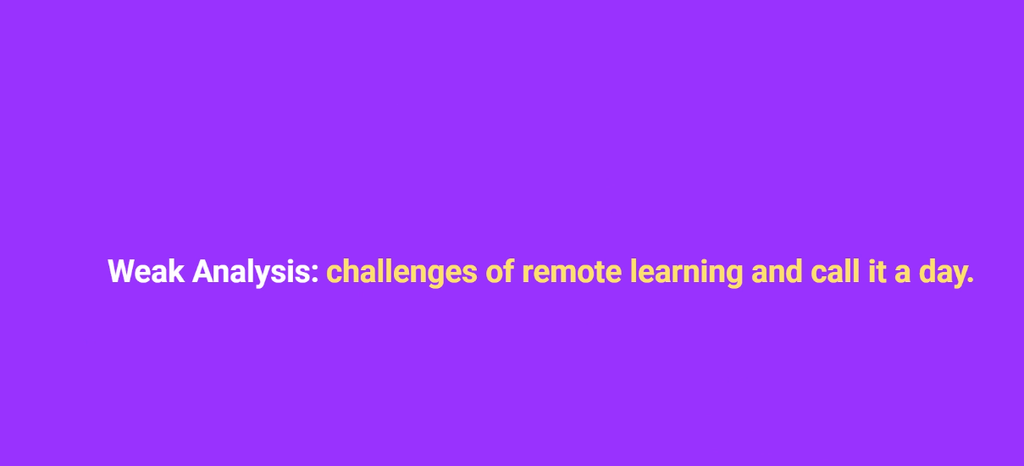
A weak analysis groups all of that under “Challenges of Remote Learning” and calls it a day.
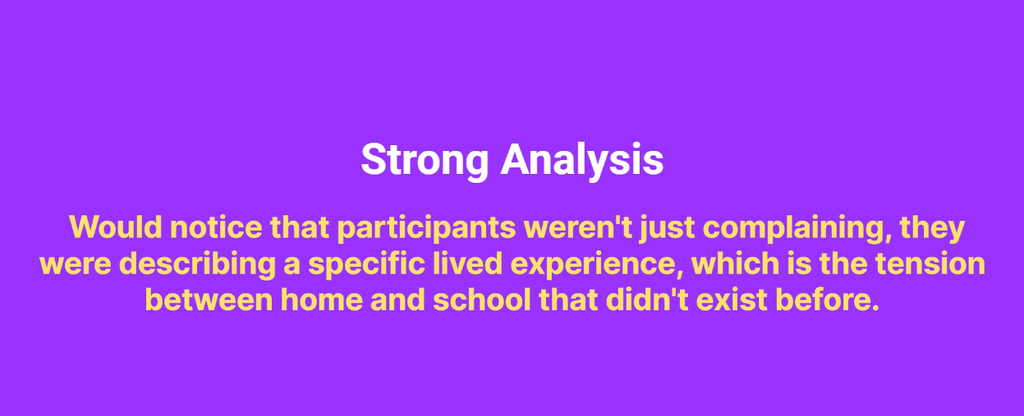
A strong analysis notices that participants weren’t just complaining — they were describing a specific, lived tension between home and school that didn’t exist before.
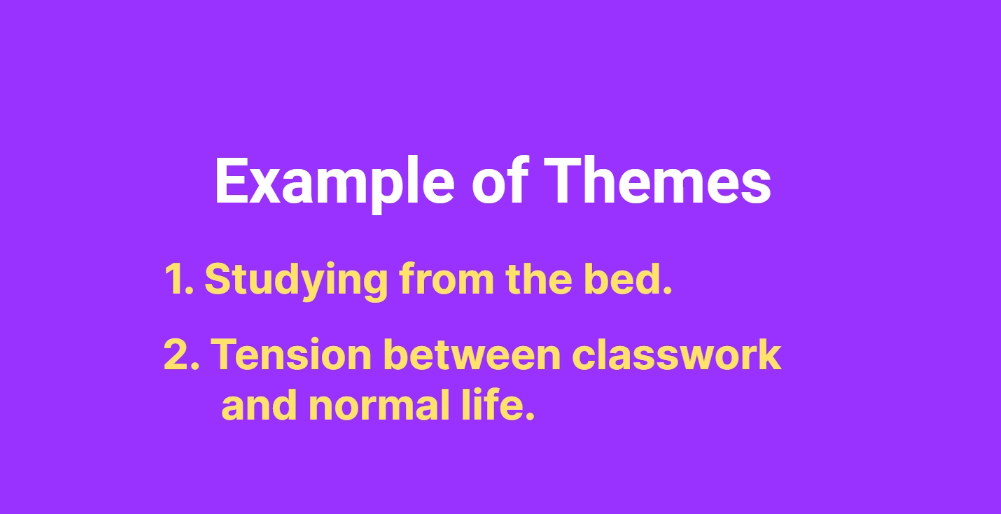
So instead of that generic subtitle, the theme becomes something like “Studying from the Bed” or “My Bedroom, My Classroom.” Those titles come straight from how participants actually talked about their experience.
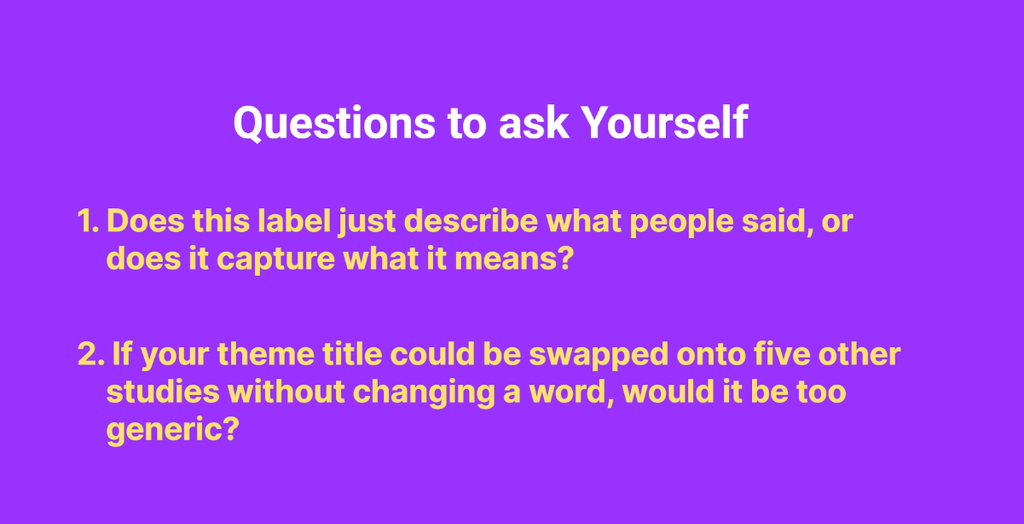
The fix: every time you name a theme, ask yourself one question — does this label just describe what people said, or does it capture what it means? If your theme title could be swapped onto five other studies without changing a word, it’s too generic.
Go back to your participants’ own language and build the label from there.
Mistake #2: Writing Findings Question by Question Instead of as One Connected Analysis
This is probably the most common mistake I see, especially with first-time NVivo or MAXQDA users. The findings chapter is literally structured as “Answers to Interview Question 3,” followed by a list of what each participant said, then “Answers to Interview Question 4,” same thing again.
The problem: qualitative research is supposed to treat your data as one connected whole, not a set of isolated answers. Your interview guide was a tool to collect data — it was never meant to be the skeleton of your findings chapter. When you organize the write-up around individual questions, you fragment patterns that actually run across the entire dataset, and your supervisor will call this exactly what it is: descriptive, not analytical.
For example, say your interview guide asked separately about a participant’s religious background, their individual beliefs, and where they learned about their faith. A weak write-up reports these as three separate sections mirroring the three questions. A stronger analysis looks across all three and asks how a person’s upbringing actually shapes which sources of religious knowledge they trust — a question that can only be answered by connecting responses across the whole transcript.
If you’re still deciding how to structure your interviews in the first place, my post on 7 interviewing mistakes new researchers must avoid covers how to build an interview guide that won’t trap you into this exact mistake later.
The fix: once coding is done, step back from your interview guide completely. Look at your codes and categories across the full dataset and ask what patterns show up regardless of which question triggered them. Your themes should cut across questions, not repeat them.
Mistake #3: Mixing Inductive and Deductive Coding Without Ever Telling the Reader Why
Quick refresher: deductive coding means you go in with codes already built from theory or your research questions. Inductive coding means you let codes emerge from the data itself.
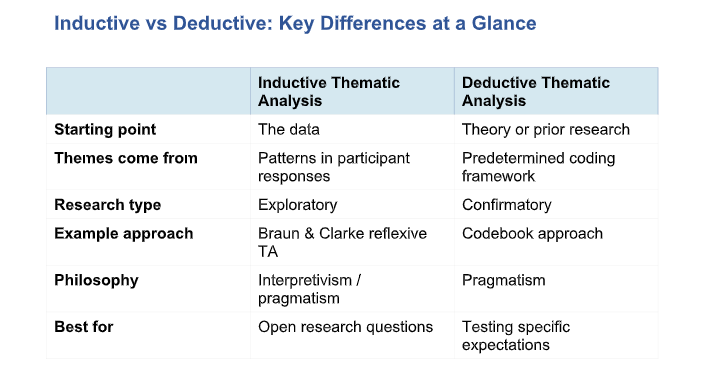
Most real dissertations use a mix of both, and that’s completely fine. The mistake isn’t blending them — it’s blending them silently.
Here’s what that looks like in practice. A student builds an initial coding framework from their literature review — deductive.
Then halfway through coding in NVivo or MAXQDA, new patterns show up that the literature never predicted, so new codes get added inductively. Nothing wrong so far. But in the write-up, the whole thing gets presented as one seamless, purely inductive discovery, with zero explanation of which codes came from theory and which came from the data.
This matters because transparency is one of the core markers of rigor in qualitative research.
If an examiner can’t tell which of your codes were theory-driven and which were data-driven, they can’t evaluate whether your interpretive decisions make sense. If you want to see this handled cleanly, my walkthrough on coding in MAXQDA and how to do thematic analysis in NVivo both show the deductive/inductive split explicitly.
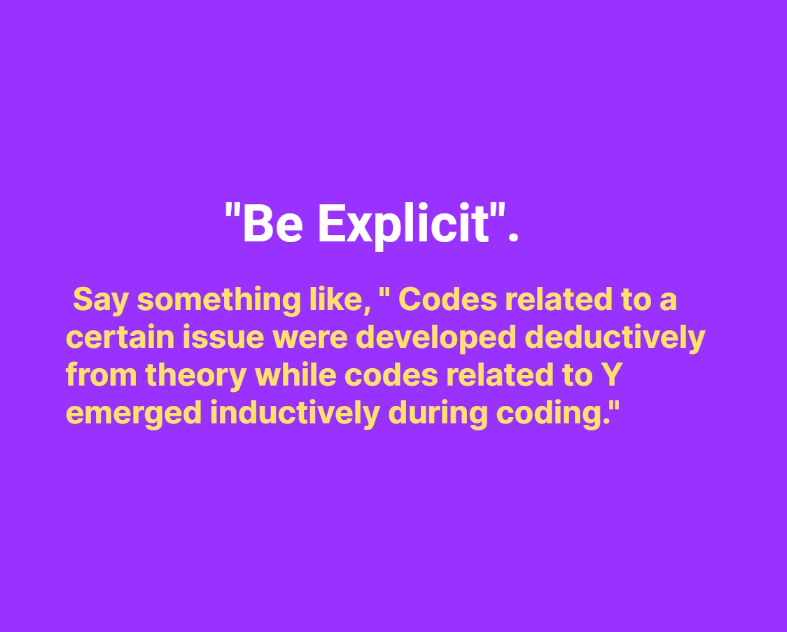
The fix: in your methodology, or even in your findings chapter, be explicit. Say something like, “Codes related to X were developed deductively from theory, while codes related to Y emerged inductively during coding.” One sentence signals to your examiner that you know exactly what you did and why.
Mistake #4: Dropping Quotes Back-to-Back With No Commentary Connecting Them
You’ve seen this one, maybe even in your own draft: a findings section that’s basically quote, quote, quote, with barely a sentence in between. It reads more like a transcript than an analysis.
A quotation is not standalone evidence. Its value only shows up once you explain what it means and why you picked it.
If you just stack quotes without commentary, you’re asking your reader to do your analytical work for you, and examiners won’t do that work — they’ll just mark it as descriptive.
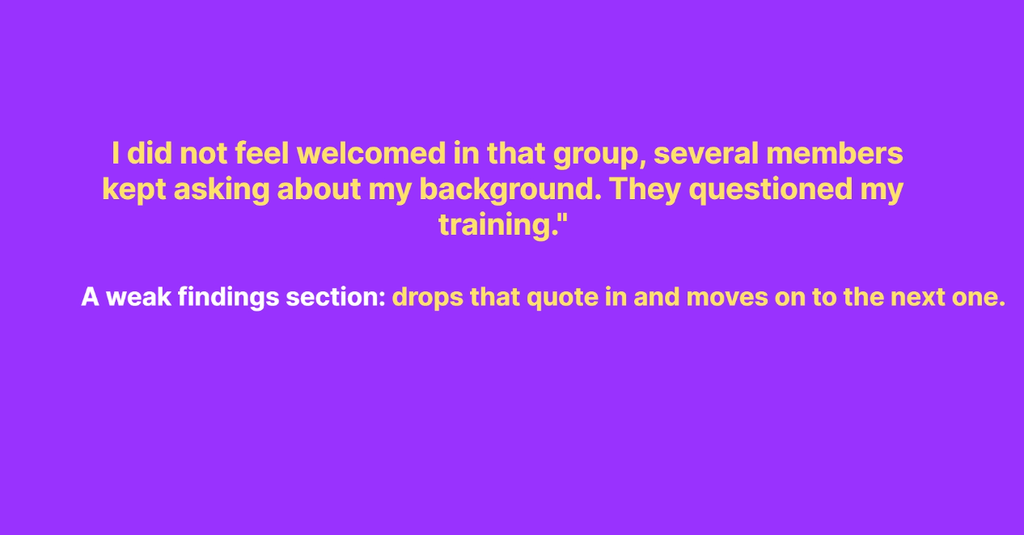
Anonymized example: a participant says, “I did not feel welcomed in that group. Several members kept asking about my background. They questioned my training.” A weak findings section drops that quote in and moves on.
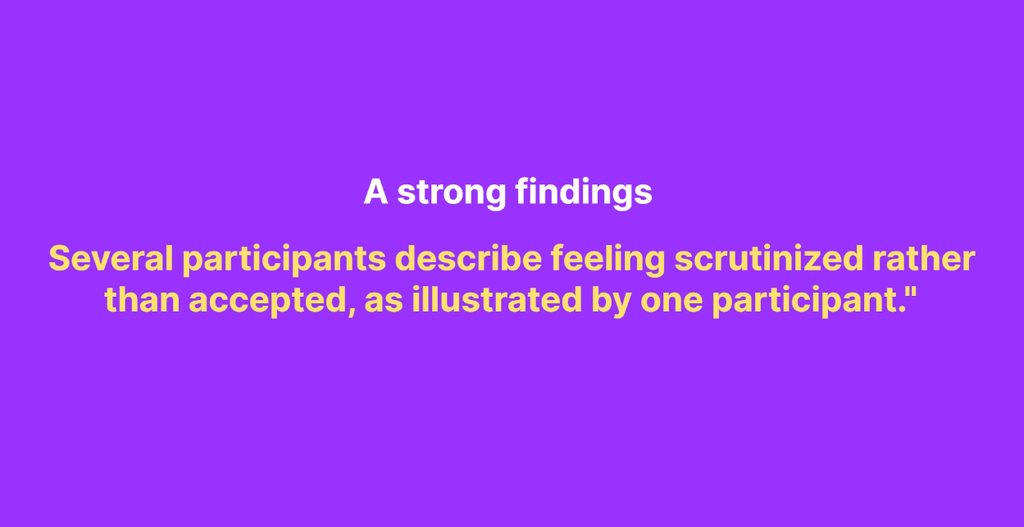
A strong findings section frames it first — “Several participants described feeling scrutinized rather than accepted, as illustrated by one participant” — gives the quote, then unpacks what that scrutiny meant for the participant’s sense of belonging.
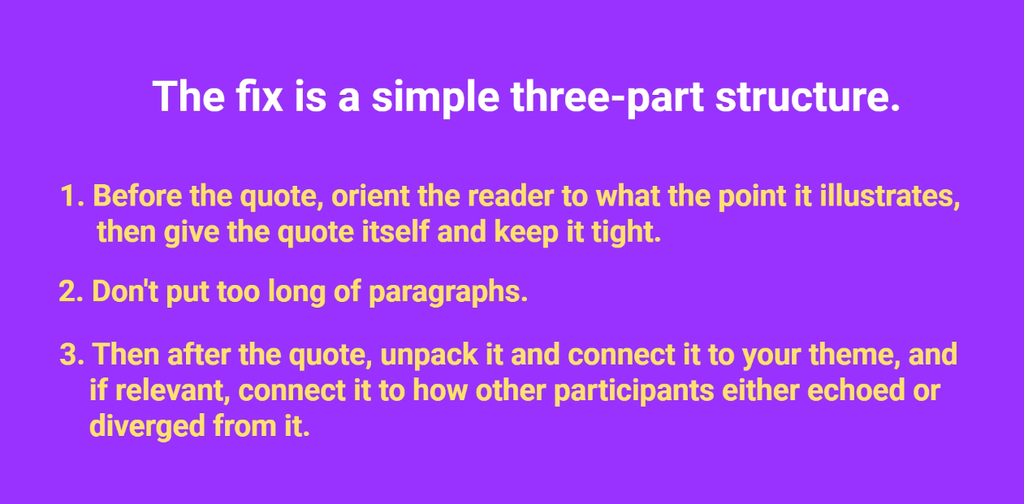
The fix: use a simple three-part structure. Before the quote, orient the reader to what point it illustrates. Give the quote itself, kept tight. After the quote, unpack it, connect it to your theme, and note whether other participants echoed or diverged from it. That before-quote-after pattern alone makes a findings chapter look dramatically more analytical.
Mistake #5: Letting Percentages and Words Like “Majority” Do the Talking Instead of Meaning
This one sneaks in because it feels rigorous. Writing “75% of participants attributed their experience to family background” or “the majority of participants felt this way” feels precise and scientific.
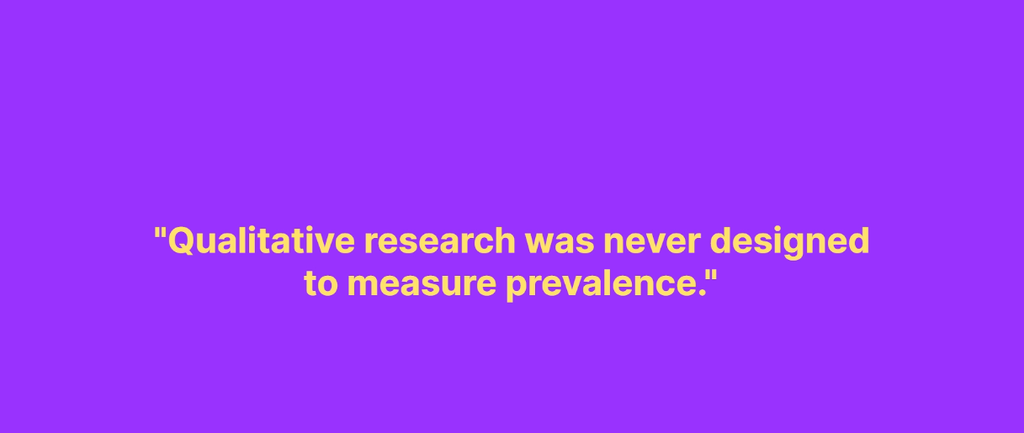
The problem: qualitative research was never designed to measure prevalence.
Your sample wasn’t randomly selected to represent a population, so those numbers don’t actually prove anything statistically — leaning on them signals to your examiner that you don’t fully understand the logic of qualitative inquiry. Worse, a theme that only five participants mentioned can be just as important as one that came up twenty times, if what it reveals is significant. Reducing your findings to who said what most often buries that insight. Scribbr’s guide to thematic analysis has a good plain-English breakdown of why qualitative evidence works this way.
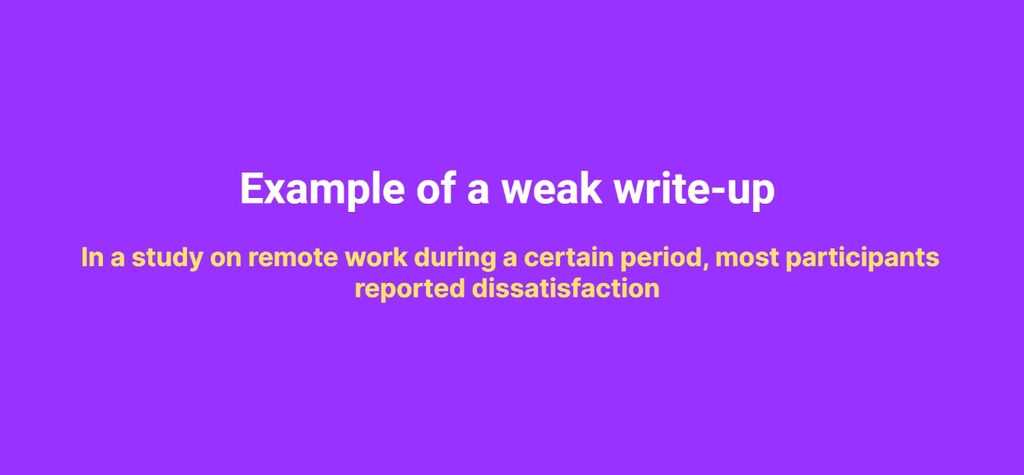
For example, in a study on remote work, a weak write-up says “most participants reported dissatisfaction.”
A stronger write-up notes that roughly two-thirds mentioned dissatisfaction, just to give the reader context, then spends real time unpacking how that dissatisfaction showed up differently — some describing isolation, others burnout, others tension between caregiving and work. The number is a small contextual detail. The meaning is the actual finding.
The fix: if you use a number at all, use it sparingly, to orient the reader, never as your main evidence. Avoid vague quantitative language like “majority” or “most” unless you immediately follow it with the texture of what that means. Your job is to explain how something was experienced, not how many people experienced it.
What It Looks Like When You Fix All Five
Picture that same remote-learning study, written the right way this time. The theme isn’t “Challenges of Remote Learning” anymore — it’s “Studying from the Bed.” The findings aren’t organized question by question; they’re organized around that lived tension across the whole dataset. The coding approach is stated openly: deductive here because it came from theory, inductive there because it emerged from the data. The quotes are framed before you read them, given in full, then unpacked after. And instead of leading with “75% of participants,” the write-up says roughly two-thirds, then spends real sentences showing what that experience actually felt like for the people living it. That’s the difference between a findings chapter that comes back with revise and resubmit, and one that sails through your defense.
Frequently Asked Questions
What’s the difference between a theme and a topic in thematic analysis?
A topic summarizes what participants talked about. A theme captures the shared meaning behind what they said. If your theme title could apply to almost any study on the subject, it’s a topic, not a theme.
Can I mix inductive and deductive coding in one dissertation?
Yes — most dissertations do. The mistake isn’t mixing them, it’s failing to tell your reader which codes came from theory and which emerged from the data.
Should I use percentages in a qualitative findings chapter at all?
Sparingly, and only for context — never as your main evidence. Qualitative samples aren’t built to measure prevalence, so lead with meaning and use numbers only to orient the reader.
Key Takeaways
- Themes are analytical constructs, not topic summaries — test every theme title against the “could this apply to five other studies” question.
- Structure your findings around patterns across the whole dataset, not question by question.
- State explicitly which codes were deductive and which were inductive.
- Frame every quote before it appears and unpack it after — never drop quotes back-to-back.
- Use percentages sparingly, for context only — meaning is the finding, not the frequency.
Need Help With Your Thematic Analysis?
I know some of you are reading this thinking, “I genuinely don’t have time to manually code 15 or 20 transcripts by hand.” I understand completely — that’s the exact problem most of my clients come to me with. This is why I offer a done-for-you qualitative data analysis service: I do the manual coding myself, develop the themes, create the visuals, and write the findings report, so your methodology actually matches what you write in your chapter. If you’d rather learn to do it yourself, I also offer one-on-one consulting where I walk you through the whole process — get in touch here.