

Last Updated on 4 weeks ago by Grace Nyambura
If you’ve just finished conducting your interviews and transcribing them, you’re at the point in the dissertation process that trips up most PhD students: turning a stack of transcripts into meaningful codes and themes.
This guide walks you through exactly how to do qualitative analysis of interviews in ATLAS.ti, using a real study as a worked example, so you can start coding your own transcripts today.
- What Is Qualitative Analysis of Interviews in ATLAS.ti?
- The Study We'll Use as an Example
- Getting Familiar With the ATLAS.ti Interface
- Step 1: Importing Your Interview Transcripts into ATLAS.ti
- Step 2: Understanding What "Coding" Actually Means
- Step 3: Familiarizing Yourself With the Transcript
- Step 4: Generating Initial Codes (A Real DEI Transcript Example)
- Why Color-Coding by Question Matters for Theme Development
- Common Mistakes to Avoid When Coding Interviews in ATLAS.ti
- What Comes Next After Initial Coding
- Frequently Asked Questions
- Key Takeaways
- Get Help With Your Qualitative Data Analysis
I’m Bernard Mugo, a qualitative research specialist. Over the past four years, I’ve helped more than 400 PhD students analyze semi-structured interviews and write the findings chapters of their dissertations and thesis.

What Is Qualitative Analysis of Interviews in ATLAS.ti?
Qualitative analysis of interviews in ATLAS.ti is the process of importing interview transcripts into the software and systematically labeling meaningful segments of text — a process called coding — so that patterns and themes can be identified across your dataset. ATLAS.ti supports this through a dedicated coding workspace, color-coded labels, and tools for tracing every code back to its original quotation.
The Study We’ll Use as an Example
To make this practical rather than abstract, I’ll work with two transcripts from a real study on DEI (Diversity, Equity, and Inclusion) initiatives in the manufacturing sector. The study was built around two research questions:
- How are diversity, equity, and inclusion initiatives implemented through HR practices in manufacturing organizations?
- What is the impact of DEI initiatives on organizational performance in manufacturing organizations?
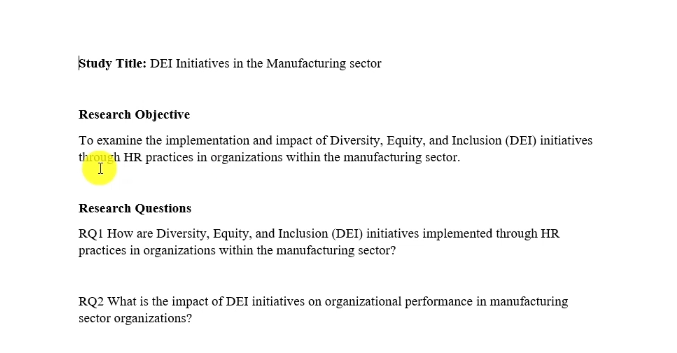
We’ll use these transcripts to demonstrate how coding actually happens inside ATLAS.ti, line by line.
Getting Familiar With the ATLAS.ti Interface
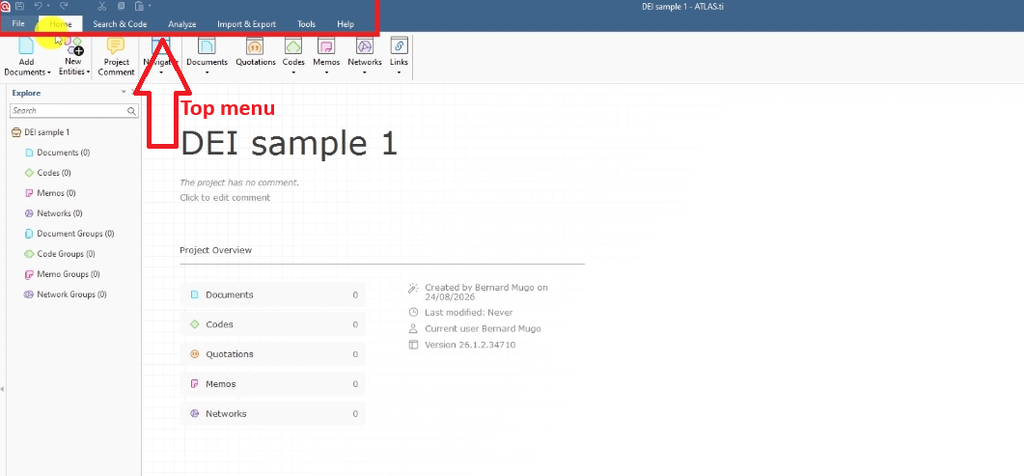
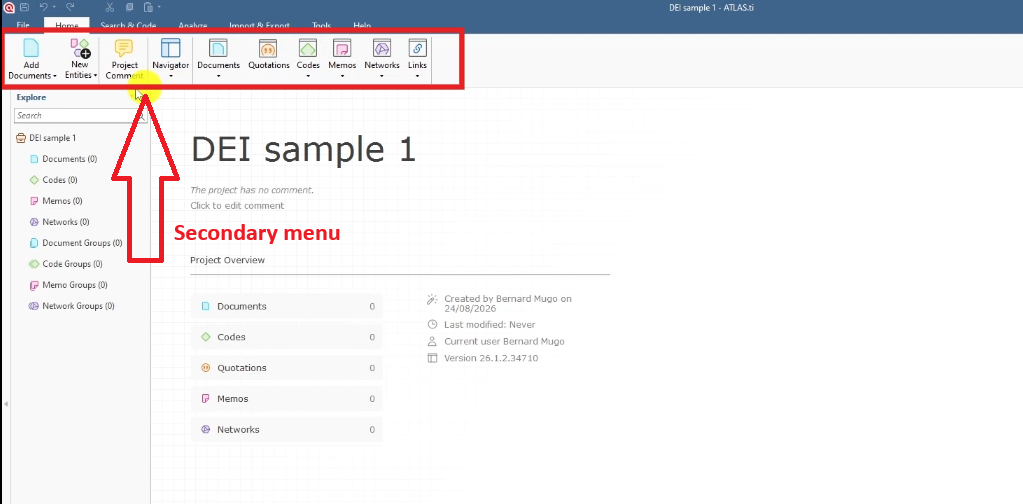
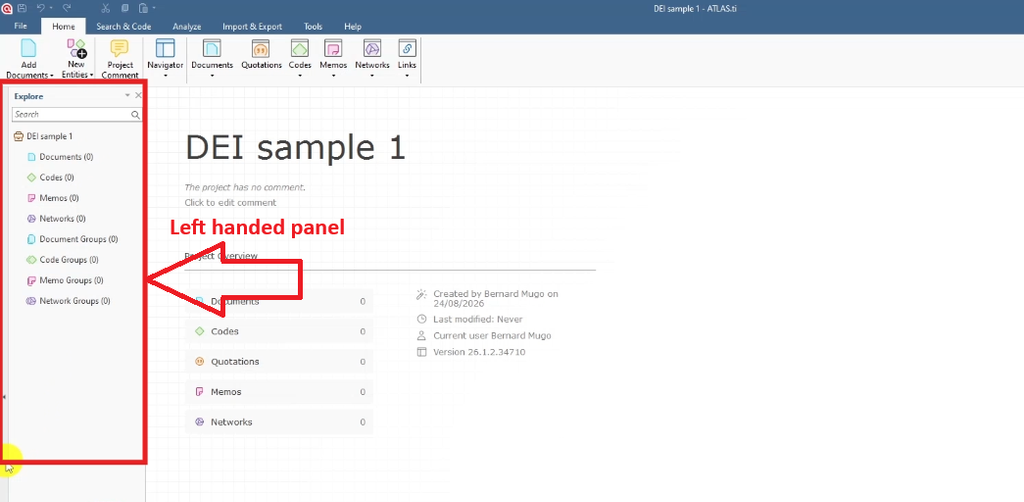
Before coding, it helps to know your way around the workspace. The ATLAS.ti research hub documents the full interface, but here’s the short version. ATLAS.ti is organized into three main areas:
- The top menu bar — File, Home, Search, Encode, Analyze, Import & Export, Tools, and Help.
- A secondary menu — where you add documents, entities, comments, and navigate between Documents, Quotations, Codes, Memos, Networks, and Links.
- The left-hand panel — which organizes your project into Documents, Codes, Memos, Networks, Document Groups, and Code Groups.
Once you’re oriented, the next step is getting your interview transcripts into the software.
Step 1: Importing Your Interview Transcripts into ATLAS.ti
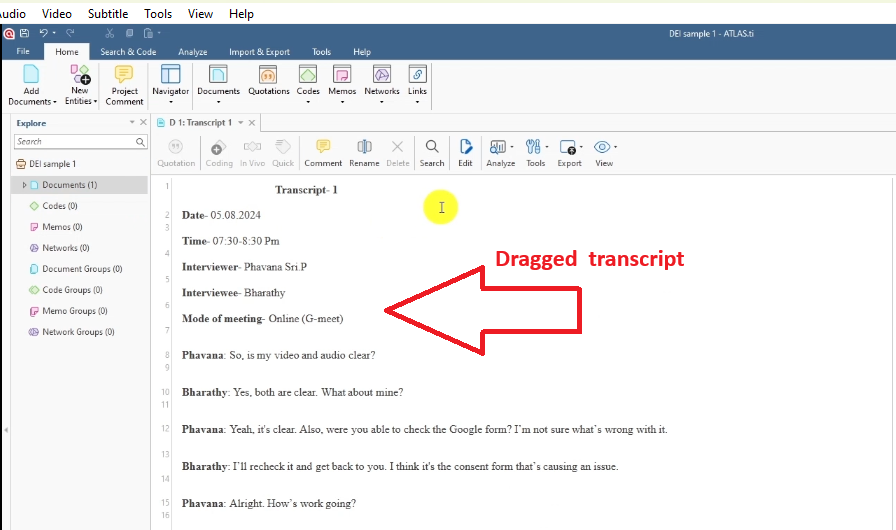
Start by creating a new project in ATLAS.ti. Importing transcripts is as simple as dragging and dropping your files into the Documents section. If several transcripts belong together — say, all interviews from the same participant group — right-click to create a document group and link them. In this example we’re working with two standalone transcripts, so grouping isn’t necessary.
To open a transcript, double-click it. This brings up the full text, ready for coding.
Step 2: Understanding What “Coding” Actually Means
Before highlighting a single word, it’s worth pausing on what a code actually is. A code is a label or interpretive statement attached to any piece of information that’s important to your research questions. That’s it. The skill lies in deciding what counts as important and phrasing the label in a way that captures the meaning concisely.

The Braun and Clarke Six-Step Framework
Most researchers approach thematic analysis inductively — letting codes and themes emerge from the data rather than defining them in advance. The most widely used framework for this is Braun and Clarke’s (2006) six-step approach to thematic analysis:
- Familiarizing yourself with the data
- Generating initial codes
- Generating themes
- Reviewing and refining themes
- Writing definitions and descriptions for themes
- Producing the final report
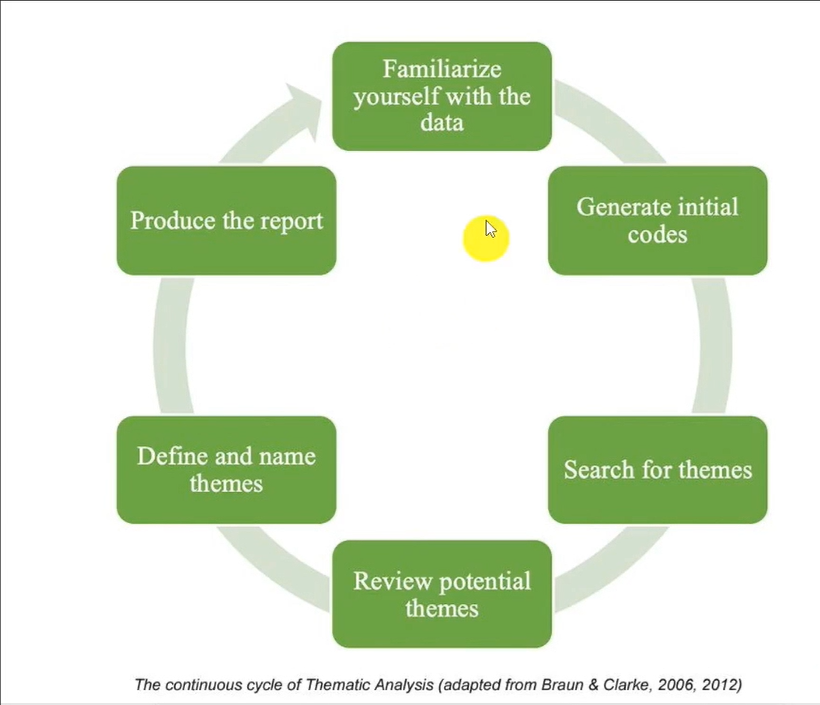
This guide focuses on the first two steps of thematic analysis in ATLAS.ti — familiarization and initial coding — since that’s where most students get stuck first. If you’d rather work through the full six steps using a structured coding framework, my post on Saldana’s method for thematic analysis in ATLAS.ti covers steps three through six in detail.
Step 3: Familiarizing Yourself With the Transcript
Familiarization means reading through the transcript line by line before you start coding. Don’t skip this step. Rushing straight to highlighting text without first understanding the flow of the interview — see my guide on designing a semi-structured interview guide if you haven’t collected your data yet — leads to fragmented, inconsistent codes later on.
Step 4: Generating Initial Codes (A Real DEI Transcript Example)
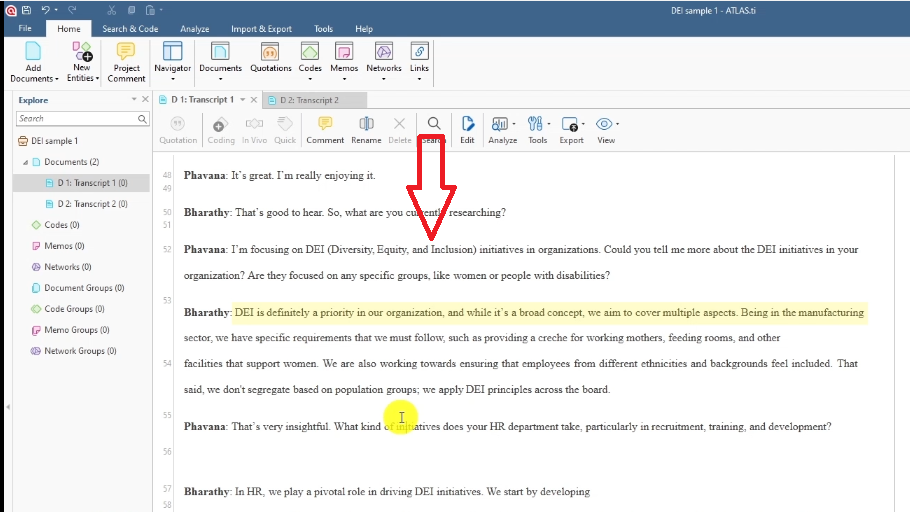
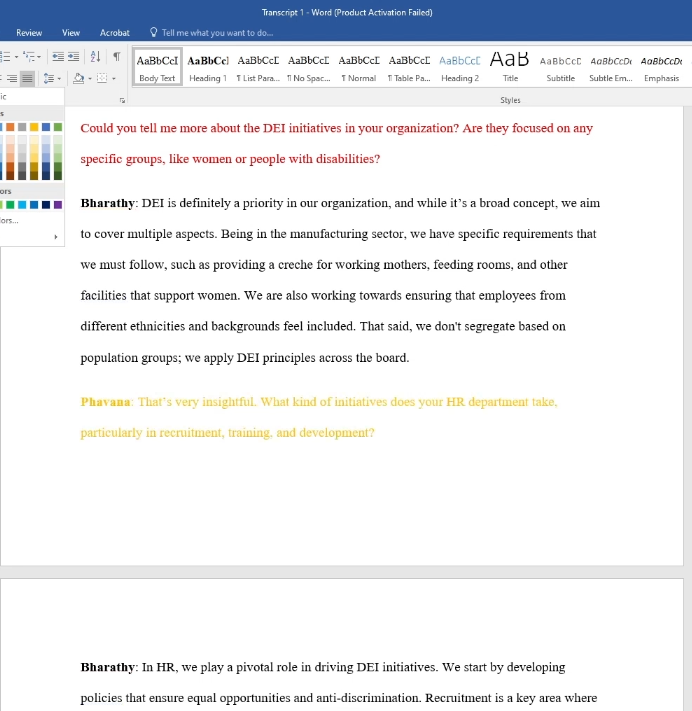
Here’s where the actual coding begins. In our example transcript, the researcher (Pavana) asks the participant a series of questions about DEI initiatives. A simple but effective organizing trick is to color-code your codes by the question they respond to — marking every code from question one in red, question two in green, question three in blue, and so on. This makes it easy to trace codes back to their source later when you’re building themes and checking for data saturation.
Coding Question One
The first question asked: “Could you tell me more about DEI initiatives in your organization? Are they focused on any specific groups like women or people with disabilities?”
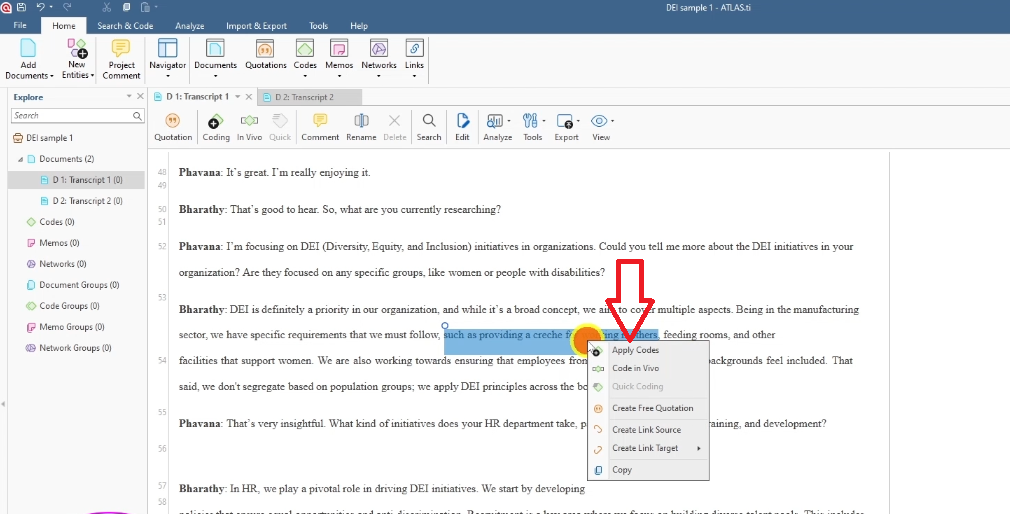
The participant responded that DEI is a broad priority in their organization, mentioning specific practices like providing a crèche for working mothers, feeding rooms, and other facilities that support women, as well as efforts to ensure inclusion across ethnicities and backgrounds without segregating by population group.
Reading through this response, several codes emerge:
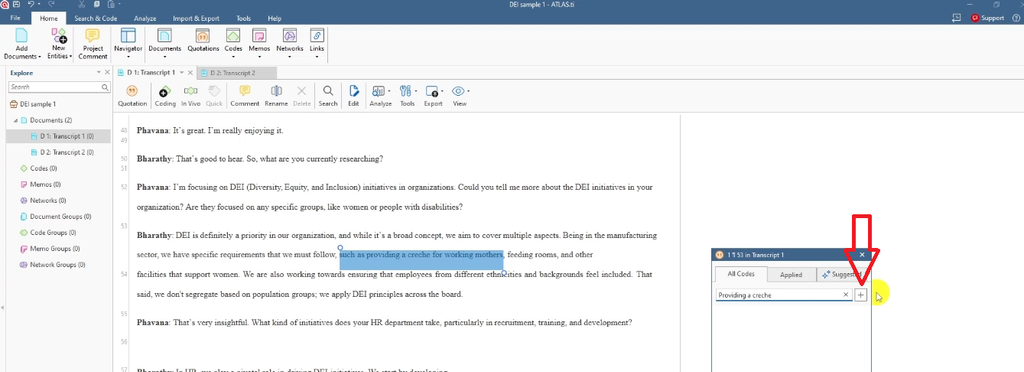
- Providing a crèche (for working mothers)
- Feeding rooms and other facilities that support women
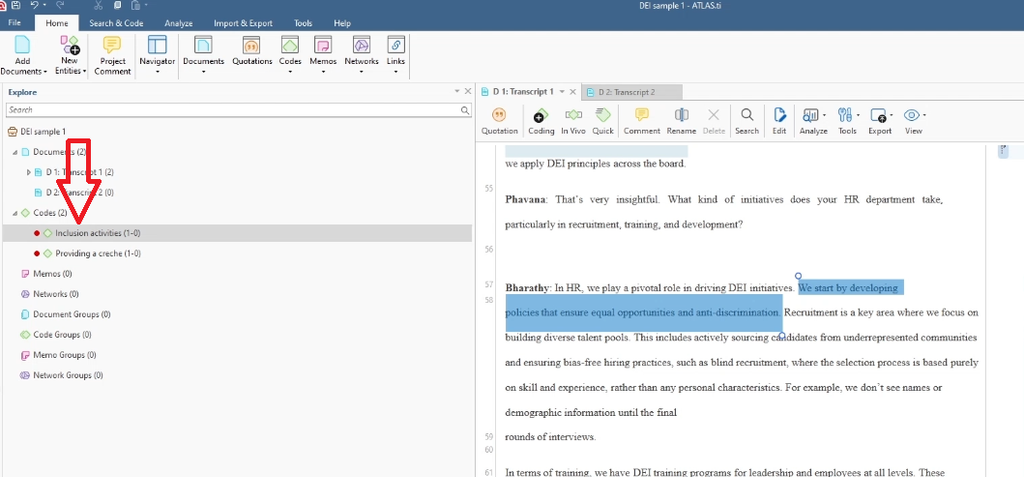
- Inclusive activities (covering efforts around ethnicity and background inclusion)
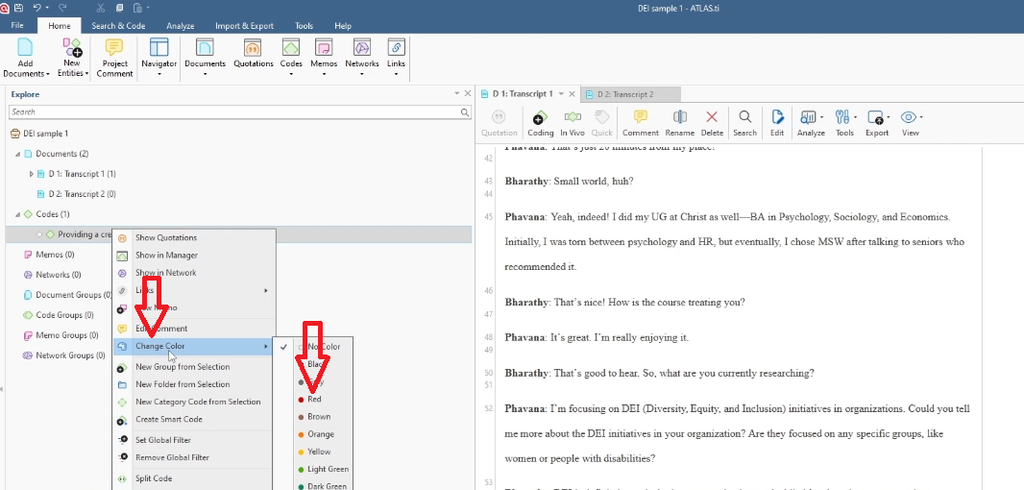
In ATLAS.ti, you create each of these by highlighting the relevant text, right-clicking, and selecting Apply Codes. Once a code exists, right-click it again to assign it a color — in this case, red, since these all came from question one.
Coding Question Two
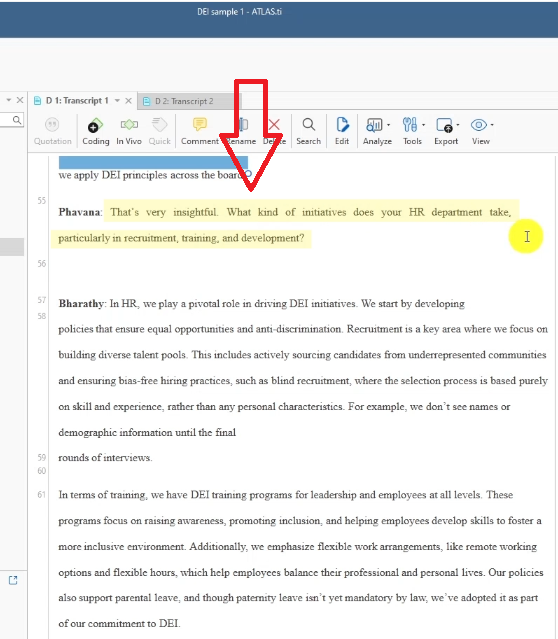
The second question asked: “What kind of initiatives does your HR department take, particularly in recruitment, training, and development?”
This response was longer and covered several distinct DEI practices: developing policies for equal opportunity and anti-discrimination, building diverse talent pools through targeted recruitment, using blind recruitment (where names and demographic details are hidden until final interview rounds), running DEI training programs for leadership and staff, and supporting flexible work arrangements and parental leave.
Reading through it carefully, this single answer breaks down into several codes:
- Implementing equal opportunity and anti-discrimination policies
- Recruiting candidates from underrepresented communities
- Adopting bias-free hiring practices (e.g., blind recruitment)
- Implementing DEI training programs
- Raising awareness, promoting inclusion, and building inclusive skills
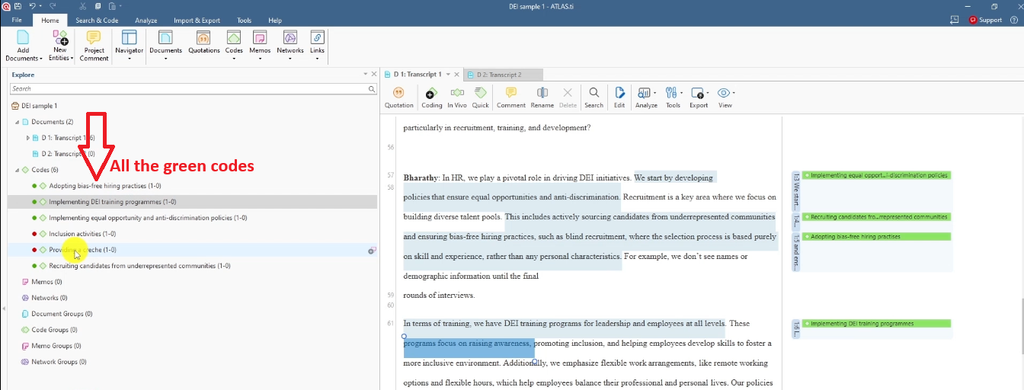
Each of these gets marked green in ATLAS.ti, since they all trace back to question two. Notice how each code stays close to what the participant actually said, while still condensing it into a short, reusable label — that’s the balance you’re aiming for when developing a coding framework.
Why Color-Coding by Question Matters for Theme Development
This might seem like a small organizational detail, but it pays off later. When you move into generating themes (step three of the Braun and Clarke framework), you’ll need to see patterns across codes and trace them back to their origin in the interview. Color-coding by question — or by any other logical grouping relevant to your study — makes that process dramatically faster, especially once you’re coding multiple transcripts with dozens of codes.
You can double-click any code in ATLAS.ti at any point to see every quotation linked to it, along with exactly where it appears in the transcript.
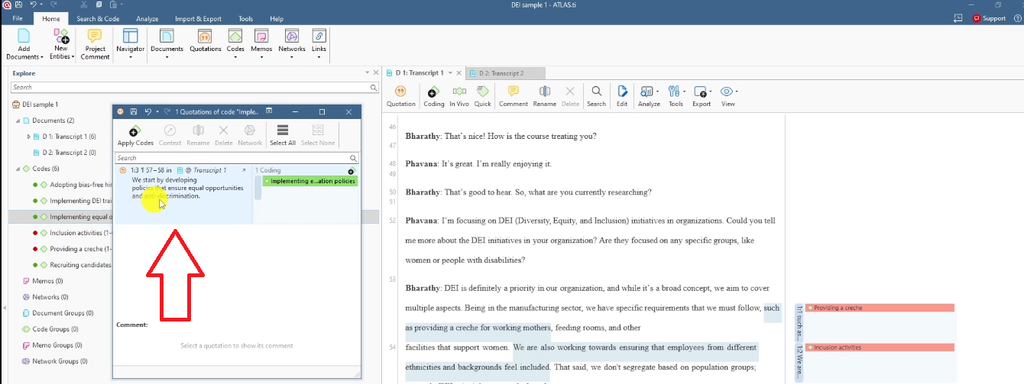
This traceability is one of the biggest advantages of dedicated qualitative analysis software over manually highlighting a Word document. For a broader look at why this rigor matters, Scribbr’s guide to qualitative research methods is a useful primer if you’re still deciding on your overall approach. If NVivo is your tool of choice instead, the same familiarization-then-coding workflow applies — see my guide to coding interviews in NVivo for the NVivo-specific steps.
If you’d rather skip straight to a finished analysis, this is exactly the kind of coding work I handle in my ATLAS.ti done-for-you service — manual coding, theme development, and a findings report, done for you.
Common Mistakes to Avoid When Coding Interviews in ATLAS.ti
- Coding before familiarizing yourself with the full transcript. Jumping straight to highlighting produces inconsistent, contradictory codes.
- Writing codes that just repeat the participant’s words. A good code interprets the meaning in shorthand — it doesn’t just copy a phrase verbatim.
- Skipping the color-coding or grouping system. Without a way to trace codes back to their source, theme development later becomes far harder than it needs to be.
- Creating a new code for every quotation instead of reusing existing ones. Check your codebook before adding a new code — you may already have one that fits.
- Coding in isolation from your research questions. Every code should tie back to what you’re actually trying to answer, not just “interesting” statements in general.
What Comes Next After Initial Coding
At this point, you’ve completed the first two steps of Braun and Clarke’s framework: familiarizing yourself with the data and generating your initial codes. From here, the next steps involve grouping related codes into candidate themes, reviewing and refining those themes against the full dataset, writing clear definitions for each one, and finally producing your findings report.
Frequently Asked Questions
What is the best way to start qualitative analysis of interviews in ATLAS.ti?
Start by importing your transcripts, then read each one fully before coding (familiarization), and only then begin applying codes to meaningful segments of text.
Do I need to use the Braun and Clarke method in ATLAS.ti?
No — ATLAS.ti supports multiple coding approaches, including Saldana’s method. Braun and Clarke’s six-step framework is simply one of the most widely used and accepted approaches for inductive thematic analysis.
How many codes should I expect from one interview transcript?
It varies widely by study and transcript length, but it’s common to generate dozens of codes from a single semi-structured interview once you code thoroughly, question by question.
Can ATLAS.ti do the coding for me?
ATLAS.ti offers AI-assisted coding suggestions, but the interpretive judgment behind reflexive thematic analysis — deciding what a segment of text actually means in context — still requires a human researcher.
Key Takeaways
- Qualitative analysis of interviews in ATLAS.ti starts with importing transcripts and familiarizing yourself with the full text before coding.
- A code is a concise label or interpretive statement attached to meaningful text — not a copy of the participant’s exact words.
- Braun and Clarke’s six-step framework (familiarization, initial coding, generating themes, reviewing themes, defining themes, reporting) is the most common structure for inductive thematic analysis.
- Color-coding your codes by question or category makes it far easier to trace codes back to their source when you move into theme development.
- Avoid common mistakes like coding before familiarization, duplicating codes unnecessarily, or drifting away from your research questions.
Get Help With Your Qualitative Data Analysis
If you’re feeling stuck on your data analysis chapter, you don’t have to figure it out alone. I offer a done-for-you qualitative data analysis service using ATLAS.ti that covers coding, theme development, and visualization from start to finish. If you’d rather learn to do the analysis yourself, I also offer one-on-one ATLAS.ti consulting, where I guide you step by step through mastering the software and running your own qualitative data analysis.
![Qualitative Analysis of Interviews in ATLAS.ti [Step-by-Step]](https://survivingresearch.com/wp-content/uploads/2025/09/Qualitative-Data-Analysis-Just-Got-Easier-Atlas.ti-Tutorial-2025.jpg)
![Thematic Analysis in ATLAS.ti: Braun and Clarke 6 Steps [Full Guide]](https://survivingresearch.com/wp-content/uploads/2025/10/Thematic-Analysis-with-Atlas-ti.jpg)
Pingback: ATLAS.ti Tutorial: Analyze Interviews from Codes to Findings -